A newer version of this visualization is available.
High-Resolution Soil Moisture Maps
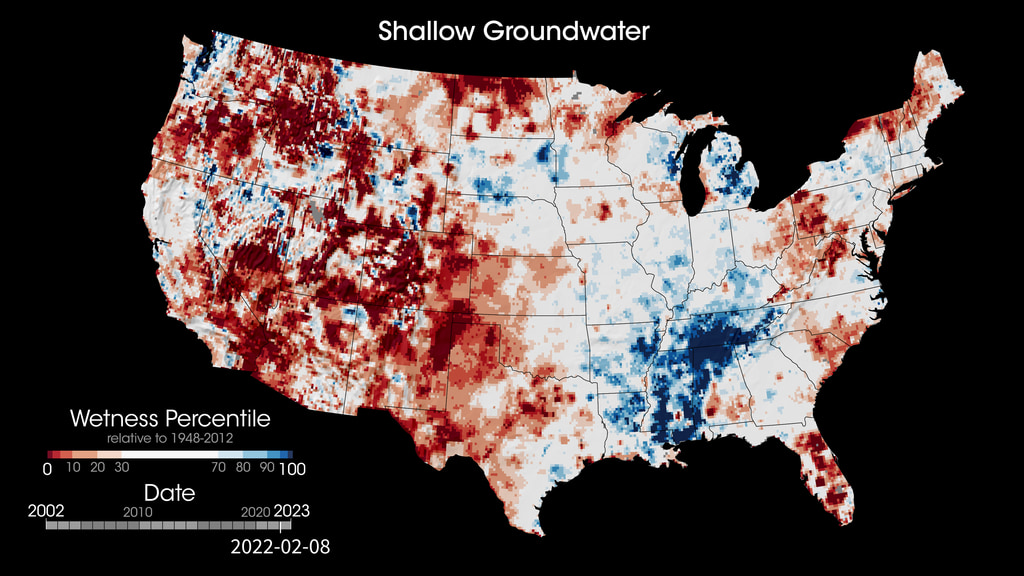
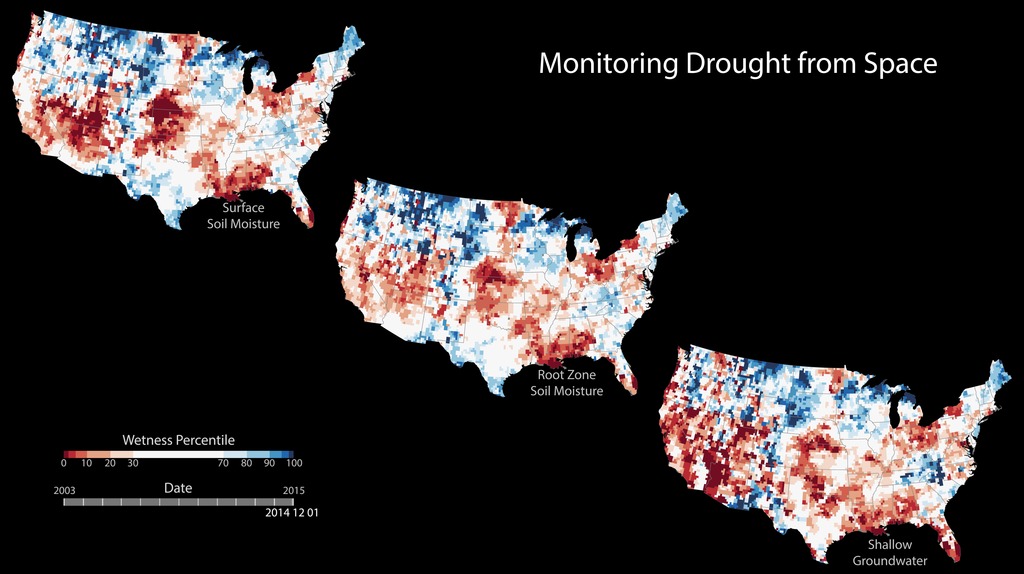
These maps combine data from the twin satellites of the Gravity Recovery and Climate Experiment (GRACE) with other satellite and ground-based measurements to model the relative amount of water stored at two different levels: at plant root level and underground. The wetness, or water content, of each layer is compared to the average between 1948 and 2009. The darkest red regions represent dry conditions that should occur only 2 percent of the time (about once every 50 years). All of the maps are experimental products funded by NASA’s Applied Sciences Program and developed by scientists at NASA’s Goddard Space Flight Center and the National Drought Mitigation Center. The maps do not attempt to represent human consumption of water; but rather, they show changes in water storage related to weather, climate, and seasonal patterns.
Soil moisture in the root zone compared to ground water storage.
A ground water storage map showing groundwater in aquifers.
A Root Zone Soil Moisture map showing moisture content in the “root zone,” or the top meter (39 inches) of soil.
Credits
Please give credit for this item to:
NASA
-
Scientist
- Matthew Rodell (NASA/GSFC)
Release date
This page was originally published on Wednesday, December 16, 2015.
This page was last updated on Tuesday, November 14, 2023 at 12:31 AM EST.
Missions
This visualization is related to the following missions:Newer Versions
- ID: 31176
 Hyperwall Visual
Older Versions
- ID: 30177
 Hyperwall Visual