Hurricane Ian Forms South of Cuba
Hurricane Ian off the Cuban Coast on September 26, 2022 at 20:29Z.
Hurricane Ian became one of the strongest hurricanes on record to strike Florida when it made landfall September 28th, 2022, around 3:10 pm (EDT) as a Category 4 storm near Cayo Costa about 20 miles west-southwest of Punta Gorda on Florida’s southwest coast. This same area was hard hit by Hurricane Charley back in 2004, which also made landfall as a strong Category 4 storm. Both storms passed over and responded to the deep, warm waters of the southeastern Gulf of Mexico.
Ian originated from a tropical easterly wave that propagated westward off the coast of Africa across the tropical Atlantic and entered the eastern Caribbean on the evening of the 21st of September. Two days later, on the morning of the 23rd, this wave had organized enough to become a tropical depression before strengthening into Tropical Storm Ian later that same evening. With its array of active and passive sensors, the GPM Core Observatory satellite is ideal for monitoring and studying tropical cyclones, including hurricanes. The following animation follows Ian as moves out of the central and into the northwestern Caribbean in the direction of western Cuba. The first part of the animation shows a time loop of surface rainfall estimates beginning at 18:57 UTC (2:57 pm EDT) on 25 September from NASA’s IMERG precipitation product. These surface rainfall estimates are useful for showing not only the track but also the time evolution of tropical cyclones. At the start of the loop, IMERG shows some banding with generally weak curvature and a mixture of light to moderate to heavy rain rates scattered across Ian’s circulation. By the end of the IMERG loop at 19:34 UTC (3:34 pm EDT) on the 26th, much more distinct rainbands exhibiting strong curvature and containing coherent areas of heavy rain (red areas) wrap completely around the storm’s center, indicative of a much larger and stronger cyclonic circulation. At the start of IMERG loop, Ian was a moderate tropical storm with maximum sustained winds reported at 50 mph by the National Hurricane Center (NHC). By the end of the loop, Ian was a Category 1 hurricane with maximum sustained winds reported at 85 mph and on its way to becoming a Category 2 hurricane just a short time later.
The second part of the animation shows a detailed look into the structure and intensity of the precipitation within Ian from the GPM Core Observatory after it flew over the center of Ian around 19:22 UTC (3:22 pm EDT) on the 26th when the storm was just south of Cuba. Surface rainfall estimates from the GPM Microwave Imager (GMI) show heavy rainbands (in red) wrapping completely around the storm with intense rain rates (shown in magenta) wrapping around the western side of the center. GPM’s Dual-frequency Precipitation Radar (DPR) actively scanned the storm to provide a 3D perspective of its precipitation. Areas shaded in blue show frozen precipitation aloft, mainly in the form of snow but also graupel (rimed snow particles) and frozen drops, which are both present in the cores of active thunderstorms. The structure and height of these particles can suggest future trends in the storm’s intensity. The DPR shows deep towers that are producing intense rain within the western and southern parts eyewall. These features suggest strong thunderstorms are actively releasing heat into Ian’s core circulation and priming the storm for possible further intensification. At the time of the GPM overpass, Ian moving was to the north-northwest around the western edge of a midlevel ridge in the direction of Cuba with maximum sustained winds reported at 85 mph by NHC. However, less than 2 hours later at 2100 UTC (5:00 pm EDT) Ian’s sustained winds were up to 100 mph, making it a Category 2 hurricane. Ian continued to strengthen and made landfall early the next morning at 4:30 am (EDT) on the 27th as a Category 3 storm with sustained winds reported at 125 mph by NHC near the town of La Coloma in western Cuba. Ian weakened slightly after crossing over Cuba before re-intensifying over the southeast Gulf of Mexico and striking southwest Florida.

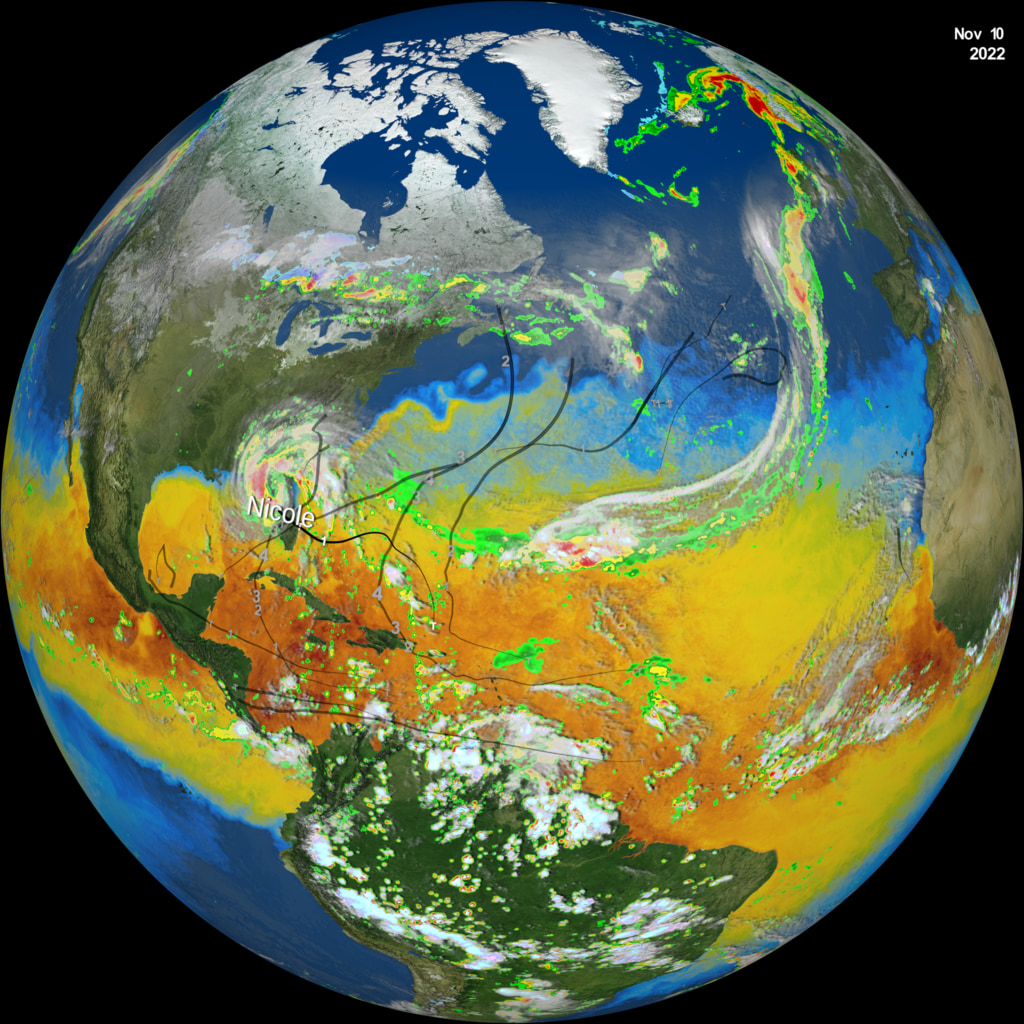
Color bar for liquid precipitation rates (ie, rain rates). Shades of green represent low amounts of liquid precipitation, whereas shades of red represent high amounts of precipitation.
Color bar for frozen precipitation rates (ie, snow rates). Shades of cyan represent low amounts of frozen precipitation, whereas shades of purple represent high amounts of precipitation.
Credits
Please give credit for this item to:
NASA's Scientific Visualization Studio. Data provided by the joint NASA/JAXA GPM mission.
-
Data visualizers
- Alex Kekesi (Global Science and Technology, Inc.)
- Greg Shirah (NASA/GSFC)
-
Scientists
- George Huffman (NASA/GSFC)
- Scott Braun (NASA/GSFC)
- Jacob Reed (Telophase)
-
Writer
- Stephen Lang (SSAI)
-
Technical support
- Laurence Schuler (ADNET Systems, Inc.)
- Ian Jones (ADNET Systems, Inc.)
Release date
This page was originally published on Wednesday, September 28, 2022.
This page was last updated on Wednesday, November 15, 2023 at 12:18 AM EST.
Missions
This visualization is related to the following missions:Series
This visualization can be found in the following series:Datasets used in this visualization
-
CPC (Climate Prediction Center) Cloud Composite
ID: 600Global cloud cover from multiple satellites
See all pages that use this dataset -
Rain Rates (Surface Precipitation) [GPM: GMI]
ID: 822Credit: Data provided by the joint NASA/JAXA GPM mission.
See all pages that use this dataset -
Volumetric Precipitation data (Ku) [GPM: DPR]
ID: 830Credit: Data provided by the joint NASA/JAXA GPM mission.
See all pages that use this dataset -
IMERG
ID: 863This dataset can be found at: http://pmm.nasa.gov/sites/default/files/document_files/IMERG_ATBD_V4.4.pdf
See all pages that use this dataset
Note: While we identify the data sets used in these visualizations, we do not store any further details, nor the data sets themselves on our site.
Related
- ID: 5097
 Visualization