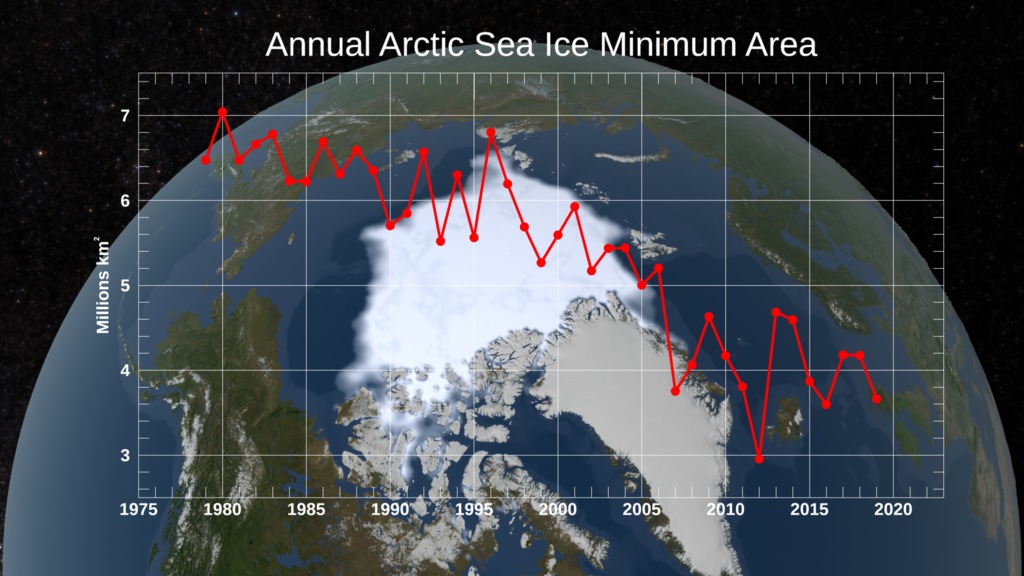
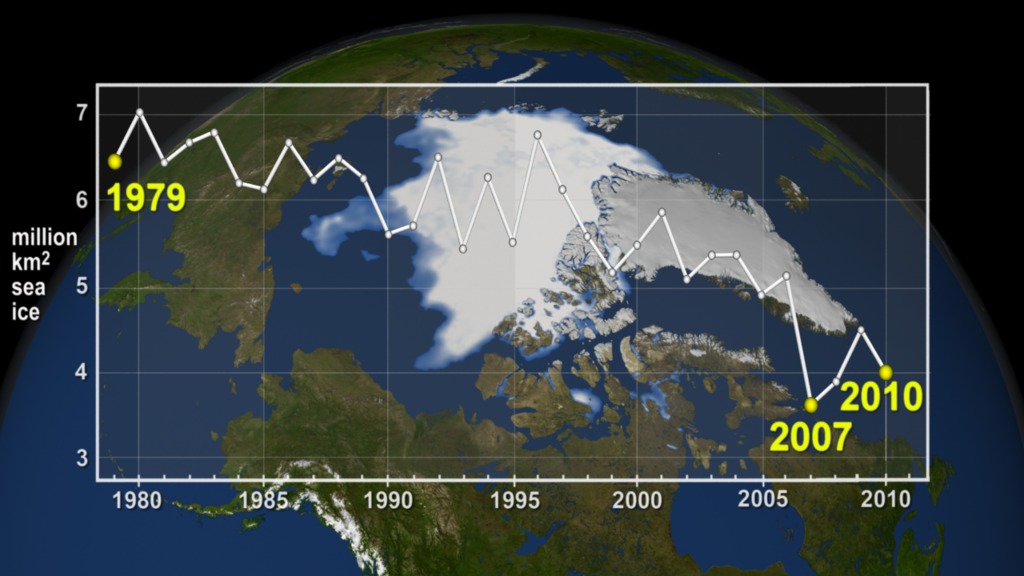
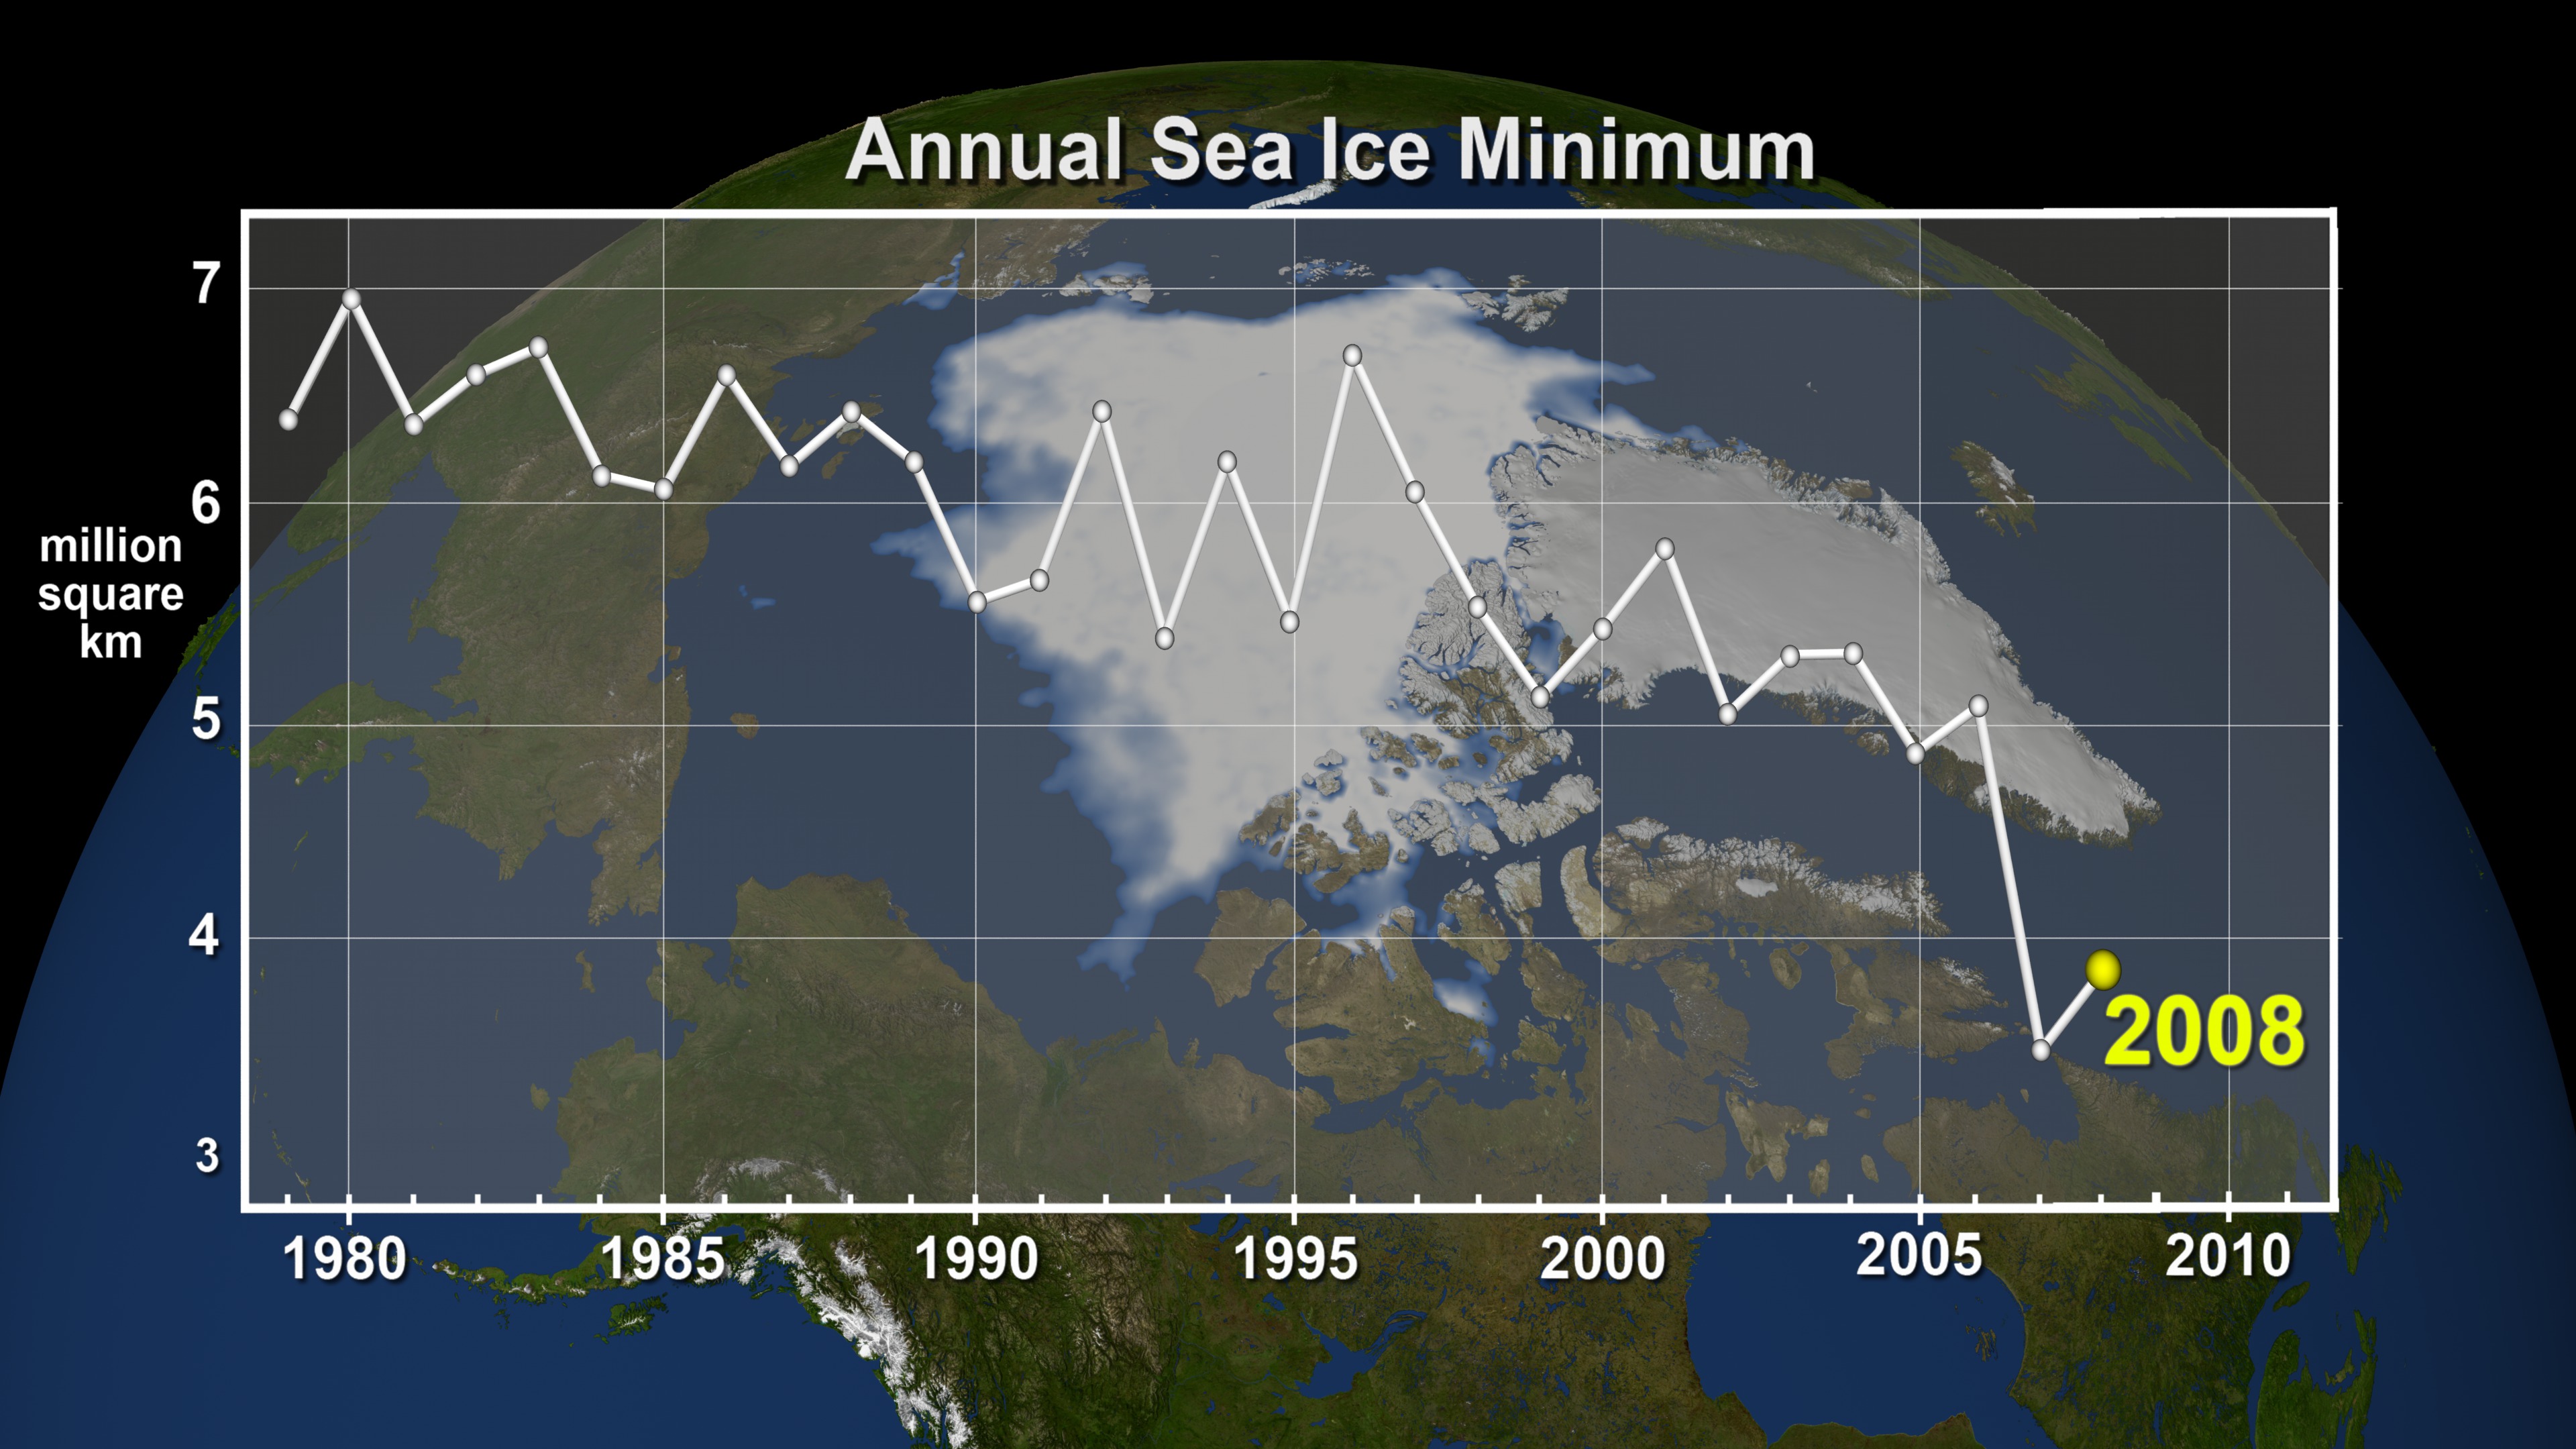
Annual Arctic Sea Ice Minimum Area 1979-2022, With Graph
- Visualizations by:
- Trent L. Schindler
- View full credits
Movies
- sea_ice_min_w_graph_2022_1080p30.mp4 (1920x1080) [34.1 MB]
- sea_ice_min_w_graph_2022_2160p30.mp4 (3840x2160) [98.3 MB]
- sea_ice_min_w_graph_2022_2160p30.webm (3840x2160) [14.9 MB]
Images
- sea_ice_min_w_graph_2022.1199_print.jpg (1024x576) [188.0 KB]
- sea_ice_min_area-w_graph_2022_print_res.png (5760x3240) [14.2 MB]
- sea_ice_min_w_graph_2022.1199_print_thm.png (80x40) [6.7 KB]
Frames
- frames/5760x3240_16x9_30p/sea_ice_min_w_graph_HW/ (5760x3240) [68.0 KB]
Arctic sea ice minimum area 1979-2022, with graph
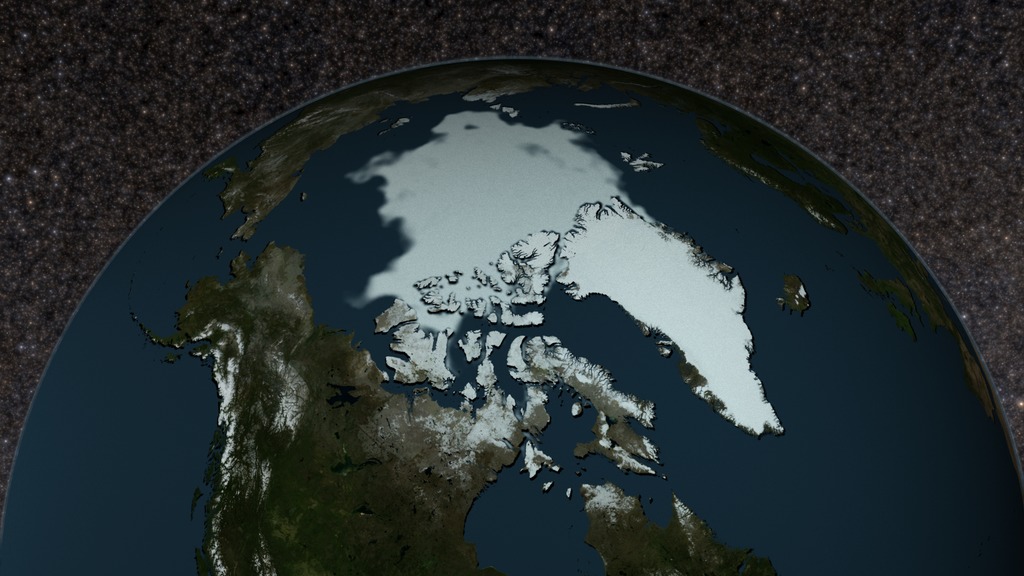
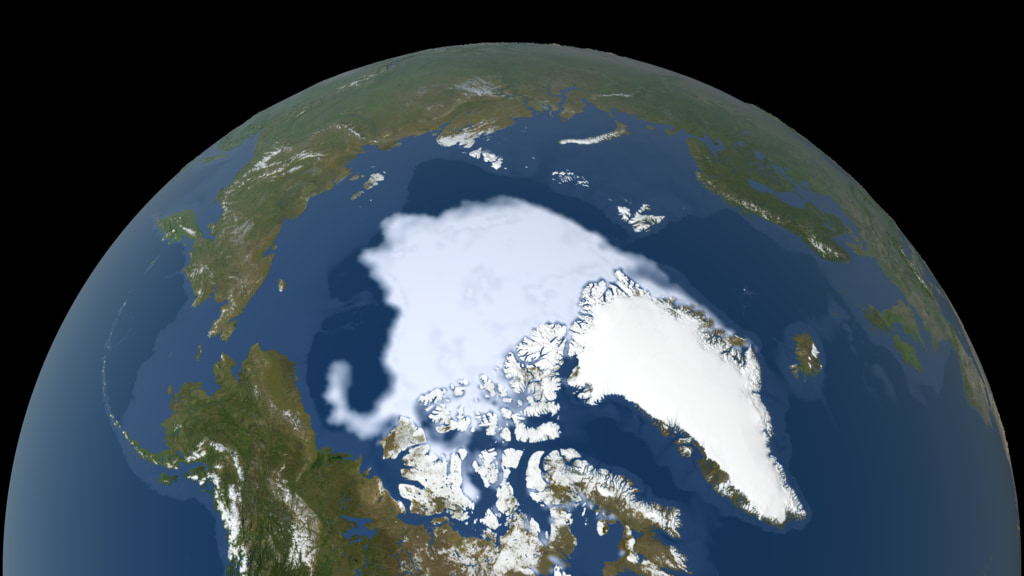
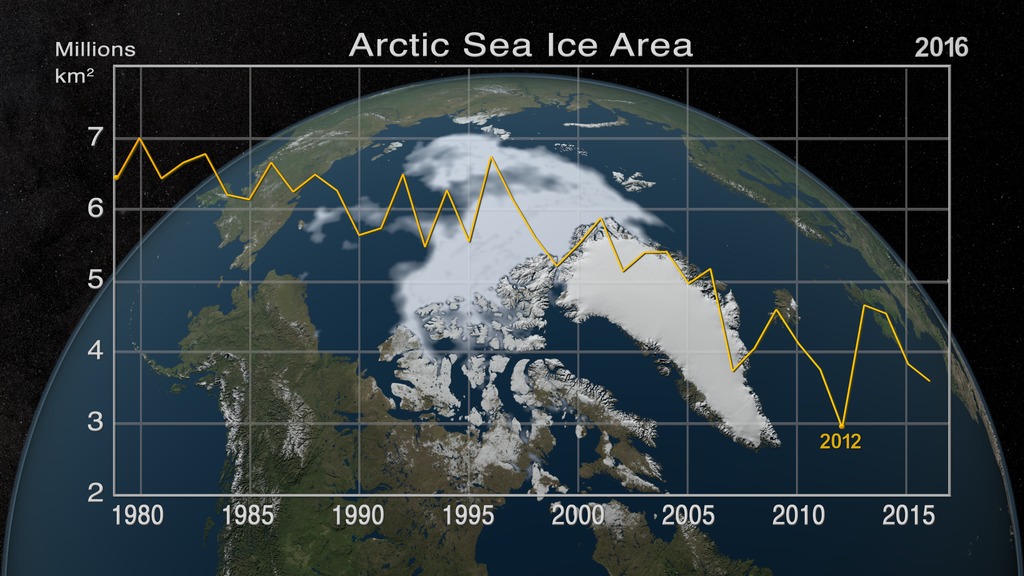
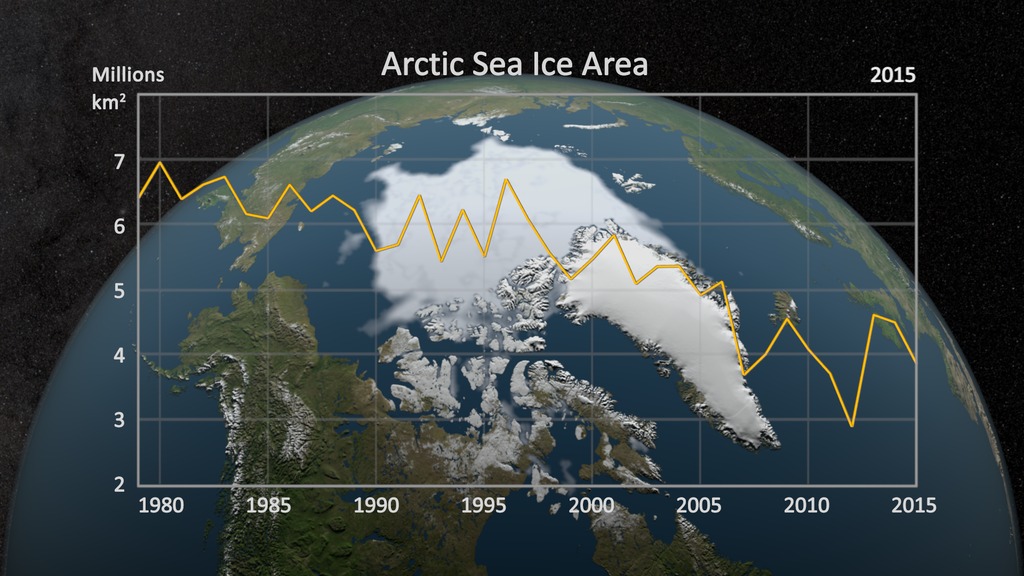
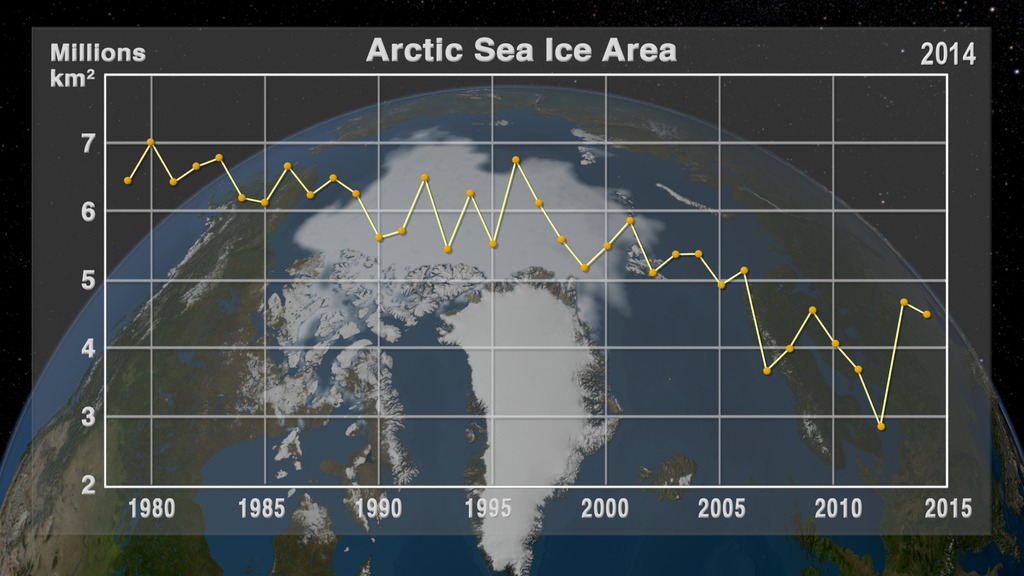
This visualization shows the expanse of the annual minimum Arctic sea ice for each year from 1979 through 2022 as derived from passive microwave data.
Movies
- sea_ice_min_graph_only_2022_1080p30.mp4 (1920x1080) [2.3 MB]
- sea_ice_min_graph_only_2022_2160p30.mp4 (3840x2160) [4.6 MB]
- sea_ice_min_graph_only_2022_2160p30.webm (3840x2160) [5.3 MB]
Images
- sea_ice_min_graph_only_2022.1199_print.jpg (1024x576) [66.0 KB]
Frames
- frames/5760x3240_16x9_30p/sea_ice_min_graph_only/ (5760x3240) [68.0 KB]
Arctic sea ice minimum area 1979-2022, graph only (animation has 5 seconds of lead-in to sync with background)

Arctic sea ice minimum area 1979-2022, by year (each year accessible through dropdown menu)

Arctic sea ice minimum area 1979-2022, by year, no dates (each year accessible through dropdown menu)
Arctic sea ice minimum area 1979-2022, animation, no dates

Arctic sea ice minimum area 1979-2022, by year, dates only (each year accessible through dropdown menu)
Credits
Please give credit for this item to:
NASA/Goddard Space Flight Center Scientific Visualization Studio
The Blue Marble data is courtesy of Reto Stockli (NASA/GSFC).
Visualizers
- Trent L. Schindler (USRA) [Lead]
- Cindy Starr (GST)
Project support
- Eric Sokolowsky (GST)
Technical support
- Ian Jones (ADNET)
- Laurence Schuler (ADNET)
Sr. data analyst
- Robert Gersten (SGT)
Series
This visualization can be found in the following series:Datasets used in this visualization
Comiso's September Minimum Sea Ice Concentration
DMSP Sea Ice Concentration (Collected with the SSM/I sensor)
Note: While we identify the data sets used in these visualizations, we do not store any further details nor the data sets themselves on our site.
Related pages
2020 Global Temperature Announcement Live Shots
Jan. 8th, 2021
Read moreNASA Finds 2020 Tied for Hottest Year on Record The Climate Events of 2020 Show How Excess Heat is Expressed on EarthEl 2020 empató con 2016 como el año más cálido en el registro, según un análisis de la NASA B-roll for 2020 Annual Temperature Update Live Shot. NASA and NOAA Scientists Available January 15 To Share Latest Global Temperature Update With Your ViewersOn January 14th, climate experts from NASA and NOAA will release their annual assessment of global temperatures over the last year. NASA and NOAA scientists are available for one-on-one interviews on January 15th from 6:00AM-1:00PM EST. Find out where 2020 fell in the climate record books, and what it means for the longer term trend. Each year, NASA and NOAA undertake the huge task of measuring the average temperature of the Earth, using an impressive fleet of satellites in orbit as well as scientists making local measurements all around the globe. Understanding these long-term changes is vital to how we interact with our environment, from planting different crops to managing water resources, to predicting the strength of hurricanes.** Interviews will be conducted using video chat programs including Skype in 15-minute slots. For example 600-615 ET, 615-630 ET, etc. Satellite interviews are not available. ** Interviews are available in Spanish**To book an interview please fill out this form: https://forms.gle/LMHA7o75adexoDkR6Participating Scientists:Gavin Schmidt (GISS) / Director, NASA Goddard Institute for Space StudiesTom Neumann / Cryospheric Sciences Lab Chief, NASA GSFCLesley Ott / NASA Climate ScientistLiz (Elizabeth) Hoy (GSFC) / Senior Support Scientist, NASA Carbon Cycle and Ecosystems OfficeRachel Tilling / Cryosphere ScientistRuss Vose / NOAA Chief Climate AnalystAdam Smith / NOAA Disaster ExpertSandra Cauffman / Earth Science Division Deputy Director, NASA HQ [interviews in Spanish]Alfonso Delgado-Bonal / Atmospheric Scientist, NASA GSFC [interviews in Spanish]Mayra Oyola (JPL) / Atmospheric Scientist, NASA JPL [interviews in Spanish]Ahira Sánchez-Lugo / NOAA Climatologist [Interviews in Spanish & English]Suggested Questions:1. NASA and NOAA have just released the global temperature data for 2020. Where does it rank? 2. What does this new information tell us about* [*Please select the question that you believe will hold the most interest for your viewers.]a. hurricane trends after the record-breaking 30 named storms last year?b. wildfires?c. general weather trends that impact viewers all over the country?3. How else do changes to Earth’s global temperature impact us? 4. What do we expect to see in the future in terms of heat and these global events?5. Where can we learn more? Related pages
Measuring the Seas from Space! U.S.-European Satellite Launching THIS SATURDAY Seeks to Answer Vita…
Nov. 17th, 2020
Read moreClick here for: Sentinel-6 Michael Freilich Media Reel. Includes links to associated b-roll Click HERE for lightly edited b-roll showing the launch animation and the satellite in orbit.Click here for the PRESS KITClick here for social media video in SPANISH Includes lightly edited b-roll from the launch animation sequence and various animations of the satellite in orbit Social media video in Spanish about the Sentinel6 Michael Freilich satellite. Soundbites with Erika Podest / JPL, climate scientist. TRT 4:12 Earth’s climate is changing, and one of the clearest signs is rising sea levels in the world’s oceans. THIS Saturday, a U.S.- European collaboration will launch the first of two satellites that will track sea level height over the next decade. NASA and NOAA scientists are available virtually Friday, November 20 from 6:00 a.m. - 12:30 p.m. EST and 7:00 p.m. - 9:30 p.m. EST - one day before launch - and again Saturday, November 21 from 7:00 a.m. - 9:30 a.m. EST - just hours before launch scheduled for 12:17 p.m. EST from Vandenberg Air Force Base in California - to tell your viewers when they can watch the launch, and why it is important to document changing sea level. The Sentinel-6 Michael Freilich satellite will add vital measurements to a nearly 30-year record of sea level observations, giving us valuable insight to how the oceans are responding to climate change. This newest satellite will continue the longest-running series of missions dedicated to answering this question: How fast are Earth’s oceans rising and how will that impact us? The mission consists of two identical satellites, Sentinel-6 Michael Freilich and Sentinel-6B, that will launch five years apart. Along with observing sea levels, these satellites will also provide precise data of atmospheric temperature and humidity that will help improve weather forecasts and climate models.** To Schedule an interview:*** Please fill out this form: https://forms.gle/8hm3u5sG8mukMQLN7Interviews will be conducted using video chat programs including Skype in 15-minute slots. For example 600-615 ET, 615-630 ET, etc. Satellite interviews are not available. *** Spanish Interviews are available ***Participating Scientists: Thomas Zurbuchen / Associate Administrator for the Science Mission Directorate, NASA HeadquartersKaren St. Germain / Earth Science Division Director, NASA HeadquartersNadya Vinogradova Shiffer / Sentinel-6 Michael Freilich Program Scientist, NASA HeadquartersIvona Cetinic / NASA Oceanographer, USRAMichelle Easter / JPL, Mechatronics EngineerBen Hamlington / JPL, Research ScientistJosh Willis / JPL Project Scientist for Sentinel-6Shannon Statham / JPL, Sentinel-6 AMR-C Integration & Test LeadThomas Thammasuckdi / JPL, Ground Data Software Engineer LeadSteve Nerem / University of Colorado, Professor, Aerospace Engineering SciencesEric Leuliette / NOAA, Sentinel-6 Project ScientistCarlos Del Castillo / NASA Scientist [Interviews in Spanish]*Erika Podest / JPL, climate scientist [Interviews in Spanish]*Pedro E. Moreira / JPL, Payload Development / Mechanical Engineer [Interviews in Spanish]*Suggested Questions:Tell us about the new mission that is launching this weekend to better understand sea level rise? Why is measuring sea level important? What does it tell us about climate change?Why do we use satellites to observe the ocean? How do you do that from space?How will data from Sentinel-6 Michael Freilich ( Fry-lick) Satellite help to improve weather forecasts, such as the models that track the formation and evolution of hurricanes? How does sea level rise affect us here in XXXX?What is your role on the mission, and what excites you about it?Where can people learn more and stay up to date on this mission?Suggested Anchor Intro: GLOBAL SEA LEVEL RISE IS ONE OF THE MOST DISTINCTIVE INDICATORS OF CHANGES IN OUR CLIMATE. NOW, NASA, IN COLLABORATION WITH EUROPEAN PARTNERS AND NOAA, IS LAUNCHING THE FIRST OF TWO SATELLITES THAT WILL EXTEND THE RECORD OF SEA LEVEL MEASUREMENTS THROUGH 2030.THE SENTINEL-6 MICHAEL FREILICH SATELLITE WILL ADD TO NEARLY 30 YEARS OF SEA LEVEL RECORDS AND WILL HELP ANSWER VITAL CLIMATE QUESTIONS. TODAY WE HAVE A NASA/NOAA TEAM MEMBER … TO TALK ABOUT THIS IMPORTANT MISSION... For More InformationSee [5 Things to Know About Sentinel-6 Michael Freilich](https://www.nasa.gov/feature/jpl/5-things-to-know-about-sentinel-6-michael-freilich) Related pages
Annual Arctic Sea Ice Minimum 1979-2017 (SSMI data)
Oct. 15th, 2017
Read moreThe annual minimum Arctic sea ice from 1979-2017. The annual minimum Arctic sea ice from 1979-2017 with its corresponding year overlay. Corresponding year for the SSM/I data time series. Satellite-based passive microwave images of the sea ice have provided a reliable tool for continuously monitoring changes in the Arctic ice since 1979. Every summer the Arctic ice cap melts down to what scientists call its "minimum" before colder weather begins to cause ice cover to increase. This graph displays the area of the minimum sea ice coverage each year from 1979 through 2017. In 2017, the Arctic minimum sea ice covered an area of 4.17 million square kilometers. This visualization shows the expanse of the annual minimum Arctic sea ice for each year from 1979 through 2017 as derived from passive microwave data. Related pages
Annual Arctic Sea Ice Minimum 1979-2020 with Area Graph
Oct. 15th, 2020
Read moreArctic Sea Ice Minimum 1979-2020, With Graph Arctic Sea Ice Minimum 1979-2020, By Year, With Dates Arctic Sea Ice Minimum 1979-2020, By Year, No Dates Satellite-based passive microwave images of the sea ice have provided a reliable tool for continuously monitoring changes in the Arctic ice since 1979. Every summer the Arctic ice cap melts down to what scientists call its "minimum" before colder weather begins to cause ice cover to increase. This graph displays the area of the minimum sea ice coverage each year from 1979 through 2020. In 2020, the Arctic minimum sea ice covered an area of 3.36 million square kilometers. This visualization shows the expanse of the annual minimum Arctic sea ice for each year from 1979 through 2020 as derived from passive microwave data. A graph overlay shows the area in million square kilometers for each year's minimum day. Related pages
Annual Arctic Sea Ice Minimum 1979-2019 with Area Graph
Jan. 9th, 2020
Read moreArctic Sea Ice Minimum 1979-2019, With Graph Arctic Sea Ice Minimum 1979-2019, No Graph Arctic Sea Ice Minimum 1979-2019, Graph Only Arctic Sea Ice Minimum 1979-2019, By Year Satellite-based passive microwave images of the sea ice have provided a reliable tool for continuously monitoring changes in the Arctic ice since 1979. Every summer the Arctic ice cap melts down to what scientists call its "minimum" before colder weather begins to cause ice cover to increase. This graph displays the area of the minimum sea ice coverage each year from 1979 through 2019. In 2019, the Arctic minimum sea ice covered an area of 3.66 million square kilometers. This visualization shows the expanse of the annual minimum Arctic sea ice for each year from 1979 through 2019 as derived from passive microwave data. A graph overlay shows the area in million square kilometers for each year's minimum day. The date shown in the upper right corner indicates the current year being displayed. Related pages
Annual Arctic Sea Ice Minimum 1979-2018 with Area Graph
Sept. 26th, 2018
Read moreAnnual Arctic Sea Ice Minimum Area, With Graph Annual Arctic Sea Ice Minimum, No Graph Annual Arctic Sea Ice Minimum Area, Hyperwall SIze Annual Arctic Sea Ice Minimum Area, Print Resolution Still Non-interpolated Yearly Sea Ice Area Sequence, Stationary Camera Satellite-based passive microwave images of the sea ice have provided a reliable tool for continuously monitoring changes in the Arctic ice since 1979. Every summer the Arctic ice cap melts down to what scientists call its "minimum" before colder weather begins to cause ice cover to increase. This graph displays the area of the minimum sea ice coverage each year from 1979 through 2018. In 2018, the Arctic minimum sea ice covered an area of 4.15 million square kilometers. This visualization shows the expanse of the annual minimum Arctic sea ice for each year from 1979 through 2018 as derived from passive microwave data. A graph overlay shows the area in million square kilometers for each year's minimum day. The date shown in the upper right corner indicates the current year being displayed. Related pages
Annual Arctic Sea Ice Minimum 1979-2016 with Area Graph
May 31st, 2017
Read moreA visualization of the annual minimum Arctic sea ice from 1979 to 2016 with a graph overlay. (fast playback)This video is also available on our YouTube channel. A visualization of the annual minimum Arctic sea ice from 1979 to 2016 with a graph overlay. (slow playback) A visualization of the annual minimum Arctic sea ice from 1979 to 2016 with the date. (fast playback) A visualization of the annual minimum Arctic sea ice from 1979 to 2016 with the date. (slow playback) The graph overlay with transparency that matches the "fast playback" visualization above The graph overlay with transparency that matches the "slow playback" visualization above This is sequence of still images consisting of one image per year. The file names include the year of each image. Satellite-based passive microwave images of the sea ice have provided a reliable tool for continuously monitoring changes in the Arctic ice since 1979. Every summer the Arctic ice cap melts down to what scientists call its "minimum" before colder weather begins to cause ice cover to increase. This graph displays the area of the minimum sea ice coverage each year from 1979 through 2016. In 2016, the Arctic minimum sea ice covered an area of 3.57 million square kilometers. This visualization shows the expanse of the annual minimum Arctic sea ice for each year from 1979 through 2016 as derived from passive microwave data. A graph overlay shows the area in million square kilometers for each year's minimum day. The date shown in the upper right corner indicates the current year being displayed. Related pages
Annual Arctic Sea Ice Minimum 1979-2015 with Area Graph
March 10th, 2016
Read moreAn animation of the annual Arctic sea ice minimum with a graph overlay showing the area of the minimum sea ice in millions of square kilometers.This video is also available on our YouTube channel. An animation of the annual Arctic sea ice minimum from 1979 through 2015 with a date. The graph overlay with transparency An image of the Arctic minimum sea ice on September 7, 2015 when it covered an area of 3.884 million square kilometers. An image of the Arctic minimum sea ice on September 14, 2014 when it covered an area of 4.527 million square kilometers. An image of the Arctic minimum sea ice on September 9, 2013 when it covered an area of 4.645 million square kilometers. An image of the Arctic minimum sea ice on September 12, 2012 when it covered an area of 2.91 million square kilometers. An image of the Arctic minimum sea ice on September 6, 2011 when it covered an area of 3.734 million square kilometers. An image of the Arctic minimum sea ice on September 17, 2010 when it covered an area of 4.106 million square kilometers An image of the Arctic minimum sea ice on September 12, 2009 when it covered an area of 4.587 million square kilometers. An image of the Arctic minimum sea ice on September 17, 2008 when it covered an area of 4.033 million square kilometers. An image of the Arctic minimum sea ice on September 14, 2007 when it covered an area of 3.712 million square kilometers. An image of the Arctic minimum sea ice on September 14, 2006 when it covered an area of 5.16 million square kilometers. An image of the Arctic minimum sea ice on September 21, 2005 when it covered an area of 4.951 million square kilometers. An image of the Arctic minimum sea ice on September 8, 2004 when it covered an area of 5.399 million square kilometers. An image of the Arctic minimum sea ice on September 5, 2003 when it covered an area of 5.393 million square kilometers. An image of the Arctic minimum sea ice on September 8, 2002 when it covered an area of 5.126 million square kilometers. An image of the Arctic minimum sea ice on September 16, 2001 when it covered an area of 5.879 million square kilometers. An image of the Arctic minimum sea ice on September 10, 2000 when it covered an area of 5.512 million square kilometers. An image of the Arctic minimum sea ice on September 11,1999 when it covered an area of 5.2 million square kilometers. An image of the Arctic minimum sea ice on September 11, 1998 when it covered an area of 5.607 million square kilometers. An image of the Arctic minimum sea ice on September 2,1997 when it covered an area of 6.133 million square kilometers. An image of the Arctic minimum sea ice on September 8, 1996 when it covered an area of 6.752 million square kilometers. An image of the Arctic minimum sea ice on September 8, 1995 when it covered an area of 5.544 million square kilometers. An image of the Arctic minimum sea ice on September 5, 1994 when it covered an area of 6.273 million square kilometers. An image of the Arctic minimum sea ice on September 4,1993 when it covered an area of 5.469 million square kilometers. An image of the Arctic minimum sea ice on August 31, 1992 when it covered an area of 6.499 million square kilometers. An image of the Arctic minimum sea ice on September 16, 1991 when it covered an area of 5.733 million square kilometers. An image of the Arctic minimum sea ice on September 3, 1990 when it covered an area of 5.635 million square kilometers. An image of the Arctic minimum sea ice on September 9, 1989 when it covered an area of 6.265 million square kilometers. An image of the Arctic minimum sea ice on August 30, 1988 when it covered an area of 6.492 million square kilometers. An image of the Arctic minimum sea ice on August 23, 1987 when it covered an area of 6.248 million square kilometers. An image of the Arctic minimum sea ice on September 8, 1986 when it covered an area of 6.663 million square kilometers. An image of the Arctic minimum sea ice on September 7, 1985 when it covered an area of 6.14 million square kilometers. An image of the Arctic minimum sea ice on September 10, 1984 when it covered an area of 6.206 million square kilometers. An image of the Arctic minimum sea ice on September 6, 1983 when it covered an area of 6.785 million square kilometers. An image of the Arctic minimum sea ice on September 9, 1982 when it covered an area of 6.662 million square kilometers. An image of the Arctic minimum sea ice on September 6, 1981 when it covered an area of 6.438 million square kilometers. An image of the Arctic minimum sea ice on August 26, 1980 when it covered an area of 7.01 million square kilometers. An image of the Arctic minimum sea ice on September 21, 1979 when it covered an area of 6.455 million square kilometers. Satellite-based passive microwave images of the sea ice have provided a reliable tool for continuously monitoring changes in the Arctic ice since 1979. Every summer the Arctic ice cap melts down to what scientists call its "minimum" before colder weather begins to cause ice cover to increase. The ice parameters derived from satellite ice concentration data that are most relevant to climate change studies are sea ice extent and sea ice area. This graph displays the area of the minimum sea ice coverage each year from 1979 through 2015. In 2015, the Arctic minimum sea ice covered an area of 3.885 million square kilometers. This visualization shows the expanse of the annual minimum Arctic sea ice for each year from 1979 through 2015 as derived from SSMI data. A semi-transparent graph overlay shows the area in million square kilometers for each year's minimum day. The date shown in the upper right corner indicates the current year being displayed. Related pages
Annual Arctic Sea Ice Minimum 1979-2014 with Area Graph
April 8th, 2015
Read moreThis animation shows the annual Arctic sea ice minimum with a graph overlay that depicts the area of the sea ice in millions of square kilometers. This animation shows the annual Arctic sea ice minimum from 1979 through 2014 with a date. The graph overlay with transparency showing the annual sea ice area in millions of square kilometers The date overlay with transparency An image of the Arctic sea ice minimum on September 21, 1979 An image of the Arctic sea ice minimum on September 18, 2014 Satellite-based passive microwave images of the sea ice have provided a reliable tool for continuously monitoring changes in the Arctic ice since 1979. Every summer the Arctic ice cap melts down to what scientists call its "minimum" before colder weather begins to cause ice cover to increase. The ice parameters derived from satellite ice concentration data that are most relevant to climate change studies are sea ice extent and sea ice area. This graph displays the area of the minimum sea ice coverage each year from 1979 through 2014. In 2014, the Arctic minimum sea ice covered an area of 4.527 million square kilometers. This visualization shows the expanse of the annual minimum Arctic sea ice for each year from 1979 to 2014 as derived from SSMI data. A semi-transparent graph overlay shows the area in million square kilometers for each year's minimum day. The date shown in the upper right corner indicates the current year being displayed. Related pages
Sea Ice Yearly Minimum 1979-2012 (SSMI data) with Graph
Sept. 19th, 2012
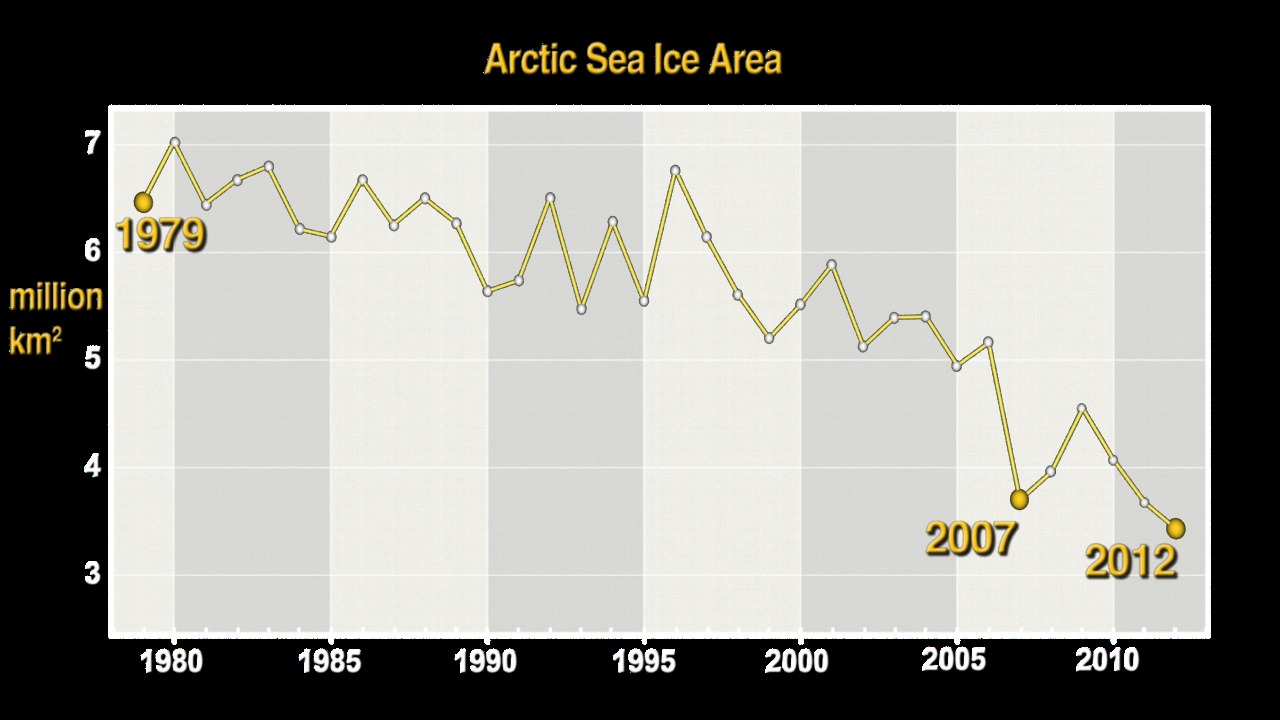
Read moreThis animation shows a semi-transparent graph of the annual minimum area of sea ice in millions of square kilometers. The background shows the annual minimum sea ice concentration over the arctic for each year from 1979 through 2012. The graph alone with transparency. The Arctic with yearly minimum sea ice with dates. The Arctic with yearly minimum sea ice The date overlay with transparency. The continued significant reduction in the area covered by the summer sea ice is a dramatic illustration of the pronounced impact increased global temperatures are having on the Arctic regions. There has also been a significant reduction in the relative amount of older, thicker ice. Satellite-based passive microwave images of the sea ice cover have provided a reliable tool for continuously monitoring changes in the Arctic ice cover since 1979. The ice parameters derived from satellite ice concentration data that are most relevant to climate change studies are sea ice extent and ice area. This visualization shows the annual September minimum sea ice area in the background and a graph of the ice area values foreground. The ice area provides the total area actually covered by sea ice which is useful for estimating the total volume and therefore mass, given the average ice thickness. For more information about these ice datasets, see The Journal of Geophysical Research VOL. 113, C02S07, doi:10.1029/2007JC004257, 2008This visualization shows the annual Arctic sea ice minimum from 1979 to 2012. A semi-transparent graph is overlaid that shows the area in million square kilometers for each year's minimum day. The '1979', '2007', and '2012' data points are highlighted on the graph.For high resolution still images of the 1979 and 2012 September sea ice minimum, see visualization #3998. Related pages
Sea Ice Yearly Minimum 1979-2011 (SSMI data)
Dec. 1st, 2011
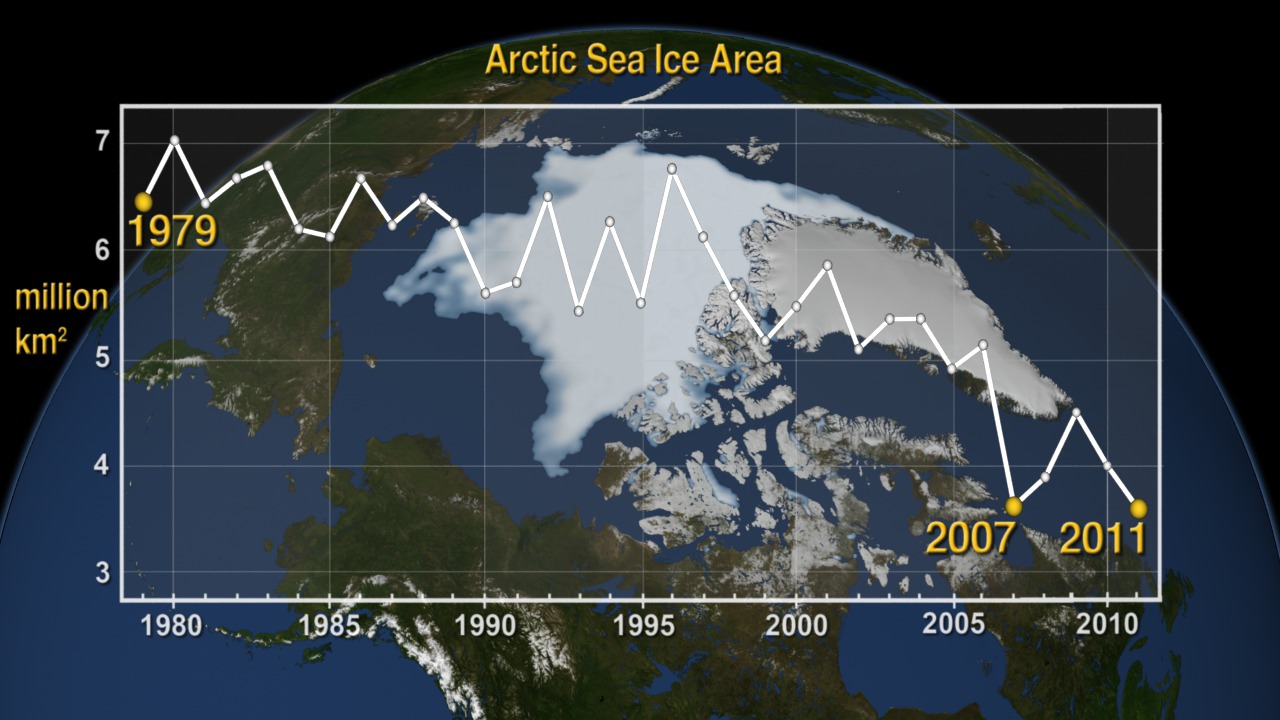
Read moreThe Annual Arctic Sea Ice Minimum Area from 1979 to 2011 with the a graph overlay. Minimum Annual Sea Ice Sequence from 1979 through 2011 without the graph overlay. The graph overlay with transparency An image of the 2011 arctic sea ice minimum with the graph overlay at various resolutions. An image of the 2011 arctic sea ice minimum at various resolutions. The continued significant reduction in the area covered by the summer sea ice is a dramatic illustration of the pronounced impact increased global temperatures are having on the Arctic regions. There has also been a significant reduction in the relative amount of older, thicker ice. Satellite-based passive microwave images of the sea ice cover have provided a reliable tool for continuously monitoring changes in the Arctic ice cover since 1979. The ice parameters derived from satellite ice concentration data that are most relevant to climate change studies are sea ice extent and ice area. This visualization shows the annual September minimum sea ice area in the background and a graph of the ice area values foreground. The ice area provides the total area actually covered by sea ice which is useful for estimating the total volume and therefore mass, given the average ice thickness. For more information about these ice datasets, see The Journal of Geophysical Research VOL. 113, C02S07, doi:10.1029/2007JC004257, 2008This visualization shows the annual Arctic sea ice minimum from 1979 to 2011. A graph is overlaid that shows the area in million square kilometers for each year's minimum day. The '1979','2007', and '2011' data points are highlighted on the graph. Related pages
Sea Ice Yearly Minimum 1979-2010 (SSMI data)
Nov. 11th, 2010
Read moreAnnual Arctic Sea Ice Minimum from 1979 to 2010 with the first dataset, the current dataset, and the lowest dataset highlighted. Annual Arctic Sea Ice Minimum from 1979 to 2010 with alldata represented uniformly on the graph overlay. Minimum Annual Sea Ice Sequence from 1979 through 2010 without any overlay. Overlay sequence: highlighted graph showing annual trend from 1979 to 2010. Overlay sequence: plain graph showing annual trend from 1979 to 2010. September 6, 2009 : Arctic sea ice minimum area for 2009 September 17, 2010 : Arctic sea ice minimum area for 2010 The continued significant reduction in the extent of the summer sea ice cover is a dramatic illustration of the pronounced impact increased global temperatures are having on the Arctic regions. There has also been a significant reduction in the relative amount of older, thicker ice. Satellite-based passive microwave images of the sea ice cover have provided a reliable tool for continuously monitoring changes in the extent of the Arctic ice cover since 1979. The ice parameters derived from satellite ice concentration data that are most relevant to climate change studies are sea ice extent and ice area. This visualization shows ice extent in the background and ice area in the foreground. Ice extent is defined here as the integrated sum of the areas of data elements (pixels) with at least 15% ice concentration while ice area is the integrated sum of the products of the area of each pixel and the corresponding ice concentration. Ice extent provides information about how far south (or north) the ice extends in winter and how far north (or south) it retreats toward the continent in the summer while the ice area provides the total area actually covered by sea ice which is useful for estimating the total volume and therefore mass, given the average ice thickness. For more information about these ice datasets, see The Journal of Geophysical Research VOL. 113, C02S07, doi:10.1029/2007JC004257, 2008 In 2007, Arctic summer sea ice reached its lowest extent on record - nearly 25% less than the previous low set in 2005. At the end of each summer, the sea ice cover reaches its minimum extent and what is left is what is called the perennial ice cover which consists mainly of thick multi-year ice flows. The area of the perennial ice has been steadily decreasing since the satellite record began in 1979, at a rate of about 10% per decade.This visualization shows the annual Arctic sea ice minimum from 1979 to 2010. A graph is overlaid that shows the area in million square kilometers for each year's minimum day. The 1979, 2007, and 2010 data points are highlighted on the graph. Related pages
Sea Ice Yearly Minimum with Graph Overlay 1979-2008
Oct. 28th, 2008
Read moreAnnual Arctic Sea Ice Minimum from 1979 to 2008. Overlay sequence: graph showing annual trend from 1979 to 2008. Minimum Sea Ice Sequence with Date Overlay from 1979 to 2008. Minimum Sea Ice Sequence from 1979 to 2008. This image is the Arctic sea ice minimum area during the week of September 12, 2008. Date Overlay from 1979 to 2008. 21 September 1979 Arctic sea ice minimum area for 1979 05 September 1980 Arctic sea ice minimum area for 1980 10 September 1981 Arctic sea ice minimum area for 1981 17 September 1982 Arctic sea ice minimum area for 1982 18 September 1983 Arctic sea ice minimum area for 1983 16 September 1984 Arctic sea ice minimum area for 1984 07 September 1985 Arctic sea ice minimum area for 1985 06 September 1986 Arctic sea ice minimum area for 1986 02 September 1987 Arctic sea ice minimum area for 1987 12 September 1988 Arctic sea ice minimum area for 1988 23 September 1989 Arctic sea ice minimum area for 1989 19 September 1990 Arctic sea ice minimum area for 1990 16 September 1991 Arctic sea ice minimum area for 1991 04 September 1992 Arctic sea ice minimum area for 1992 11 September 1993 Arctic sea ice minimum area for 1993 05 September 1994 Arctic sea ice minimum area for 1994 01 October 1995 Arctic sea ice minimum area for 1995 10 September 1996 Arctic sea ice minimum area for 1996 19 September 1997 Arctic sea ice minimum area for 1997 12 September 1998 Arctic sea ice minimum area for 1998 11 September 1999 Arctic sea ice minimum area for 1999 11 September 2000 Arctic sea ice minimum area for 2000 19 September 2001 Arctic sea ice minimum area for 2001 12 September 2002 Arctic sea ice minimum area for 2002 11 September 2003 Arctic sea ice minimum area for 2003 11 September 2004 Arctic sea ice minimum area for 2004 21 September 2005 Arctic sea ice minimum area for 2005 14 September 2006 Arctic sea ice minimum area for 2006 14 September 2007 Arctic sea ice minimum The continued significant reduction in the extent of the summer sea ice cover is a dramatic illustration of the pronounced impact increased global temperatures are having on the Arctic regions. There has also been a significant reduction in the relative amount of older, thicker ice. Satellite-based passive microwave images of the sea ice cover have provided a reliable tool for continuously monitoring changes in the extent of the Arctic ice cover since 1979. The ice parameters derived from satellite ice concentration data that are most relevant to climate change studies are sea ice extent and ice area. This visualization shows ice extent in the background and ice area in the foreground. Ice extent is defined here as the integrated sum of the areas of data elements (pixels) with at least 15% ice concentration while ice area is the integrated sum of the products of the area of each pixel and the corresponding ice concentration. Ice extent provides information about how far south (or north) the ice extends in winter and how far north (or south) it retreats toward the continent in the summer while the ice area provides the total area actually covered by sea ice which is useful for estimating the total volume and therefore mass, given the average ice thickness. For more information about these ice datasets, see The Journal of Geophysical Research VOL. 113, C02S07, doi:10.1029/2007JC004257, 2008 Related pages