NASA/JAXA GPM Satellite Eyes Hurricane Ida Shortly Before Landfall
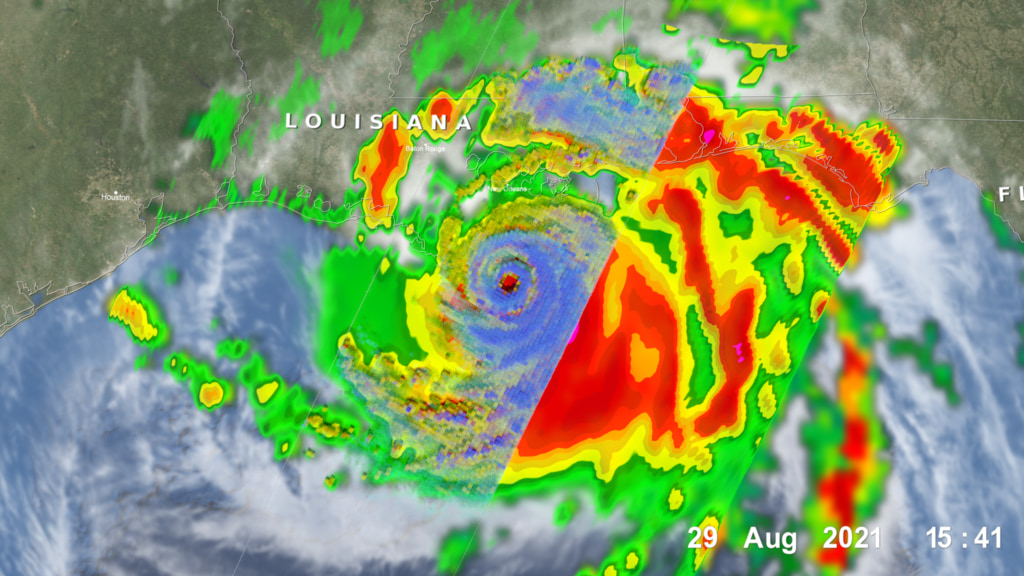
Hurricane Ida off the Louisiana coast as a Category 4 hurricane on the morning of Sunday, August 29th at 10:13am (CDT) right before making landfall.
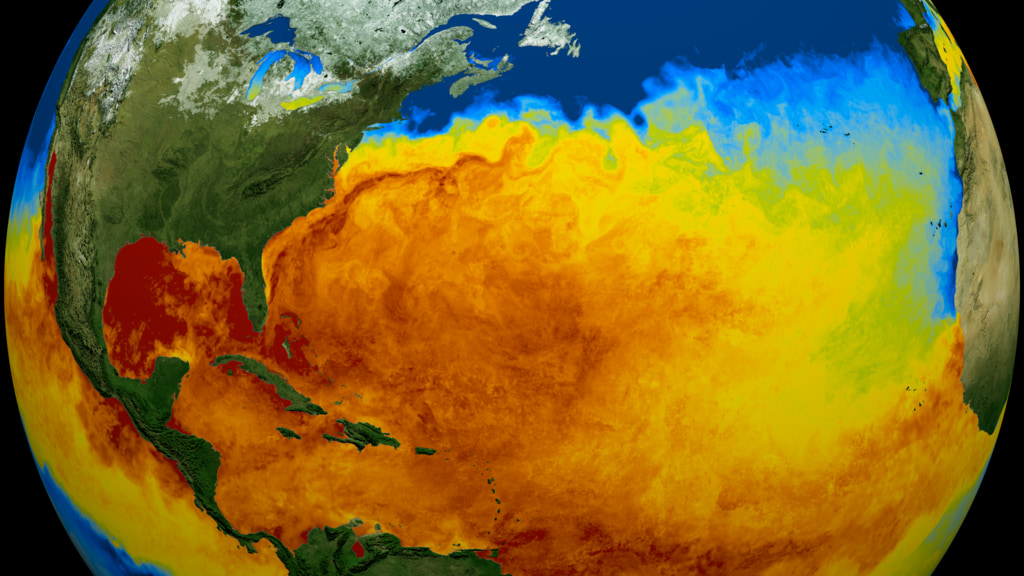
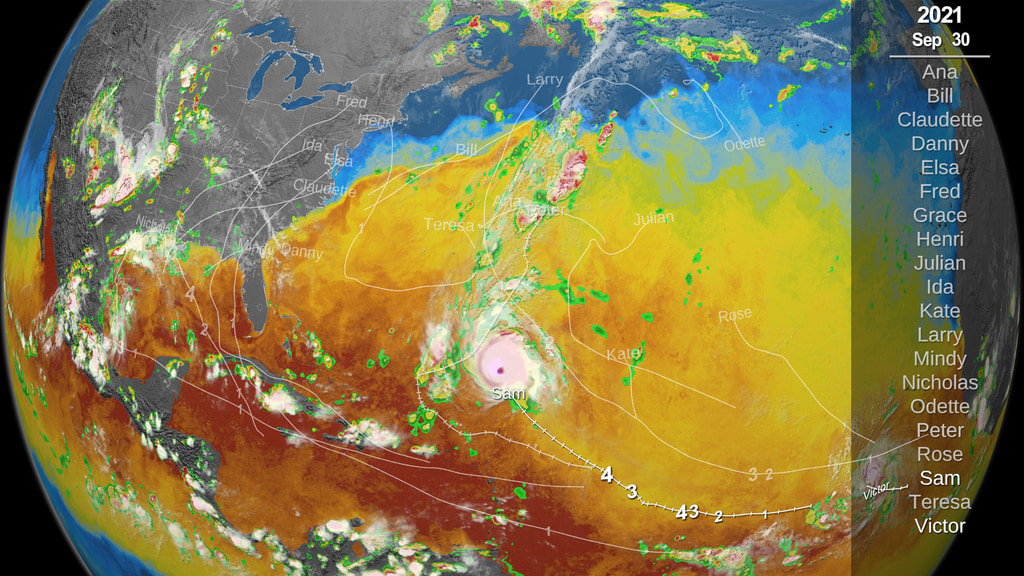
Hurricane Ida struck southeast Louisiana as a powerful Category 4 storm on Sunday, Aug. 29, 2021- the 16th anniversary of Hurricane Katrina’s landfall in 2005. Ida brought destructive storm surge, high winds, and heavy rainfall to the region, and left over 1 million homes and businesses without power, including the entire city of New Orleans.
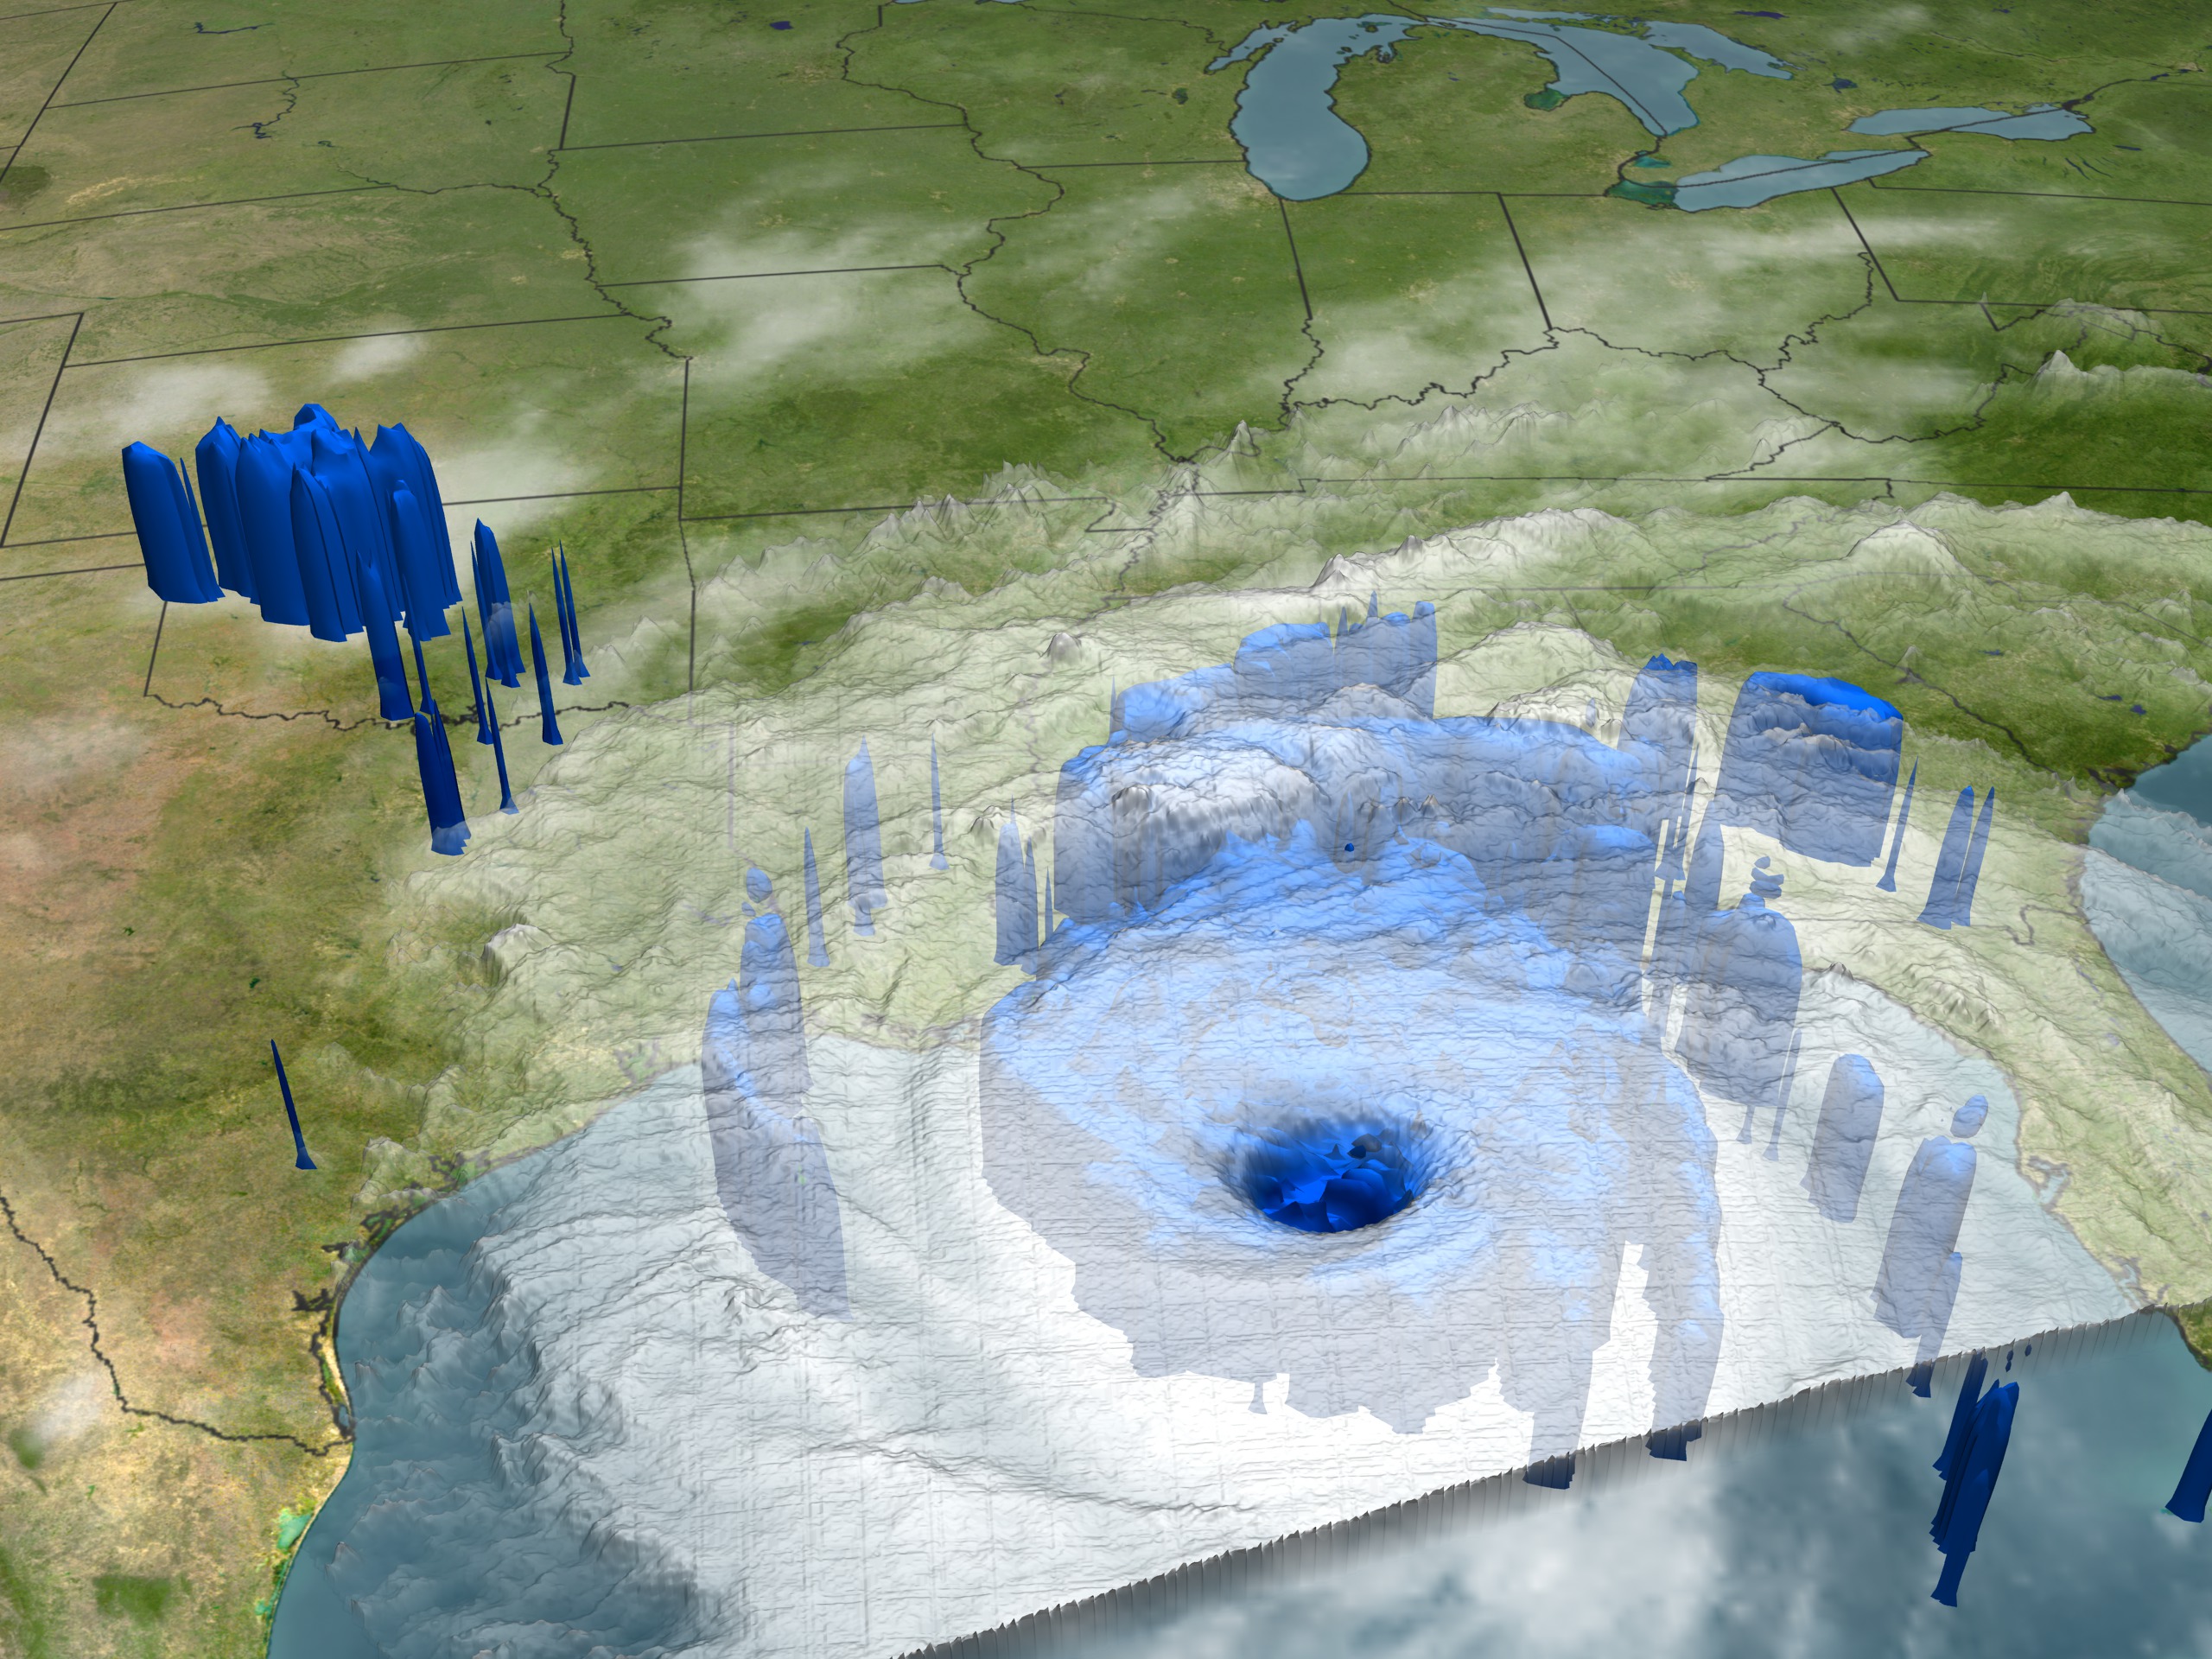
The NASA / JAXA GPM Core Observatory satellite flew over the eye of Ida shortly before landfall at 10:13 a.m. CDT (1513 UTC), capturing data on the structure and intensity of precipitation within the storm. This animation shows NASA's IMERG multi-satellite precipitation estimates and NOAA GOES-E satellite cloud data, followed by 3D data from the GPM Core satellite. NASA processed these observations in near real-time and made them available to a wide range of users including weather agencies and researchers.
After Ida passed over Cuba as a Category 1 storm, it intensified rapidly to reach Category 4 strength near its Louisiana landfall. According to the National Hurricane Center (NHC), Ida's central pressure reached a minimum of 929 hPa with a 15 nautical mile (17 statute mile) wide eye. At the time, Ida had its lifetime-maximum wind speed of 130 kt (150 mph) in the eyewall shortly before 10 a.m. CDT on Aug. 29.
The 3D Dual-frequency Precipitation Radar (DPR) data collected by the GPM Core satellite shows a healthy hurricane inner core in Ida. The small 17-mile-diameter eyewall is surrounded by a nearly complete outer ring of precipitation approximately 85 miles in diameter. Beyond this central structure, an arc of precipitation exists another 40 miles further from the eye to the southeast. The eye hosts many clouds extending well above 6 miles (10 km), which indicates that Ida was still actively growing at the time of this overpass.
NASA continues to monitor Ida as it moves north over the southeastern U.S., providing Earth-observing satellite data, maps and analysis to stakeholders to aid response and recovery efforts.
Get the latest updates on Hurricane Ida from the National Hurricane Center (NHC).
Learn more about how NASA monitors hurricanes.
GPM data is archived at https://pps.gsfc.nasa.gov/

Color bar for frozen precipitation rates (ie, snow rates). Shades of cyan represent low amounts of frozen precipitation, whereas shades of purple represent high amounts of precipitation.
Color bar for liquid precipitation rates (ie, rain rates). Shades of green represent low amounts of liquid precipitation, whereas shades of red represent high amounts of precipitation.
Credits
Please give credit for this item to:
NASA's Scientific Visualization Studio
-
Data visualizers
- Alex Kekesi (Global Science and Technology, Inc.)
- Greg Shirah (NASA/GSFC)
-
Scientists
- George Huffman (NASA/GSFC)
- Owen Kelley (George Mason University)
- Scott Braun (NASA/GSFC)
-
Producer
- Ryan Fitzgibbons (USRA)
-
Writer
- Owen Kelley (George Mason University)
-
Editor
- Jacob Reed (Telophase)
Release date
This page was originally published on Monday, August 30, 2021.
This page was last updated on Monday, April 1, 2024 at 12:14 AM EDT.
Missions
This visualization is related to the following missions:Series
This visualization can be found in the following series:Datasets used in this visualization
-
Rain Rates (Surface Precipitation) [GPM: GMI]
ID: 822Credit: Data provided by the joint NASA/JAXA GPM mission.
See all pages that use this dataset -
Volumetric Precipitation data (Ku) [GPM: DPR]
ID: 830Credit: Data provided by the joint NASA/JAXA GPM mission.
See all pages that use this dataset -
IMERG
ID: 863This dataset can be found at: http://pmm.nasa.gov/sites/default/files/document_files/IMERG_ATBD_V4.4.pdf
See all pages that use this dataset -
[GOES-16: ABI]
ID: 978Advanced Baseline Imager (ABI) has 16 spectral bands, including two visible channels, four near-infrared channels and ten infrared channels. It is nearly identical to the imagers on Himawari 8 and Himawari 9.
See all pages that use this dataset
Note: While we identify the data sets used in these visualizations, we do not store any further details, nor the data sets themselves on our site.
Related
- ID: 4982
 Visualization
 - ID: 4947
 Visualization
 - ID: 3219
 Visualization
Alternate Versions
- ID: 4933
 Visualization