Comparing Atomic Oxygen Emission Observed by GOLD with Ionospheric Total Electron Content (TEC)
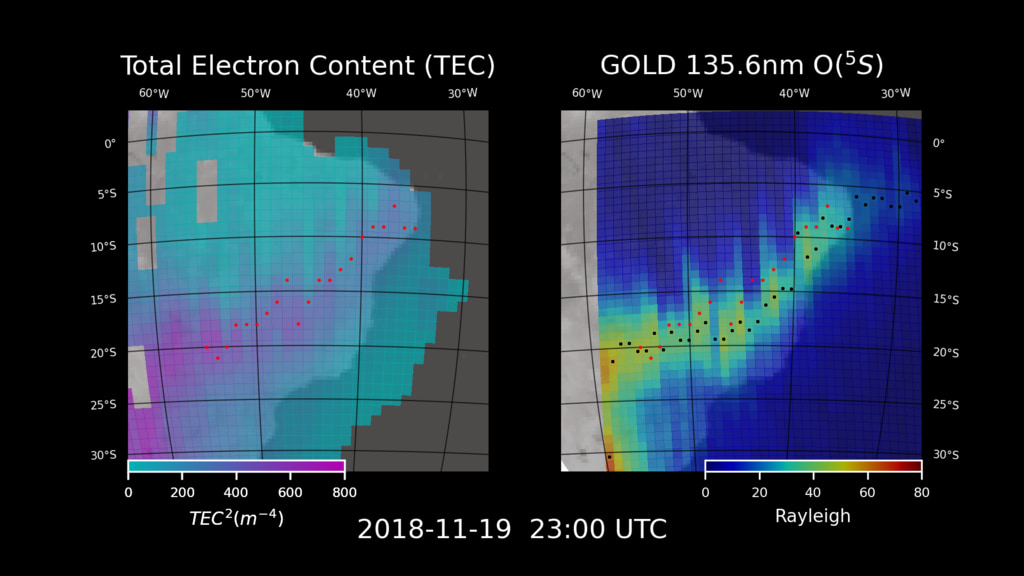
At 23:00UTC on November 19, 2018, we see the maxima of TEC values (red dots) closely aligned with the maxima of OI 135.6nm emission (black dots)
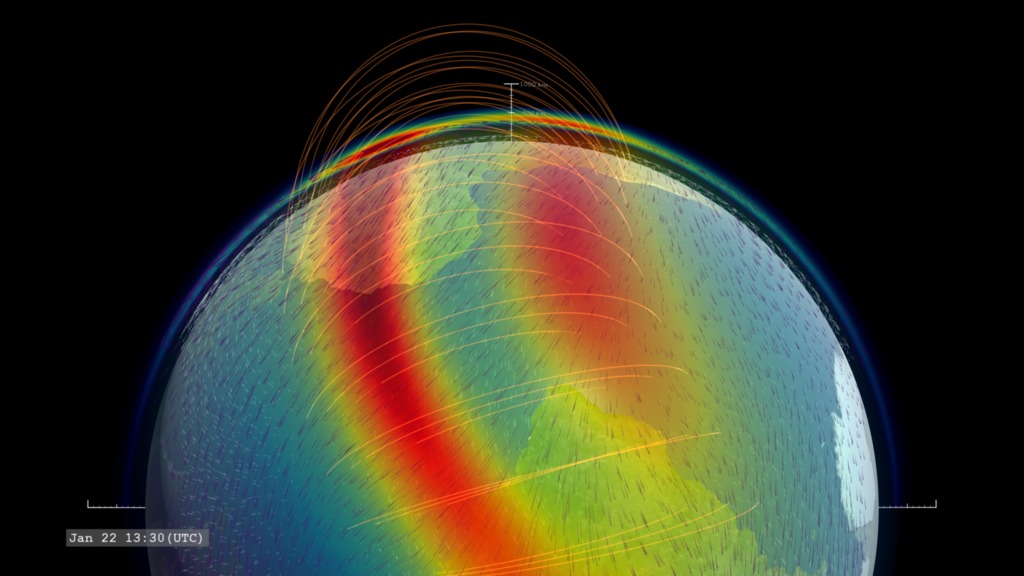
Here we compare the enhanced ionospheric emission by atomic oxygen (OI at 135.6nm) observed by the GOLD instrument (right panel) with measured total electron content (TEC, Wikipedia) measured through the NAVSTAR GPS system (left panel).
The oxygen emission and TEC are both enhanced in two bands known as the Equatorial Ionization Anomaly (EIA) or Appleton anomaly, that straddle Earth's geomagnetic equator. The Appleton anomaly is formed by a process known as the Equatorial Fountain.
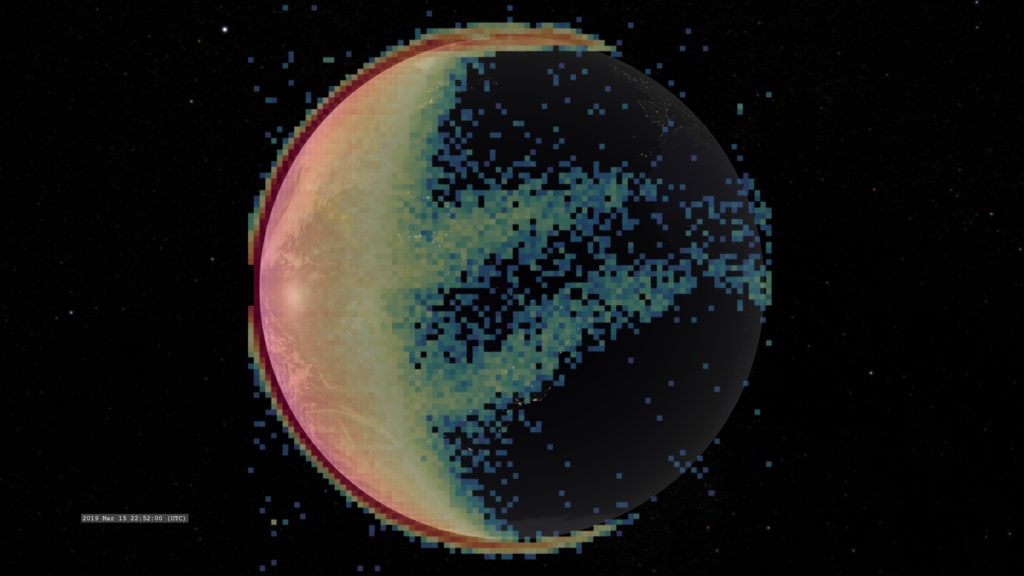
This visualization illustrates the motion of these bands on a global scale over a time scale of a few hours, a capability not available until the GOLD mission.
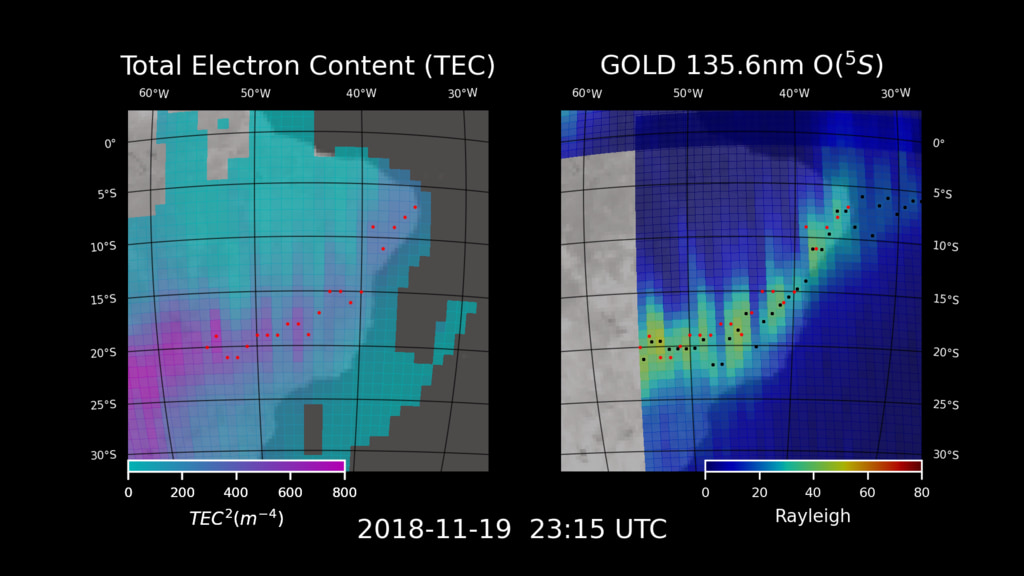
At 23:150UTC we see the maxima of TEC values (red dots) and OI 135.6nm emission (black dots) have shifted slightly southward, but still closely aligned.
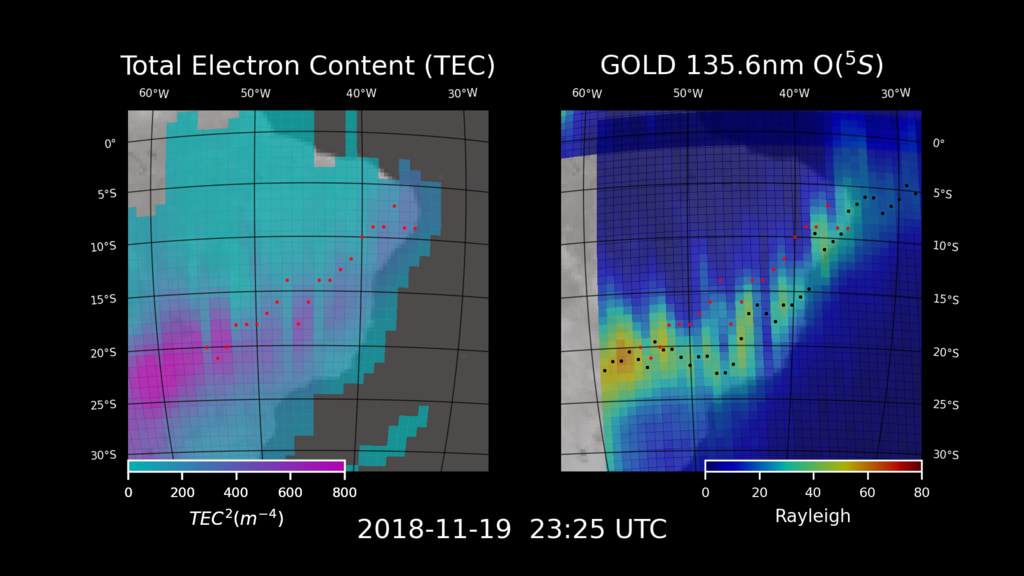
By 23:25UTC we see the maxima of TEC values (red dots) have shifted northward, while the maxima of OI 135.6nm emission (black dots) has moved southward. They are no longer well aligned.
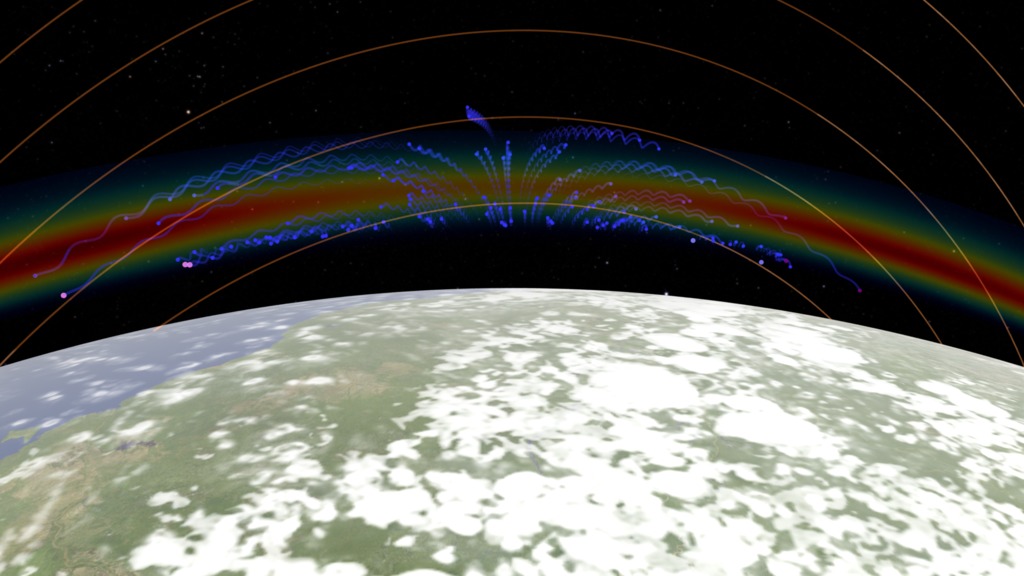
Closeup view of TEC and GOLD data for the evening of November 19, 2018.
Full-disk view of TEC and GOLD data for the evening of November 19, 2018.
For More Information
See NASA.gov
Credits
Please give credit for this item to:
NASA's Scientific Visualization Studio
-
Visualizer
- Tom Bridgman (Global Science and Technology, Inc.)
-
Scientist
- Xuguang Cai (National Center for Atmospheric Research)
-
Producers
- Sarah Frazier (SGT)
- Joy Ng (KBR Wyle Services, LLC)
-
Technical support
- Laurence Schuler (ADNET Systems, Inc.)
- Ian Jones (ADNET Systems, Inc.)
Release date
This page was originally published on Monday, August 30, 2021.
This page was last updated on Wednesday, May 3, 2023 at 1:43 PM EDT.
Missions
This visualization is related to the following missions:Papers used in this visualization
Datasets used in this visualization
-
Total Electron Content (TEC) [NAVSTAR: World-wide GPS Receiver Network]
ID: 580This dataset can be found at: http://www.navcen.uscg.gov/GPS/geninfo/
See all pages that use this dataset -
[SES 14: GOLD]
ID: 1049Global-scale Observations of the Limb and Disk (GOLD) is an ultraviolet imaging spectrograph to measure temperatures and densities in the Earth's thermosphere & ionosphere.
See all pages that use this dataset
Note: While we identify the data sets used in these visualizations, we do not store any further details, nor the data sets themselves on our site.
Related
- ID: 4737
 Visualization
 - ID: 4617
 Visualization
 - ID: 4540
 Visualization