A newer version of this visualization is available.
NASA/JAXA GPM Satellite Captures Tropical Storm Zeta off the Yucatan Peninsula
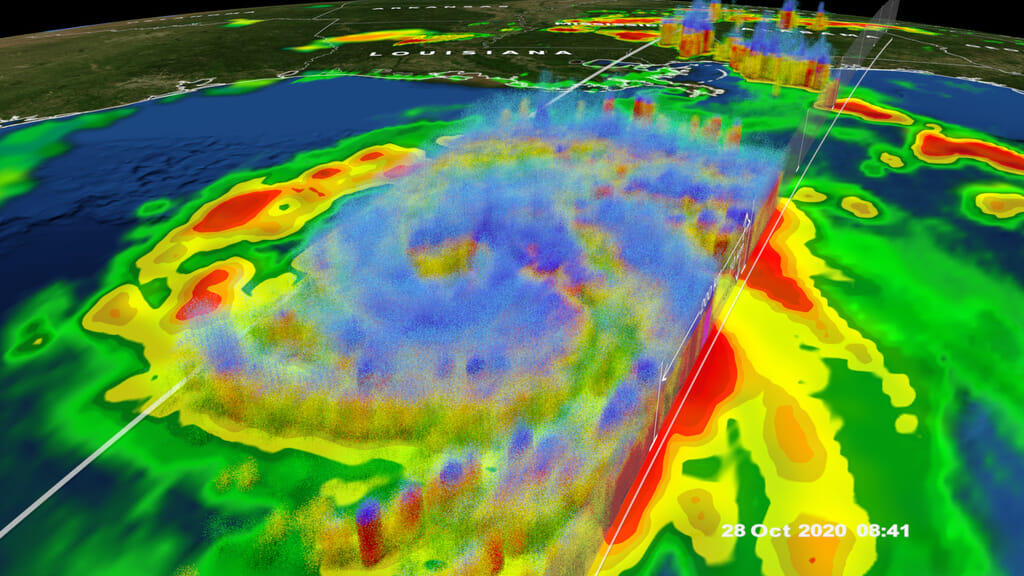
Tropical Storm Zeta on October 25th, 2020 at approximately 2:15 Central Time (19:15 UT).
This video is also available on our YouTube channel.
GPM passed over Tropical Storm Zeta Sunday October 25, 2020 at approximately 2:15pm Central Time (19:15 UTC) as it approached the Yucatan peninsula.
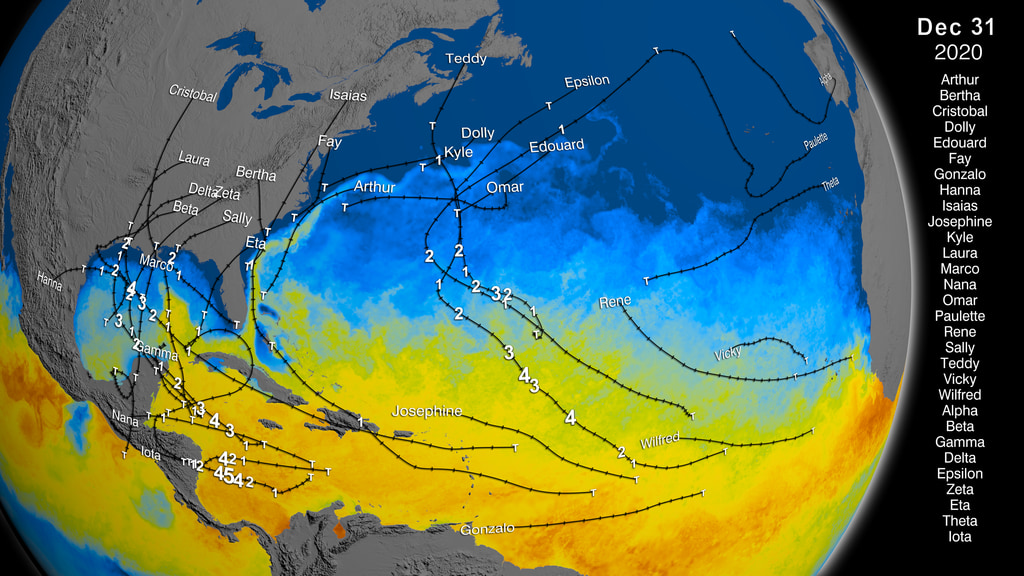
Tropical Storm Zeta is the 27th named storm of 2020 which ties the record for the most named storms since 2005. (See 27 Storms: Arlene to Zeta for a summary of the 2005 hurricane season). With several weeks still left in the 2020 hurricane season, 2020 might well surpass this previous record for most named storms in one season.
Shortly after this data was collected, Zeta briefly reached Hurricane status before turning back into a Tropical Storm as it swept across the Yucatan peninsula. It is currently heading north through the Gulf of Mexico and has re-intensified into a hurricane before making second landfall somewhere on the Gulf coast.
GPM data is archived at https://pps.gsfc.nasa.gov/

Color bar for frozen precipitation rates (ie, snow rates). Shades of cyan represent low amounts of frozen precipitation, whereas shades of purple represent high amounts of precipitation.
Color bar for liquid precipitation rates (ie, rain rates). Shades of green represent low amounts of liquid precipitation, whereas shades of red represent high amounts of precipitation.
Credits
Please give credit for this item to:
NASA's Scientific Visualization Studio
-
Data visualizers
- Alex Kekesi (Global Science and Technology, Inc.)
- Greg Shirah (NASA/GSFC)
-
Scientists
- George Huffman (NASA/GSFC)
- Dalia B Kirschbaum (NASA/GSFC)
-
Producers
- Kathryn Mersmann (USRA)
- Ryan Fitzgibbons (USRA)
- Katie Jepson (USRA)
Release date
This page was originally published on Tuesday, October 27, 2020.
This page was last updated on Wednesday, November 15, 2023 at 12:16 AM EST.
Missions
This visualization is related to the following missions:Series
This visualization can be found in the following series:Datasets used in this visualization
-
Rain Rates (Surface Precipitation) [GPM: GMI]
ID: 822Credit: Data provided by the joint NASA/JAXA GPM mission.
See all pages that use this dataset -
Volumetric Precipitation data (Ku) [GPM: DPR]
ID: 830Credit: Data provided by the joint NASA/JAXA GPM mission.
See all pages that use this dataset -
IMERG
ID: 863This dataset can be found at: http://pmm.nasa.gov/sites/default/files/document_files/IMERG_ATBD_V4.4.pdf
See all pages that use this dataset -
[GOES-16: ABI]
ID: 978Advanced Baseline Imager (ABI) has 16 spectral bands, including two visible channels, four near-infrared channels and ten infrared channels. It is nearly identical to the imagers on Himawari 8 and Himawari 9.
See all pages that use this dataset
Note: While we identify the data sets used in these visualizations, we do not store any further details, nor the data sets themselves on our site.
Related
- ID: 4884
 Visualization
 - ID: 10829
 Produced Video
Newer Versions
- ID: 4870