NASA/JAXA GPM Satellite Eyes Hurricane Zeta on its way to New Orleans
Hurricane Zeta on Wednesday October 28th, 2020 at approximately 3:25 am Central Time (8:25 UTC).
This video is also available on our YouTube channel.
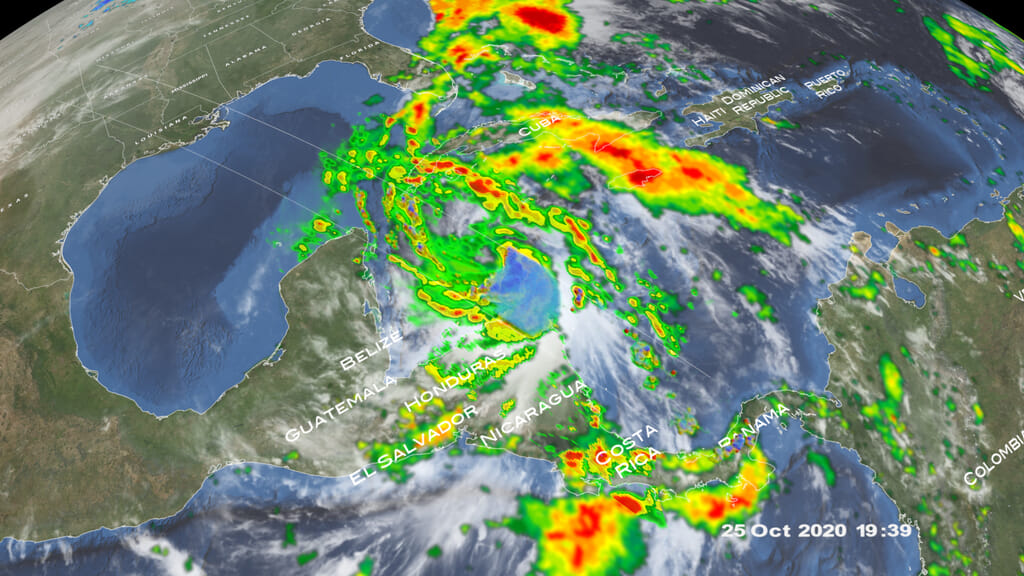
Early in the morning of Oct 28, the GPM satellite flew directly over Hurricane Zeta, which was strengthening in the Gulf of Mexico as it headed for landfall in southeastern Louisiana. The data captured by the Dual-Frequency Precipitation Radar show a symmetric storm, with a clear eye surrounded by tall thunderstorms, an indicator that the storm was strengthening after encountering the Yucatan Peninsula a day earlier.
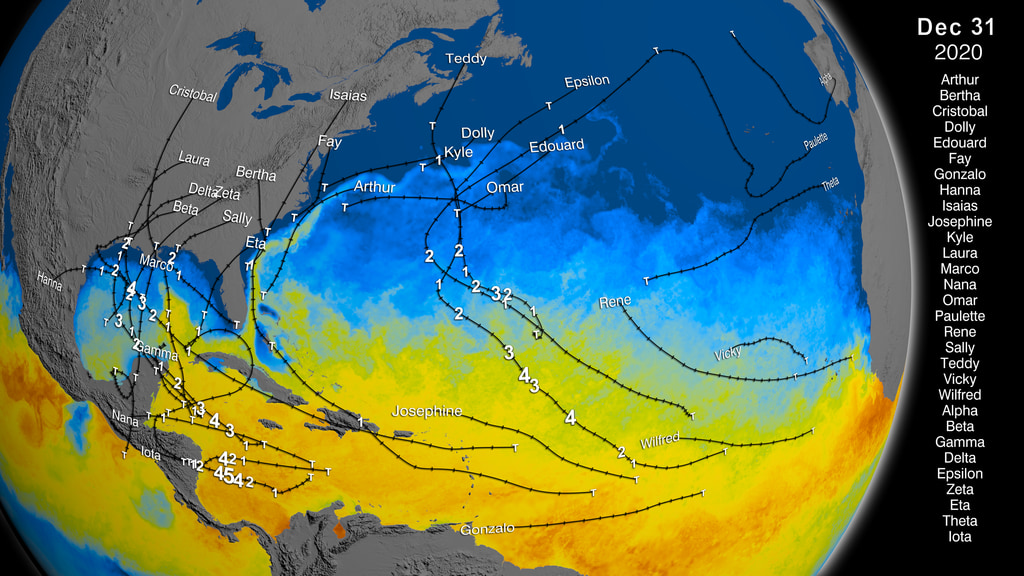
Zeta is the 27th named storm of 2020 which ties the record for the most named storms since 2005. (See 27 Storms: Arlene to Zeta for a summary of the 2005 hurricane season). Hurricane Katrina devastated New Orleans that record-breaking year and now it is poised to take another hit by Hurricane Zeta.
GPM data is archived at https://pps.gsfc.nasa.gov/

Color bar for frozen precipitation rates (ie, snow rates). Shades of cyan represent low amounts of frozen precipitation, whereas shades of purple represent high amounts of precipitation.
Color bar for liquid precipitation rates (ie, rain rates). Shades of green represent low amounts of liquid precipitation, whereas shades of red represent high amounts of precipitation.
Credits
Please give credit for this item to:
NASA's Scientific Visualization Studio
-
Data visualizers
- Alex Kekesi (Global Science and Technology, Inc.)
- Greg Shirah (NASA/GSFC)
-
Scientists
- George Huffman (NASA/GSFC)
- Dalia B Kirschbaum (NASA/GSFC)
-
Producer
- Ryan Fitzgibbons (USRA)
-
Writer
- Stephen J. Munchak (University of Maryland)
Release date
This page was originally published on Wednesday, October 28, 2020.
This page was last updated on Wednesday, November 15, 2023 at 12:16 AM EST.
Missions
This visualization is related to the following missions:Series
This visualization can be found in the following series:Datasets used in this visualization
-
Rain Rates (Surface Precipitation) [GPM: GMI]
ID: 822Credit: Data provided by the joint NASA/JAXA GPM mission.
See all pages that use this dataset -
Volumetric Precipitation data (Ku) [GPM: DPR]
ID: 830Credit: Data provided by the joint NASA/JAXA GPM mission.
See all pages that use this dataset -
IMERG
ID: 863This dataset can be found at: http://pmm.nasa.gov/sites/default/files/document_files/IMERG_ATBD_V4.4.pdf
See all pages that use this dataset
Note: While we identify the data sets used in these visualizations, we do not store any further details, nor the data sets themselves on our site.
Related
- ID: 4884
 Visualization
 - ID: 10829
 Produced Video
Older Versions
- ID: 4869