Barotropic Global Ocean Tides
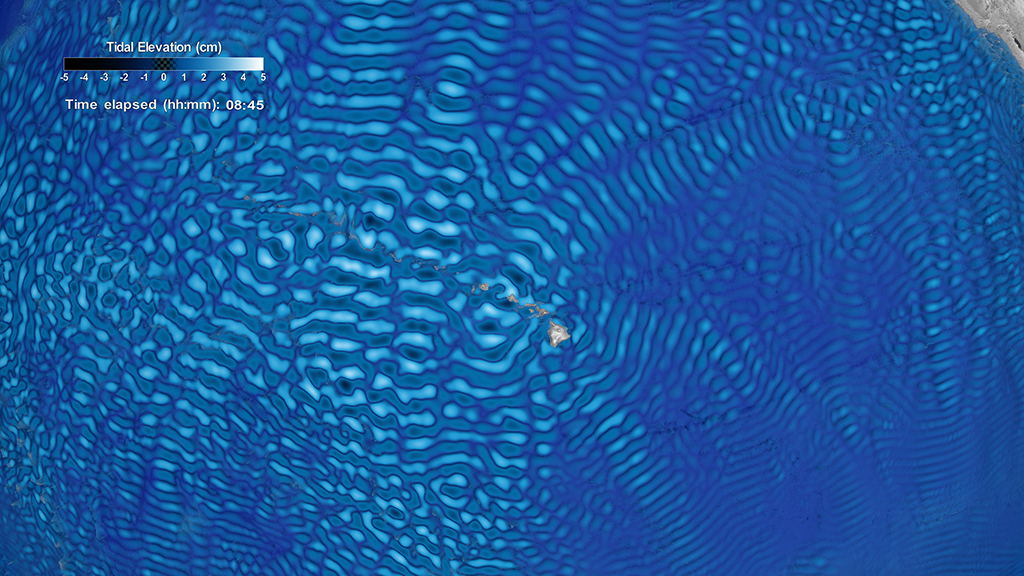
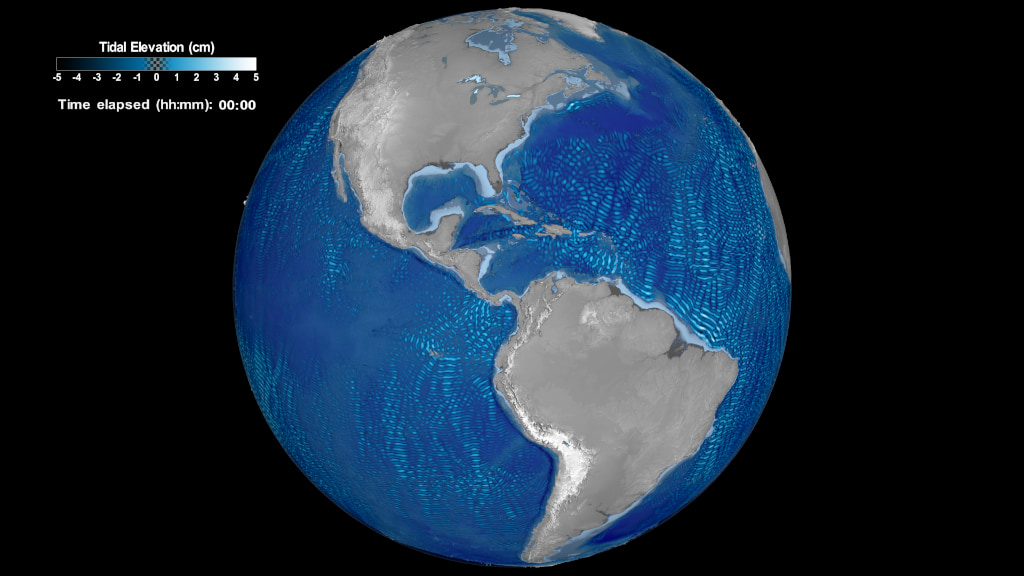
This animation with voiceover narration shows the barotropic global ocean tides as a complex system of rotating and trapped waves with a mixture of frequencies.
Complete transcript available.
This video is also available on our YouTube channel.
Ocean tides are not simple. If our planet had no continents, tides would be hemispheric-sized bulges of water moving westward with the moon and sun. This animation shows the tides as a complex system of rotating and trapped waves with a mixture of frequencies. Waves run relatively unimpeded westward only around Antarctica. Even there, we see a complicated pattern as waves merge from the north and others separate northwards or southwards under Antarctic ice shelves. In the North Atlantic, we see waves mainly rotating anti-clockwise, with small amplitudes in the middle of the ocean and high amplitudes around the boundaries, especially along the coasts of northwest Europe and Britain. Waves are trapped and rotating around New Zealand, causing a high tide on one side of the islands with a simultaneous low tide on the other side.
The Topex/Poseidon and Jason satellite altimeter missions were designed to observe and record this complexity. Altimeters, on these missions, acted as flying tide gauges. After several years collecting data, researchers could analyze the signals at each ocean location to determine the tidal characteristics. With that knowledge, plus near-perfect knowledge of the motion of the sun and moon, the tide can be predicted at any location and at any time in the future.
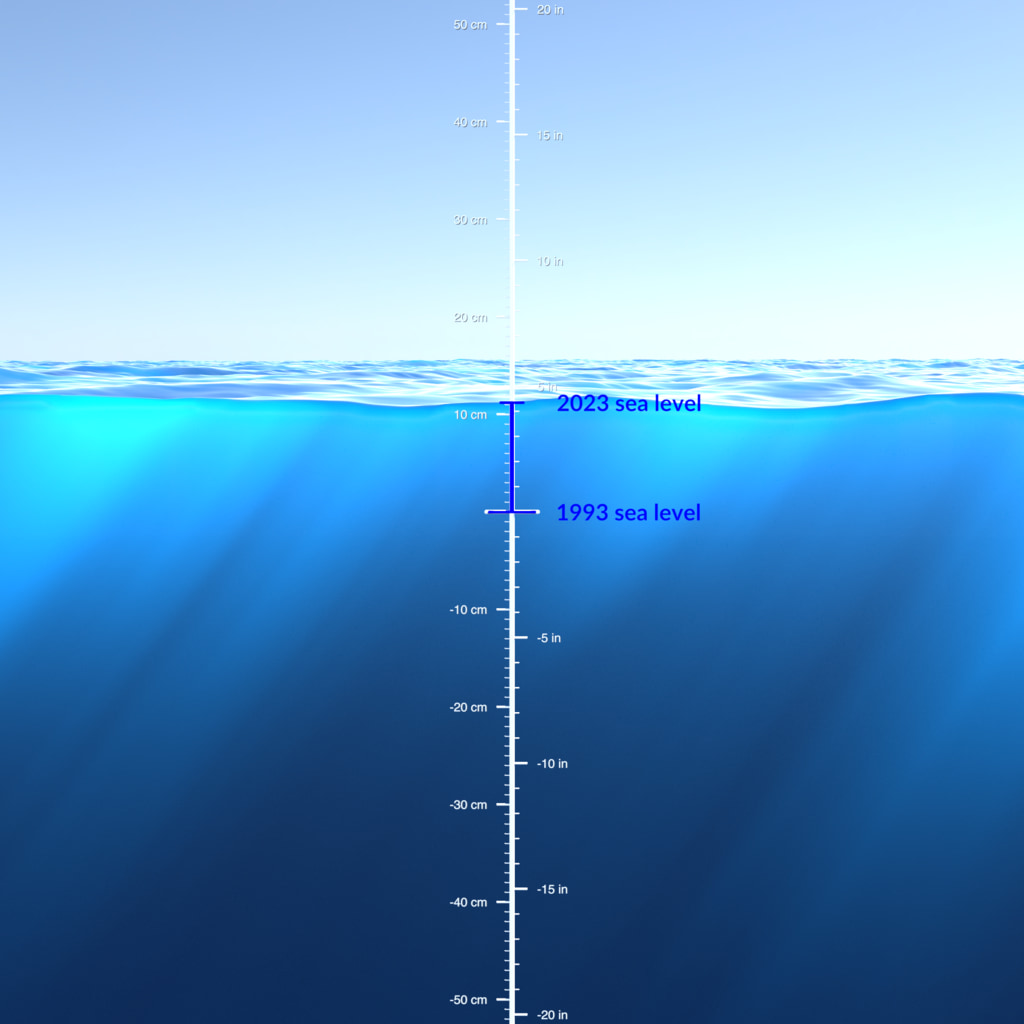
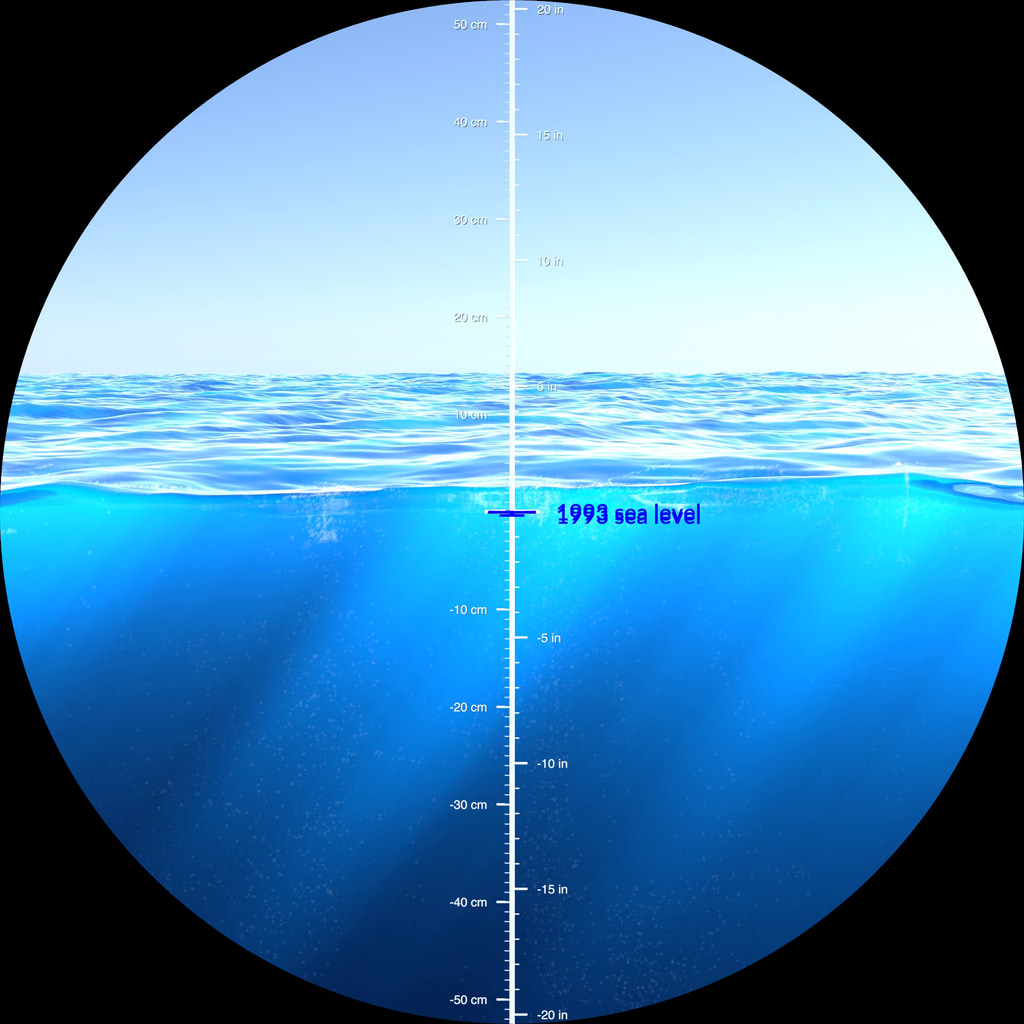
The data used in this visualization is from the Goddard Space Flight Center's barotropic tides simulation and runs for slightly longer than one Earth day. The level of the tides is exaggerated in order to show how the tides vary around the world.
This animation shows the barotropic global ocean tides as a complex system of rotating and trapped waves with a mixture of frequencies.
Credits
Please give credit for this item to:
NASA's Scientific Visualization Studio
-
Visualizer
- Greg Shirah (NASA/GSFC)
-
Scientists
- Richard Ray (NASA/GSFC)
- Nadya Vinogradova-Shiffer (NASA/HQ)
-
Technical support
- Laurence Schuler (ADNET Systems, Inc.)
- Ian Jones (ADNET Systems, Inc.)
-
Narrator
- Lori Perkins (NASA/GSFC)
Release date
This page was originally published on Thursday, November 5, 2020.
This page was last updated on Tuesday, April 30, 2024 at 12:13 AM EDT.
Series
This visualization can be found in the following series:Datasets used in this visualization
-
[Simulated Jupiter Wind Flow Field]
ID: 641 -
Barotropic Tides Simulation
ID: 1101More information about this dataset can be found in the following paper: G. D. Egbert, R. D. Ray, B. G. Bills, Numerical modeling of the global semidiurnal tide in the present day and in the last glacial maximum, 10.1029/2003JC001973, (2004).
This dataset can be found at: https://doi.org/10.1029/2003JC001973
See all pages that use this dataset
Note: While we identify the data sets used in these visualizations, we do not store any further details, nor the data sets themselves on our site.
Related
- ID: 5235
 Visualization
 - ID: 5114
 Visualization
 - ID: 4850
 Visualization
 - ID: 4879
 Visualization
Used as a Source In
- ID: 13814
 Produced Video