Ten Years of Solar Dynamics Observatory
Ten years of SDO AIA 171 angstrom data with day time stamp overlay. Frames are sampled approximately one image every hour.
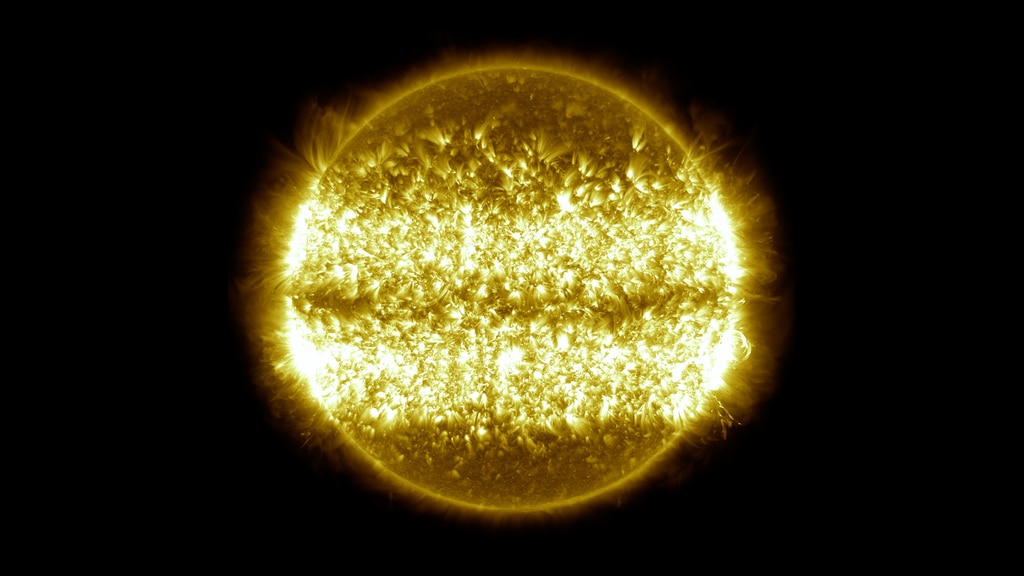
Here we present a continuous run of data from the AIA instrument 171 angstrom filter aboard Solar Dynamics Observatory (SDO). Compiling one photo every hour, the movie condenses a decade of the Sun (June 2, 2010-June 1, 2020) into an almost 49 minute time lapse, where every second corresponds to 30 hours of SDO data.
There's a number of phenomema observed:
- Earth eclipses: usually occur in February-March and August-September each year.
- Lunar transits: We see the lunar disk block out the Sun
- Instrument repointings for calibration purposes
Naturally this movie includes a number of events that have been explored previously:
- October 7, 2010: Lunar Transit
- February 24, 2011: Trebuchet eruption
- June 7, 2011: Massive eruption
- December 15, 2011: Comet Lovejoy
- June 6, 2012: Venus Transit 2012 (raw content)
- July 19, 2012: Raining Loops
- August 31, 2012: Magnificent CME
- September 29, 2013: Canyon of Fire
- October 23-28, 2013: Five days of flares and CMEs
- April 2, 2014: Graceful eruption
- July 8, 2014: Firework flare
- October 2, 2014: Mid-level flare and eruption
- October 8, 2014: Pumpkin Sun
- October 19-27 2014: Giant sunspot flares
- December 19, 2014: Holiday Lights
- April 21, 2015: Phoenix Prominence Eruption
- June 18, 2015: Arching Eruption
- May 9, 2016: Mercury transit 2016 (raw content))
- July 5, 2017: Life of Sunspot
- September 6, 2017: September flares (biggest)
- November 11, 2019: Mercury Transit 2019 (raw content)
Interesting physical features:
- In October and November 2014, a large helmet streamer is visible extremely high above the solar limb. You can still observe it above the solar limb as it moves across the far-side of the Sun.
At various times the AIA instrument failed to collect data resulting in some large data gaps appearing in this visualization as black frames.
- April 1, 2015: about 8 hours
- May 13, 2015: about 6 hours
- December 26, 2015: about 27 hours
- August 2, 2016: about 8 days
- April 30, 2017: about a day
- June 28, 2018: about 18 hours
Ten years of SDO AIA 171 angstrom data, 4Kx4K with color table. Frames are sampled approximately one image every hour.
Credits
Please give credit for this item to:
NASA's Scientific Visualization Studio
-
Visualizer
- Tom Bridgman (Global Science and Technology, Inc.)
-
Scientist
- William D. Pesnell (NASA/GSFC)
-
Producer
- Scott Wiessinger (USRA)
-
Writer
- Mara Johnson-Groh (Wyle Information Systems)
-
Technical support
- Laurence Schuler (ADNET Systems, Inc.)
- Ian Jones (ADNET Systems, Inc.)
Release date
This page was originally published on Wednesday, June 24, 2020.
This page was last updated on Wednesday, November 15, 2023 at 12:14 AM EST.
Missions
This visualization is related to the following missions:Datasets used in this visualization
-
AIA 171 (171 Filter) [SDO: AIA]
ID: 680This dataset can be found at: http://jsoc.stanford.edu/
See all pages that use this dataset -
HEK (Heliophysics Event Knowledgebase)
ID: 1067Heliophysics Event Knowledgebase
See all pages that use this dataset -
Spacecraft Operations (Spacecraft Events) [Solar Dynamics Observatory]
ID: 1068SDO Events Calendar
See all pages that use this dataset
Note: While we identify the data sets used in these visualizations, we do not store any further details, nor the data sets themselves on our site.
Used as a Source In
- ID: 13641
 Produced Video