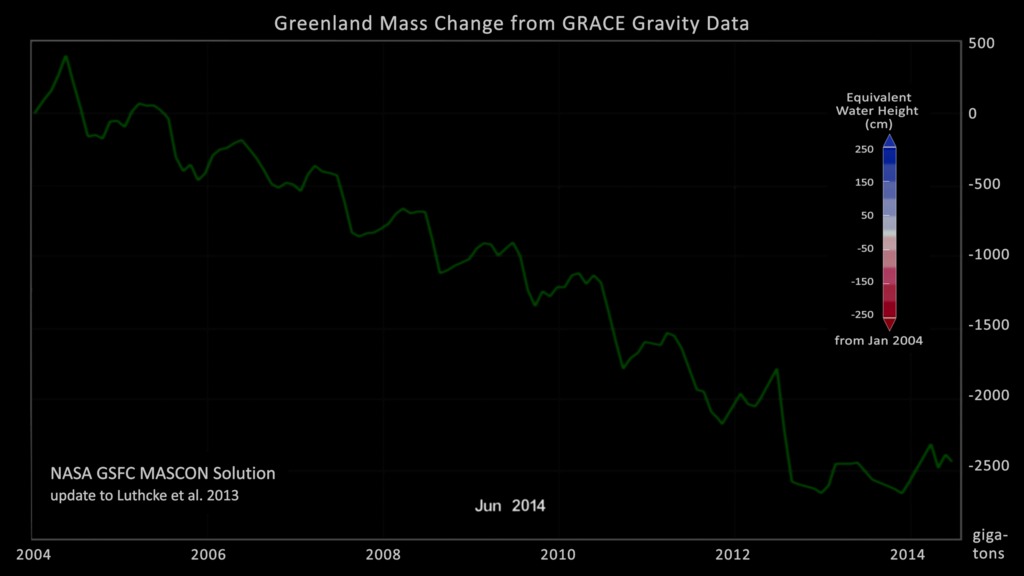
NASA GSFC MASCON Solution over Greenland from Jan 2004 - Jun 2014
Visualization of the mass change over Greenland from January 2004 through June 2014. The surface of Greenland shows the change in equivalent water height while the graph overlay shows the total accumulated change in gigatons.
GRACE, NASA's Gravity Recovery and Climate Experiment, consists of twin co-orbiting satellites that fly in a near polar orbit separated by a distance of 220 km. GRACE precisely measures the distance between the two spacecraft in order to make detailed measurements of the Earth's gravitational field. Since its launch in 2002, GRACE has provided a continuous record of changes in the mass of the Earth's ice sheets.
This animations shows the change in the the Greenland Ice Sheet between January 2004 and June 2014. The 1-arc-deg NASA GSFC mascon solution data was resampled to a 998 x 1800 data array using Kriging interpolation. A color scale was applied in the range of +250 to -250 centimeters of equivalent water height, where blue values indicate an increase in the ice sheet mass while red shades indicate a decrease. In addition, the running sum total of the accumulated mass change over the Greenland Ice Sheet is shown on a graph overlay in gigatons.
Technical Note: The glacial isostatic adjustment signal (Earth mass redistribution in response to historical ice loading) has been removed using the ICE-6G model (Peltier et al. 2015).

A print-resolution image of the accumulated change in equivalent water height over the Greenland Ice Sheet from January 2004 through June 2014. A graph showing the total change in gigatons is overlaid on the image.
The same movie as shown above without the reference to the data source: NASA GSFC NASCON Solution.
The background visualization without the graph overlay or labels.
The graph overlay of the mass change in gigatons with transparency along with all text labels, colorbar and date.
The colorbar alone with transparency

The date overlay alone with transparency.
Credits
Please give credit for this item to:
NASA's Scientific Visualization Studio
-
Visualizer
- Cindy Starr (Global Science and Technology, Inc.)
-
Scientist
- Scott Luthcke (NASA/GSFC)
-
Chief scientist
- Bryant Loomis (SGT)
-
Producer
- Patrick Lynch (Wyle Information Systems)
-
Technical support
- Laurence Schuler (ADNET Systems, Inc.)
- Ian Jones (ADNET Systems, Inc.)
Release date
This page was originally published on Wednesday, August 26, 2015.
This page was last updated on Tuesday, November 14, 2023 at 12:06 AM EST.
Series
This visualization can be found in the following series:Papers used in this visualization
Luthcke, S.B., T.J. Sabaka, B.D. Loomis, A.A. Arendt, J.J. McCarthy, J. Camp (2013), Antarctica, Greenland and Gulf of Alaska land ice evolution from an iterated GRACE global mascon solution, J. Glac., Vol. 59, No. 216, 613-631, doi:10.3189/2013jJoG12j147.
Peltier, W.R., Argus, D.F. and Drummond, R. (2015) Space geodesy constrains ice-age terminal deglaciation: The global ICE-6G_C (VM5a) model. J. Geophys. Res. Solid Earth, 120, 450-487, doi:10.1002/2014JB011176.
Datasets used in this visualization
-
Mascon Solution [Gravity Recovery and Climate Experiment (GRACE): Star Camera]
ID: 666This dataset can be found at: http://www.csr.utexas.edu/grace/spacecraft/
See all pages that use this dataset -
GIMP Greenland DEM (Greenland Mapping Project (GIMP) Digital Elevation Model)
ID: 746
Note: While we identify the data sets used in these visualizations, we do not store any further details, nor the data sets themselves on our site.
Related
- ID: 11988
 Produced Video
 - ID: 11976
 Produced Video