22-year Sea Level Rise - TOPEX/JASON
Spinning globe showing TOPEX/JASON 22-year sea level data. Earth spins once before camera zooms into West Atlantic, East Pacific, and West Pacific regions. With colorbar
This video is also available on our YouTube channel.
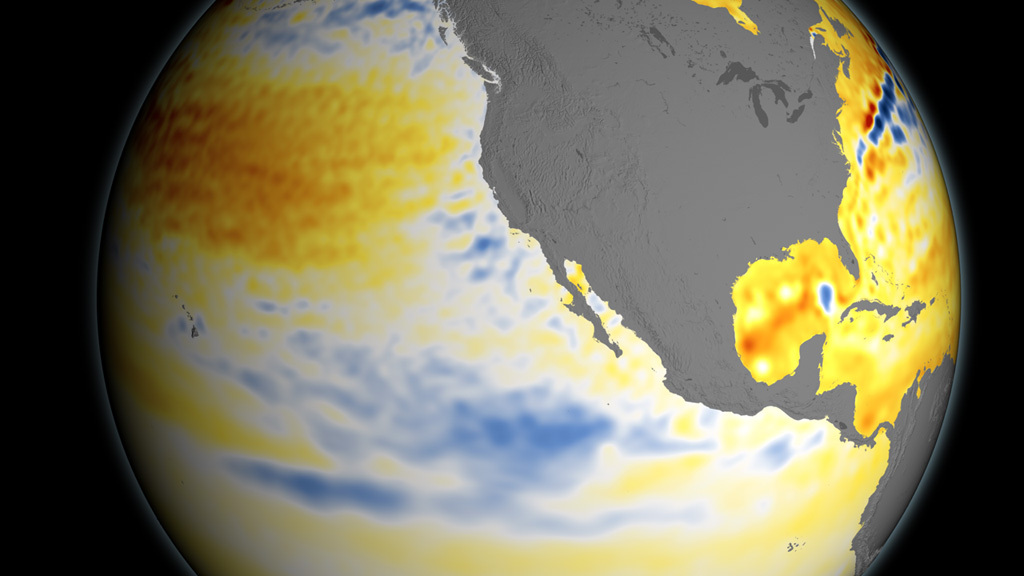
This visualization shows total sea level change between 1992 and 2014, based on data collected from the TOPEX/Poseidon, Jason-1, and Jason-2 satellites. Blue regions are where sea level has gone down, and orange/red regions are where sea level has gone up. Since 1992, seas around the world have risen an average of nearly 3 inches.
The color range for this visualization is -7 cm to +7 cm (-2.76 inches to +2.76 inches), though measured data extends above and below 7cm(2.76 inches). This particular range was chosen to highlight variations in sea level change.
Spinning globe showing TOPEX/JASON 22-year sea level data. Earth spins once before camera zooms into West Atlantic, East Pacific, and West Pacific regions.

TOPEX/JASON 22-year sea level data. Flat map - print still
TOPEX/JASON 22-year sea level data. Flat map - print still. With color bar
TOPEX/JASON 22-year sea level data. 3d globe focused on the Atlantic Ocean - print still
TOPEX/JASON 22-year sea level data. 3d globe focused on the eastern portion of the Pacific Ocean - print still
TOPEX/JASON 22-year sea level data. 3d globe focused on the western portion of the Pacific Ocean - print still
TOPEX/JASON 22-year sea level data. 3d globe focused on the western portion of the Atlantic Ocean - print still
red to white to blue colorbar. -3cm to 3cm
red to white to blue colorbar. -2.76in to 2.76in
Credits
Please give credit for this item to:
NASA's Scientific Visualization Studio
-
Visualizer
- Kel Elkins (USRA)
-
Producer
- Patrick Lynch (Wyle Information Systems)
-
Scientist
- Josh Willis (JPL)
Release date
This page was originally published on Wednesday, August 26, 2015.
This page was last updated on Monday, December 18, 2023 at 12:06 AM EST.
Missions
This visualization is related to the following missions:Datasets used in this visualization
-
[TOPEX: Poseidon]
ID: 105 -
Sea Surface Height [Jason-1: Altimeter]
ID: 332 -
SSH (Sea Surface Height) [Jason-2: CNES Poseidon-3 Altimeter]
ID: 668
Note: While we identify the data sets used in these visualizations, we do not store any further details, nor the data sets themselves on our site.
Related
- ID: 11927
 Produced Video
 - ID: 11988
 Produced Video
 - ID: 11976
 Produced Video
Used as a Source In
- ID: 12849
![Music: Contemporary Art Daily by Laurent Dury [SACEM]Complete transcript available.](/vis/a010000/a012800/a012849/Screen_Shot_2018-02-09_at_2.43.17_PM.png) Produced Video
Produced Video