Deriving the Tamarisk Suitability Map: The Complete Story
The spread of invasive species is one of the most daunting environmental, economic, and human-health problems facing the United States and the World today. It is one of several grand challenge environmental problems being addressed by NASA's Science Mission Directorate through a national application partnership with the US Geological Survey. NASA and USGS are working together to develop a National Invasive Species Forecasting System (ISFS) for the management and control of invasive species on Department of Interior and adjacent lands. The system provides a framework for using USGS's early detection and monitoring protocols and predictive models to process MODIS, ETM+, ASTER and commercial remote sensing data. It can also be used to create on-demand, regional-scale assessments of invasive species patterns and vulnerable habitats. Tamarisk (Salt Ceder) is an invasive plant that typically grows near water and crowds out native species. Tamarisk reflective properties differ from those of its neighboring vegetation throughout the annual life cycle. These different reflective properties can be seen by the naked eye (as in the accompanying seasonal photographs), and can also be seen by satellite sensors. Current Tamarisk infestations and suitable habitats for future growth can be derived from various data sets, including EVI, NDVI, and land cover classifications.
Final animation composite showing both land-based photographs of seasonal vegetation change alongside satellite data of NDVI over the United States. The animation first starts with photographs of Tamarisk at the Grand Staircase Escalante National Monument in Utah. These photos then cycle through time showing the changing seasons. They then pull away to reveal NDVI data over the western U.S. The NDVI data continues to cycle through the seasons in synchronization with the photos. Finally, the cycling NDVI data is combined with land cover classification data to create the Tamarisk suitability map.
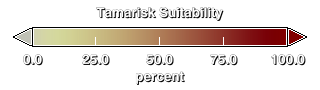
Habitat Suitability legend

The Tamarisk Suitability Map
For More Information
Credits
Please give credit for this item to:
NASA/Goddard Space Flight Center Scientific Visualization Studio
-
Animators
- Alex Kekesi (Global Science and Technology, Inc.)
- Lori Perkins (NASA/GSFC)
- Greg Shirah (NASA/GSFC)
-
Visualizer
- Cindy Starr (Global Science and Technology, Inc.)
-
Video editor
- Rich Melnick (HTSI)
-
Scientists
- Jeffrey Morisette (NASA/GSFC)
- Jeff Pedelty (NASA/GSFC)
-
Writer
- Elizabeth A. Smith (HTSI)
Release date
This page was originally published on Wednesday, February 15, 2006.
This page was last updated on Wednesday, May 3, 2023 at 1:55 PM EDT.
Series
This visualization can be found in the following series:Datasets used in this visualization
-
[Aqua: MODIS]
ID: 5 -
[Landsat-7: ETM+]
ID: 55This dataset can be found at: http://landsat.gsfc.nasa.gov/about/wrs.html
See all pages that use this dataset -
[Terra: MODIS]
ID: 116 -
NDVI [NOAA: AVHRR]
ID: 426 -
Tamarisk Suitability
ID: 555J. Morisette, et al., includes data from NASA's Terra, Aqua, and Earth Observing-1 satellites, and the USGS Landsat satellites.
This dataset can be found at: http://www.nasa.gov/vision/earth/environment/invasive_species.html
See all pages that use this dataset -
Land Cover [Terra and Aqua: MODIS]
ID: 556 -
EVI [NOAA: AVHRR]
ID: 560
Note: While we identify the data sets used in these visualizations, we do not store any further details, nor the data sets themselves on our site.