Creating the Tamarisk Habitat Suitability Map (for Science Presentations)
The spread of invasive species is one of the most daunting environmental, economic, and human-health problems facing the United States and the World today. It is one of several grand challenge environmental problems being addressed by NASA's Science Mission Directorate through a national application partnership with the US Geological Survey. NASA and USGS are working together to develop a National Invasive Species Forecasting System (ISFS) for the management and control of invasive species on Department of Interior and adjacent lands. The system provides a framework for using USGS's early detection and monitoring protocols and predictive models to process MODIS, ETM+, ASTER, and commercial remote sensing data, and create on-demand, regional-scale assessments of invasive species patterns and vulnerable habitats.
The first step in this process is to collect relevant satellite data which can then be used to derive a Tamarisk Habitat Suitability Map. By combining daily Normalized Differential Vegetation Index (NDVI), daily Enhanced Vegetation Index (EVI), and MODIS Land Cover Classification data the likely Tamarisk habitat suitability map can be derived.
This animation depicts NDVI, EVI, and Landcover data combining to derive a Tamarisk Habitat Suitability Map.

NDVI (in shades of green) is the topmost dataset. EVI (in shades of red, orange, and brown) is the middle layer. Landcover (in shades of yellow, orange, and green) is the bottommost layer.
The Tamarisk Habitat Suitability Map
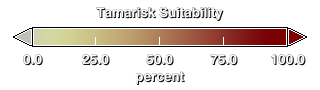
Habitat Suitability legend
Credits
Please give credit for this item to:
NASA/Goddard Space Flight Center Scientific Visualization Studio
-
Animators
- Alex Kekesi (Global Science and Technology, Inc.)
- Lori Perkins (NASA/GSFC)
- Greg Shirah (NASA/GSFC)
-
Visualizer
- Cindy Starr (Global Science and Technology, Inc.)
-
Scientists
- Jeffrey Morisette (NASA/GSFC)
- Jeff Pedelty (NASA/GSFC)
Release date
This page was originally published on Wednesday, February 15, 2006.
This page was last updated on Wednesday, May 3, 2023 at 1:55 PM EDT.
Series
This visualization can be found in the following series:Datasets used in this visualization
-
[Aqua: MODIS]
ID: 5 -
[Landsat-7: ETM+]
ID: 55This dataset can be found at: http://landsat.gsfc.nasa.gov/about/wrs.html
See all pages that use this dataset -
[Terra: MODIS]
ID: 116 -
NDVI [NOAA: AVHRR]
ID: 426 -
Tamarisk Suitability
ID: 555J. Morisette, et al., includes data from NASA's Terra, Aqua, and Earth Observing-1 satellites, and the USGS Landsat satellites.
This dataset can be found at: http://www.nasa.gov/vision/earth/environment/invasive_species.html
See all pages that use this dataset -
Land Cover [Terra and Aqua: MODIS]
ID: 556 -
EVI [NOAA: AVHRR]
ID: 560
Note: While we identify the data sets used in these visualizations, we do not store any further details, nor the data sets themselves on our site.