NASA Has Eyes On The Atlantic Hurricane Season
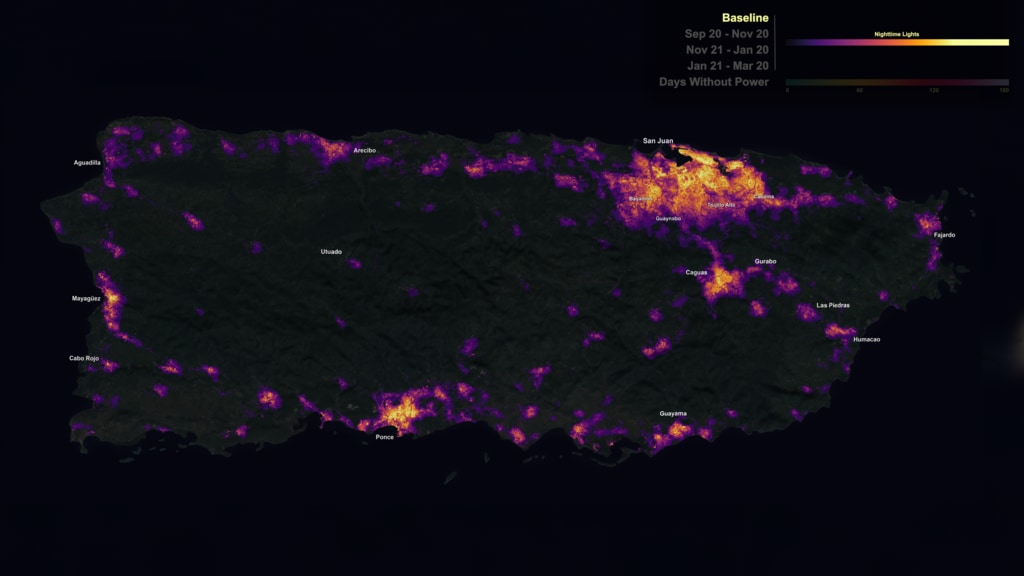
NASA has a unique and important view of hurricanes around the planet. Satellites and aircraft watch as storms form, travel across the ocean and sometimes, make landfall. After the hurricanes have passed, the satellites and aircraft see the aftermath of hurricanes, from downed forests to mass power loss.
Complete transcript available.
Music credits: “Northern Breeze” by Denis Levaillant [SACEM], “Stunning Horizon” by Maxime Lebidois [SACEM], Ronan Maillard [SACEM], “Magnetic Force” by JC Lemay [SACEM] from Killer Tracks
Watch this video on the NASA Goddard YouTube channel.
This video can be freely shared and downloaded. While the video in its entirety can be shared without permission, some individual imagery provided by pond5.com is obtained through permission and may not be excised or remixed in other products. Specific details on stock footage may be found here. For more information on NASA’s media guidelines, visit https://www.nasa.gov/multimedia/guidelines/index.html.
Notes on footage:
• 0:03 - 0:17 provided by Pond5
• 1:38 - 1.43 provided by Pond5
• 1:49 - 1:52 provided by Pond5
• 2:21 - 1:27 provided by Pond5

GIF
The Global Modeling and Assimilation Office (GMAO) at NASA’s Goddard Space Flight Center created this visualization using the Goddard Earth Observing System (GEOS) computer model. When combined with data from NASA’s satellites, the model becomes a tool for scientists to fully understand aerosols’ impact and how they fit into the global Earth system.
GIF
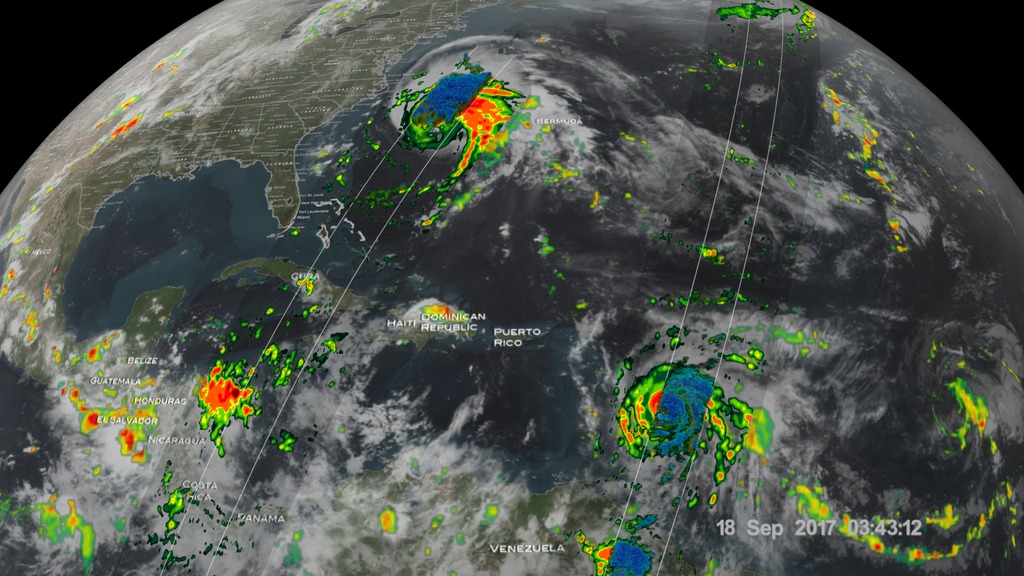
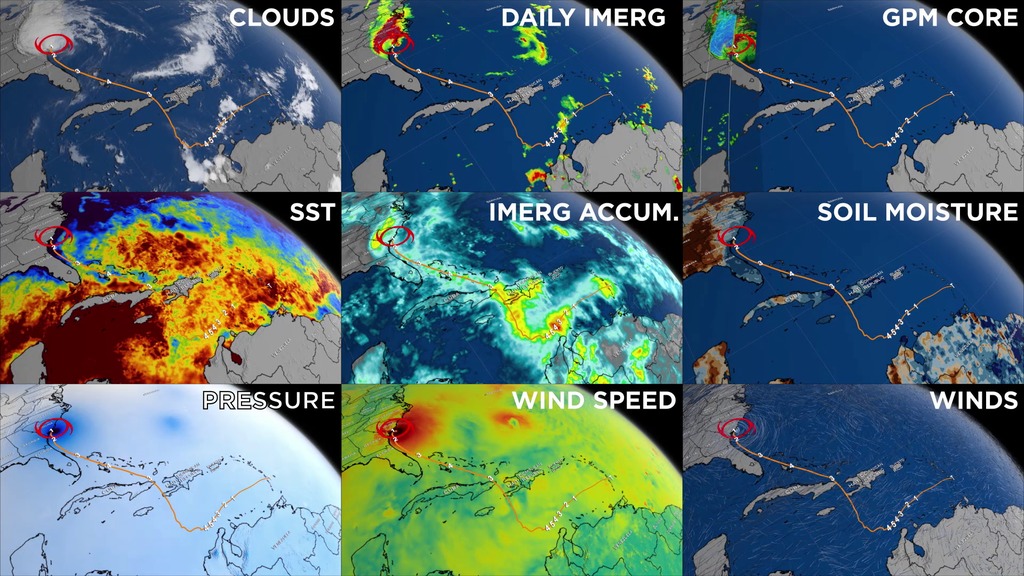
From space, NASA satellites can monitor hurricanes as they form, develop and dissapate.
GIF
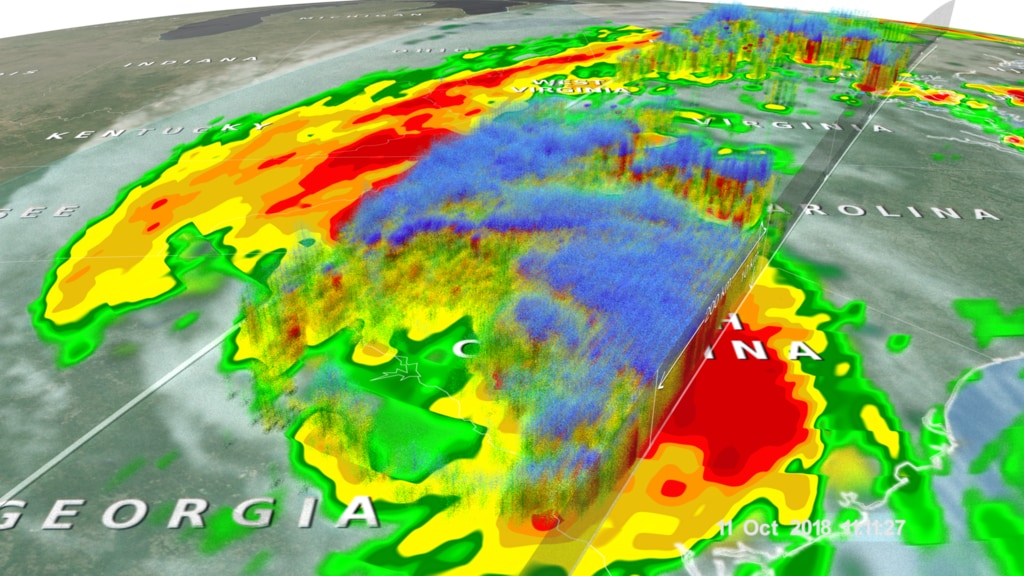
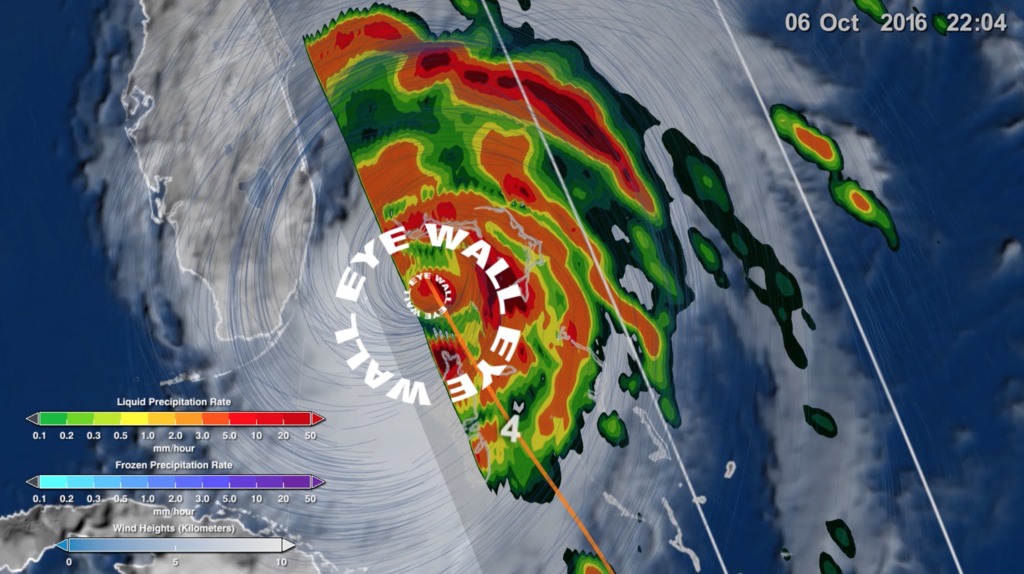
NASA's Global Precipitation Measurement Mission tracks rainfall in near-real time and can create detailed, 3D images of storms as they form.
GIF
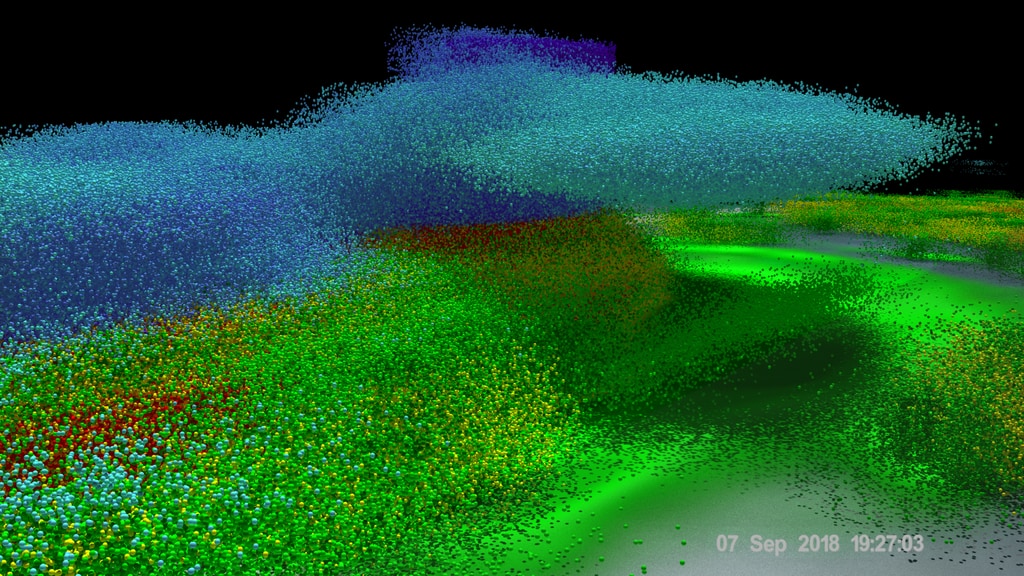
Research scientist Doug Morton of Goddard was part of the team of NASA researchers who had surveyed Puerto Rico's forests six months before the storm with Goddard’s Lidar, Hyperspectral, and Thermal (G-LiHT) Airborne Imager, a system designed to study the structure and species composition of Puerto Rican forests. Shooting 600,000 laser pulses per second, G-LiHT produces a 3D view of the forest structure in high resolution. In April 2018, post-Maria, they went back and surveyed the same tracks as in 2017.
- AIIRS
- Aqua
- Atmosphere
- Atmospheric Phenomena
- Atmospheric science
- Atmospheric/ocean Indicators
- Climate Indicators
- Coastal Processes
- CYGNSS
- Earth Science
- Extreme Weather
- floods
- GPM
- HDTV
- Hurricane Florence
- Hurricane Jose
- Hurricane Maria
- Hurricane Matthew
- Hurricane Sandy
- Hurricanes
- Hydrology
- Hydrosphere
- MODIS
- Natural hazards
- NOAA
- Oceans
- Storm Surge
- surface water
Credits
Please give credit for this item to:
NASA's Goddard Space Flight Center
-
Producers
- Joy Ng (USRA)
- Ryan Fitzgibbons (USRA)
-
Scientists
- Scott Braun (NASA/GSFC)
- George Huffman (NASA/GSFC)
- Dalia B Kirschbaum (NASA/GSFC)
-
Narrator
- LK Ward (USRA)
-
Support
- Kathryn Mersmann (USRA)
Release date
This page was originally published on Monday, June 3, 2019.
This page was last updated on Wednesday, May 3, 2023 at 1:45 PM EDT.
Series
This visualization can be found in the following series:Related
- ID: 12195
![Music credit: 'Cellular Signals' by Laurent Levesque [SACEM] from Killer TracksComplete transcript available.Watch this video on the NASA Goddard YouTube channel.](/vis/a010000/a012100/a012195/LARGE_MP4-12195_EPOCH_Hurricanes2_large.00151_print.jpg) Produced Video
Produced Video - ID: 12251
 Produced Video
Alternate Versions
- ID: 12738
![Watch this video on the NASA Goddard YouTube channel.Complete transcript available.Music credits: 'Micro Currents' by Jean-Patrick Voindrot [SACEM], 'Sink Deep' by Andrew Michael Britton [PRS], David Stephen Goldsmith [PRS], Mikey Rowe [PRS] from Killer Tracks.](/vis/a010000/a012700/a012738/LARGE_MP4-12738_RapidIntensification_large.00084_print.jpg) Produced Video
Produced Video
Sources
- ID: 12772
![Tracking aerosols over land and water from August 1 to November 1, 2017. Hurricanes and tropical storms are obvious from the large amounts of sea salt particles caught up in their swirling winds. The dust blowing off the Sahara, however, gets caught by water droplets and is rained out of the storm system. Smoke from the massive fires in the Pacific Northwest region of North America are blown across the Atlantic to the UK and Europe. This visualization is a result of combining NASA satellite data with sophisticated mathematical models that describe the underlying physical processes.Music: Elapsing Time by Christian Telford [ASCAP], Robert Anthony Navarro [ASCAP]Complete transcript available.Watch this video on the NASA Goddard YouTube channel.](/vis/a010000/a012700/a012772/12772_hurricanes_and_aerosols_1080p_youtube_1080.00001_print.jpg) Produced Video
Produced Video - ID: 4735

- ID: 12590
![To get a detailed look at vegetation and land cover, NASA uses an airborne instrument called Goddard’s Lidar, Hyperspectral and Thermal Airborne Imager, or G-LiHT. From the belly of a small aircraft flying one thousand feet above the trees, G-LiHT collects multiple measurements of forests, including high-resolution photographs, surface temperatures and the heights and structure of the vegetation. Watch this video on the NASA Goddard YouTube channel.Complete transcript available.Music: Letting the Past Go, by Ben Hales [PRS], Matt Hales [PRS]](/vis/a010000/a012500/a012590/12590_Puerto_Rico_lidar_youtube_1080.00248_print.jpg) Produced Video
Produced Video - ID: 4658
- ID: 4692
 Visualization
 - ID: 4681
- ID: 12821
![NASA's Global Hawk in 2014 traveled to the middle of the Atlantic and flew over Hurricane Edouard. Remote sensing nstruments on the plane measured temperature, relative humidity, wind speed, wind direction as well as other data. Along with measurements from the aircraft, NASA scientists also collected data from dropsondes that parachuted down through the hurricane.Complete transcript available.Music: Who Done It? by Robert Leslie Bennett [ASCAP]Watch this video on the NASA Goddard YouTube channel.](/vis/a010000/a012800/a012821/12821_HS3_dropsondes_youtube_1080.00555_print.jpg) Produced Video
Produced Video - ID: 4585
- ID: 12635
 Produced Video
 - ID: 4543
 Visualization
 - ID: 11392
 Produced Video