Landsat's Global View of Ice Velocity
Ice from glaciers constantly flows into the ocean, but the speed the ice moves at changes. Landsat 8 provides near-real-time mapping of ice speed in nearly all the world’s frozen regions. Information like ice speed helps scientists study our home planet and its vulnerability to rising seas.
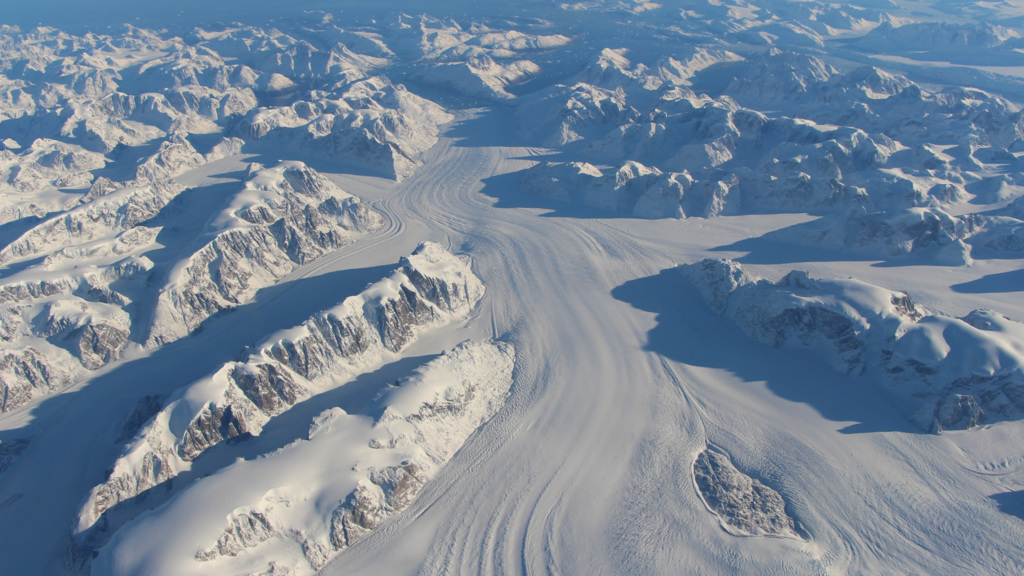
Heimdal Glacier in southeastern Greenland shows a regular speed up and slow down with the seasons. Peak speeds are around May/June, and low speeds occur in September/October.
This velocity data is a result of new analysis of imagery from the Operational Land Imager on the NASA/USGS Landsat 8 satellite, part of the Global Landsat Ice Velocity Extraction (GoLIVE) project.
Music credit: Tiny Worlds by Christian Telford [ASCAP], David Travis Edwards [ASCAP], Matthew St Laurent [ASCAP], Robert Anthony Navarro [ASCAP]
Complete transcript available.
Watch this video on the NASA Goddard YouTube channel.

The flow of ice is moving fast at Greenland’s Heimdal Glacier in June 2016 and starts slowing down before the end of summer, with the slowest point coming in early October.
The flow of ice at Greenland’s Heimdal Glacier moves at its slowest speed in October 2016.
For More Information
Credits
Please give credit for this item to:
NASA's Goddard Space Flight Center
-
Writer
- Kate Ramsayer (Telophase)
-
Producers
- Matthew R. Radcliff (USRA)
- Kathryn Mersmann (USRA)
-
Animator
- Cindy Starr (Global Science and Technology, Inc.)
-
Scientists
- Twila Moon (University of Bristol)
- Mark Fahnestock (University of Alaska)
- Ted Scambos (NSIDC)
- Alex S. Gardner (NASA/JPL CalTech)
Release date
This page was originally published on Monday, December 12, 2016.
This page was last updated on Wednesday, May 3, 2023 at 1:48 PM EDT.
Missions
This visualization is related to the following missions:Series
This visualization can be found in the following series:Related
- ID: 12476
 Produced Video
Sources
- ID: 4528
 Visualization