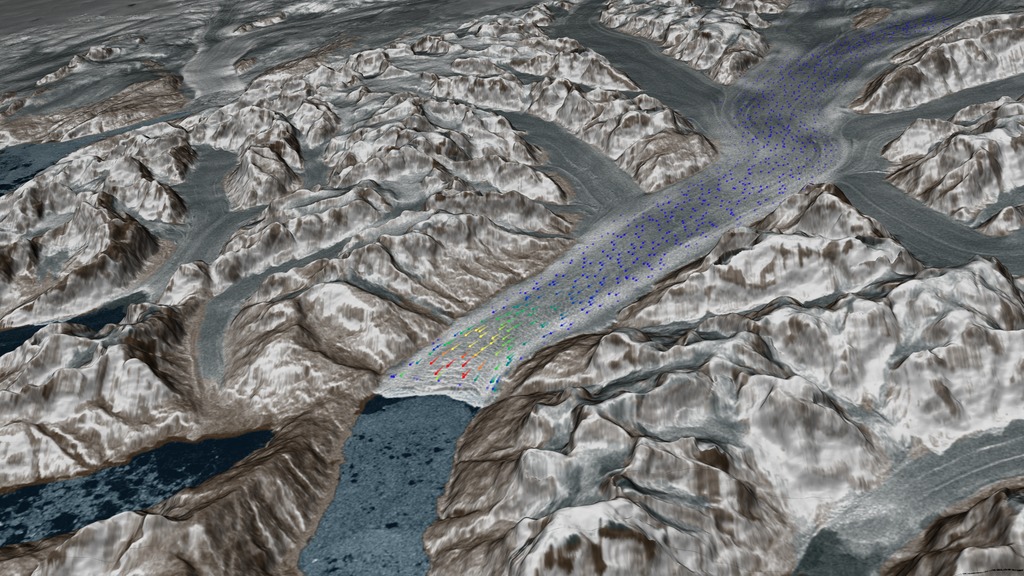
Seasonal Speed Variation on Heimdal Glacier
The NASA/USGS Landsat 8 mission has allowed new views of the Earth’s glaciers. By tracking displacement of local surface features through the seasons on outlet glaciers from the large ice sheets, researchers from the University of Alaska, the University of Bristol, and the University of Colorado have been able to show that each glacier around Greenland has a unique pattern of flow variation through the seasons.
Seasonal variations, seen in this animation on the lower 25 kilometers of Heimdal Glacier in southeast Greenland, are caused by a combination of processes. For Heimdal, the largest forcing for flow variation is likely the input of increasing amounts of surface melt water through the Spring and Summer, but there is also an interplay between calving of ice from the end of the glacier, flow acceleration as shown in the animation, and thinning of the ice due to the extra stretching from the faster flow.
By measuring these changes in flow on seasonal timescales, scientists can develop a better understanding of what controls the flow of these glaciers where they meet the ocean. This understanding will improve our ability to anticipate flow responses of these systems in a warming climate.
This visualization shows the seasonal ice velocity on the Heimdal Glacier in Greenland between October 2013 and October 2016. The color of the flow vectors represent the speed of the flow, with purple representing the slow moving ice and red showing the fast ice. The color scale is displayed in the lower left corner.
This video is also available on our YouTube channel.
The above visualization without the date or color bar.

The date and colorbar with transparency.
Credits
Please give credit for this item to:
NASA's Scientific Visualization Studio
-
Visualizers
- Cindy Starr (Global Science and Technology, Inc.)
- Horace Mitchell (NASA/GSFC)
- Greg Shirah (NASA/GSFC)
-
Scientists
- Twila Moon (University of Bristol)
- Mark Fahnestock (University of Alaska)
-
Producer
- Matthew R. Radcliff (USRA)
-
Technical support
- Laurence Schuler (ADNET Systems, Inc.)
- Ian Jones (ADNET Systems, Inc.)
-
Project support
- Joycelyn Thomson Jones (NASA/GSFC)
- Leann Johnson (Global Science and Technology, Inc.)
- Eric Sokolowsky (Global Science and Technology, Inc.)
Release date
This page was originally published on Monday, December 12, 2016.
This page was last updated on Tuesday, November 14, 2023 at 12:08 AM EST.
Missions
This visualization is related to the following missions:Datasets used in this visualization
-
[RADARSAT-1: SAR]
ID: 87Credit: Additional credit goes to Canadian Space Agency, RADARSAT International Inc.
See all pages that use this dataset -
GIMP Greenland DEM (Greenland Mapping Project (GIMP) Digital Elevation Model)
ID: 746 -
GoLIVE (Global Land Ice Velocity) [Landsat-8]
ID: 964Credit: Mark Fahnstock (Univ. of Alaska), Twila Moon (Univ. of Bristol), Ted Scambos (Univ. of Colorado/NSIDC), Marin Klinger (Univ. of Colorado/NSIDC), Alex Gardner (JPL), Terry Haran (Univ. of Colorado/NSIDC)
See all pages that use this dataset
Note: While we identify the data sets used in these visualizations, we do not store any further details, nor the data sets themselves on our site.
Used as a Source In
- ID: 13889
![Landsat 9, launching September 2021, will collect the highest quality data ever recorded by a Landsat satellite, while still ensuring that these new measurements can be compared to those taken by previous generations of the Earth-observing satellite. Landsat 9 will enable or improve measurements of water quality, glacial ice velocity, crop water usage, and much more.Music: The Waiting Room by Sam Dodson [PRS], Afterglow by Christopher Timothy White [PRS], both published by Atmosphere Music Ltd [PRS]; and Inner Strength by Brava/Dsilence/Input/Output [SGAE], published by El Murmullo Sarao [SGAE] and Universal Sarao [SGAE]. Available from Universal Production Music. Complete transcript available.Watch this video on the NASA Goddard YouTube channel.](/vis/a010000/a013800/a013889/13889_Landsat9_at_Work_print.png) Produced Video
Produced Video - ID: 12476
 Produced Video
 - ID: 12444
![Heimdal Glacier in southeastern Greenland shows a regular speed up and slow down with the seasons. Peak speeds are around May/June, and low speeds occur in September/October. This velocity data is a result of new analysis of imagery from the Operational Land Imager on the NASA/USGS Landsat 8 satellite, part of the Global Landsat Ice Velocity Extraction (GoLIVE) project.Music credit: Tiny Worlds by Christian Telford [ASCAP], David Travis Edwards [ASCAP], Matthew St Laurent [ASCAP], Robert Anthony Navarro [ASCAP]Complete transcript available.Watch this video on the NASA Goddard YouTube channel.](/vis/a010000/a012400/a012444/LARGE_MP4-12444_icevelocity_fix_large.00155_print.jpg) Produced Video
Produced Video