Antarctic Sea Ice Update

This year’s Antarctic sea ice maximum extent is the lowest since 2008.
The sea ice cover of the Southern Ocean reached its yearly maximum extent on October 6, 2015. After three years of consecutive record high peak extents, this year’s extent of 7.27 million square miles falls roughly in the middle of the record of Antarctic maximum extents compiled during the 37 years of satellite measurements. This year’s maximum extent occurred fairly late: the mean date of the Antarctic maximum is September 23 for 1981-2010. The growth of Antarctic sea ice was erratic this year and scientists believe that the strong El Niño event forming over the eastern equatorial Pacific Ocean had a role in the behavior of the sea ice cover. El Niño causes higher sea level pressure, warmer air temperature and warmer sea surface temperature in areas of Antarctica, affecting the sea ice distribution. Watch the video to see the evolution of this year's Antarctic sea ice cover, from its austral summertime minimum to its wintertime maximum.
This visualization created from satellite observations shows Antarctic sea ice change from Feb. 20 to Oct. 6, 2015.
This image shows Antarctica’s sea ice on Feb. 20, the date of the summertime minimum.
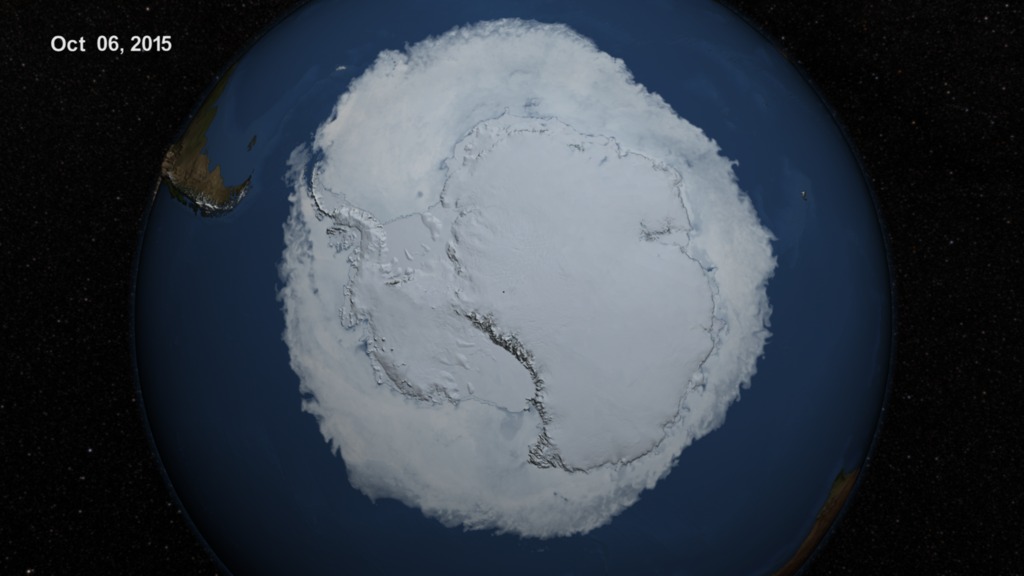
This year's Antarctic sea ice maximum extent (shown above) was reached on Oct. 6, and covered 7.27 million square miles.
The current Antarctic sea ice maximum extent is shown in comparison to the historical average from 1981-2010 (red line).
For More Information
See NASA.gov
Credits
Please give credit for this item to:
NASA's Scientific Visualization Studio
-
Animators
- Cindy Starr (Global Science and Technology, Inc.)
- Lori Perkins (NASA/GSFC)
-
Scientists
- Walt Meier (NASA/GSFC)
- Josefino Comiso (NASA/GSFC)
- Robert Gersten (Wyle Information Systems)
-
Writer
- Maria-Jose Vinas Garcia (Telophase)
-
Project support
- Laurence Schuler (ADNET Systems, Inc.)
- Ian Jones (ADNET Systems, Inc.)
- Leann Johnson (Global Science and Technology, Inc.)
- Joycelyn Thomson Jones (NASA/GSFC)
- Eric Sokolowsky (Global Science and Technology, Inc.)
Release date
This page was originally published on Tuesday, October 27, 2015.
This page was last updated on Wednesday, May 3, 2023 at 1:49 PM EDT.
Related
- ID: 4368
 Visualization