A newer version of this visualization is available.
Soil Moisture and Rainfall
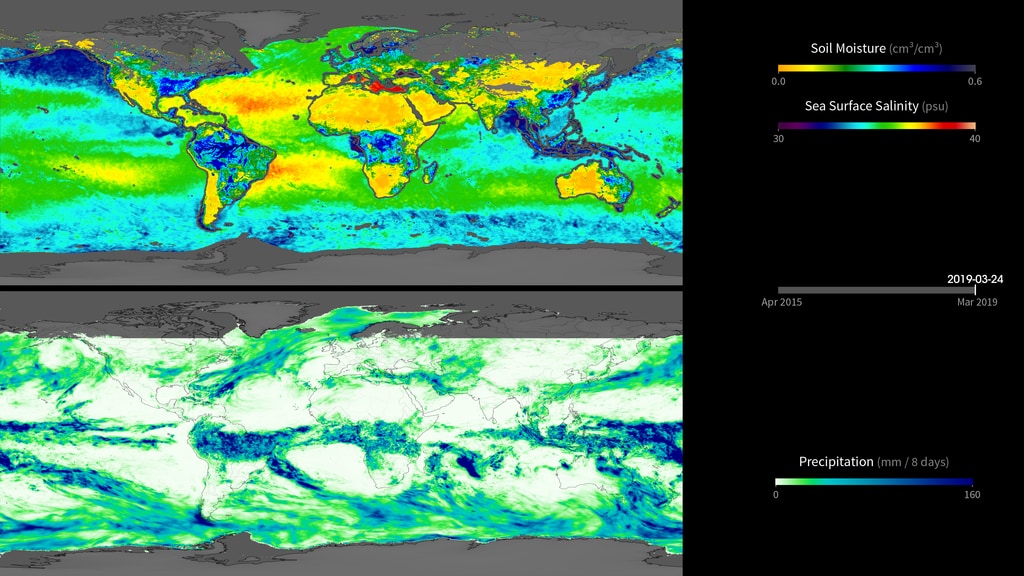
Soil Moisture and Ocean Salinity are compared to Rainfall
This visualization compares weekly soil moisture and sea surface salinity data (over land and water, respectively) from NASA’s Soil Moisture Active Passive Satellite (SMAP) mission [top map] with a precipitation product called Integrated Multi-satellite Retrievals for GPM, or IMERG [bottom map], from April 17 to August 2, 2015. IMERG is derived using data from the Global Precipitation Measurement (GPM) international constellation of satellites.
These maps reveal how precipitation amounts influence soil moisture conditions and sea surface salinity. For example, high amounts of precipitation along the equator coincide with relatively moist soil conditions on land (blue shades) and low salinity values in the ocean (green and blue shades). Conversely, areas that receive little or no precipitation, such as the Sahara Desert in northern Africa, coincide with dry soils (dark yellow shades). Scientists can use data from SMAP and IMERG to develop improved flood prediction and drought monitoring capabilities. Societal benefits include improved water-resource management, agricultural productivity, and wildfire and landslide predictions. Data from SMAP also allow us to extend the data record of the highly successful 3-year Aquarius sea surface salinity mission into the future.
Credits
Please give credit for this item to:
NASA's Goddard Space Flight Center
-
Visualizer
Release date
This page was originally published on Tuesday, October 27, 2015.
This page was last updated on Tuesday, November 14, 2023 at 12:29 AM EST.
Missions
This visualization is related to the following missions:Newer Versions
- ID: 31046
 Hyperwall Visual
Sources
- ID: 30701
 Hyperwall Visual