Instagram: NASA's First Global Rainfall And Snowfall Map
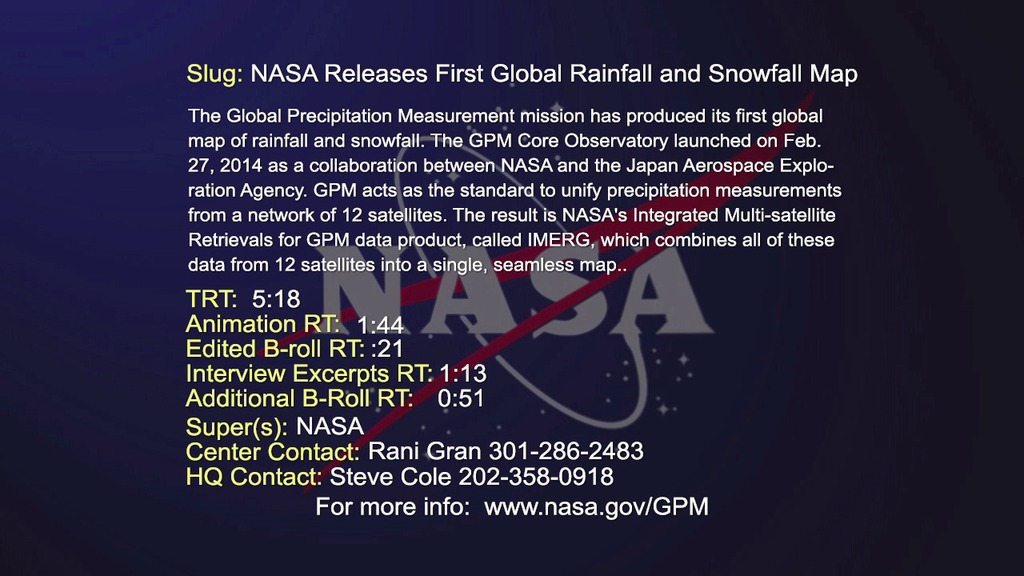
Global Precipitation Measurement mission has produced its first global map of rainfall and snowfall.
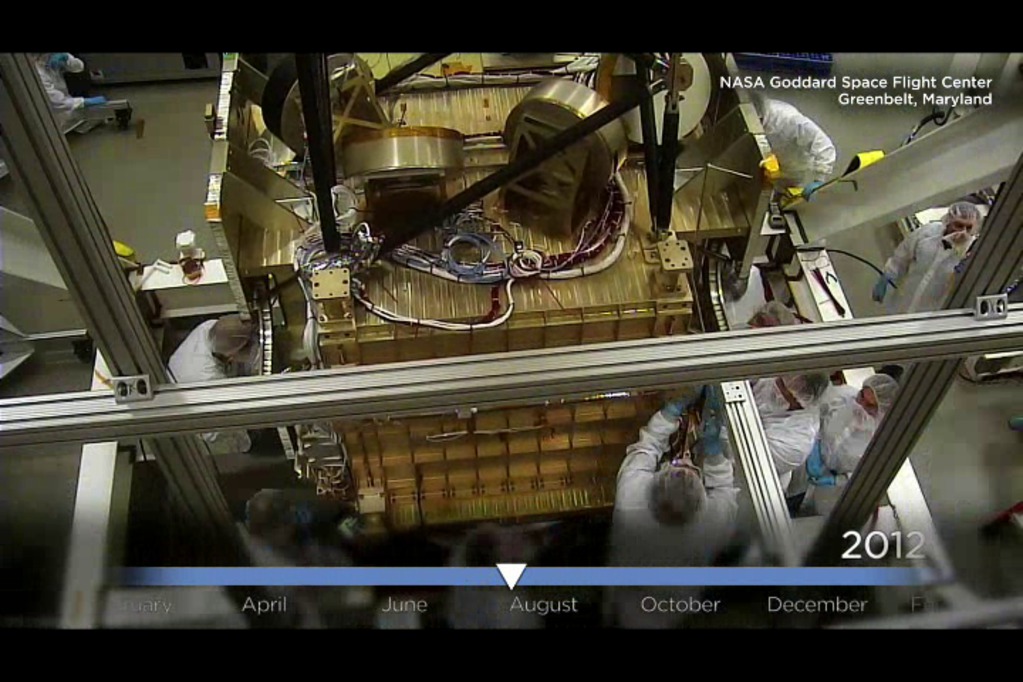
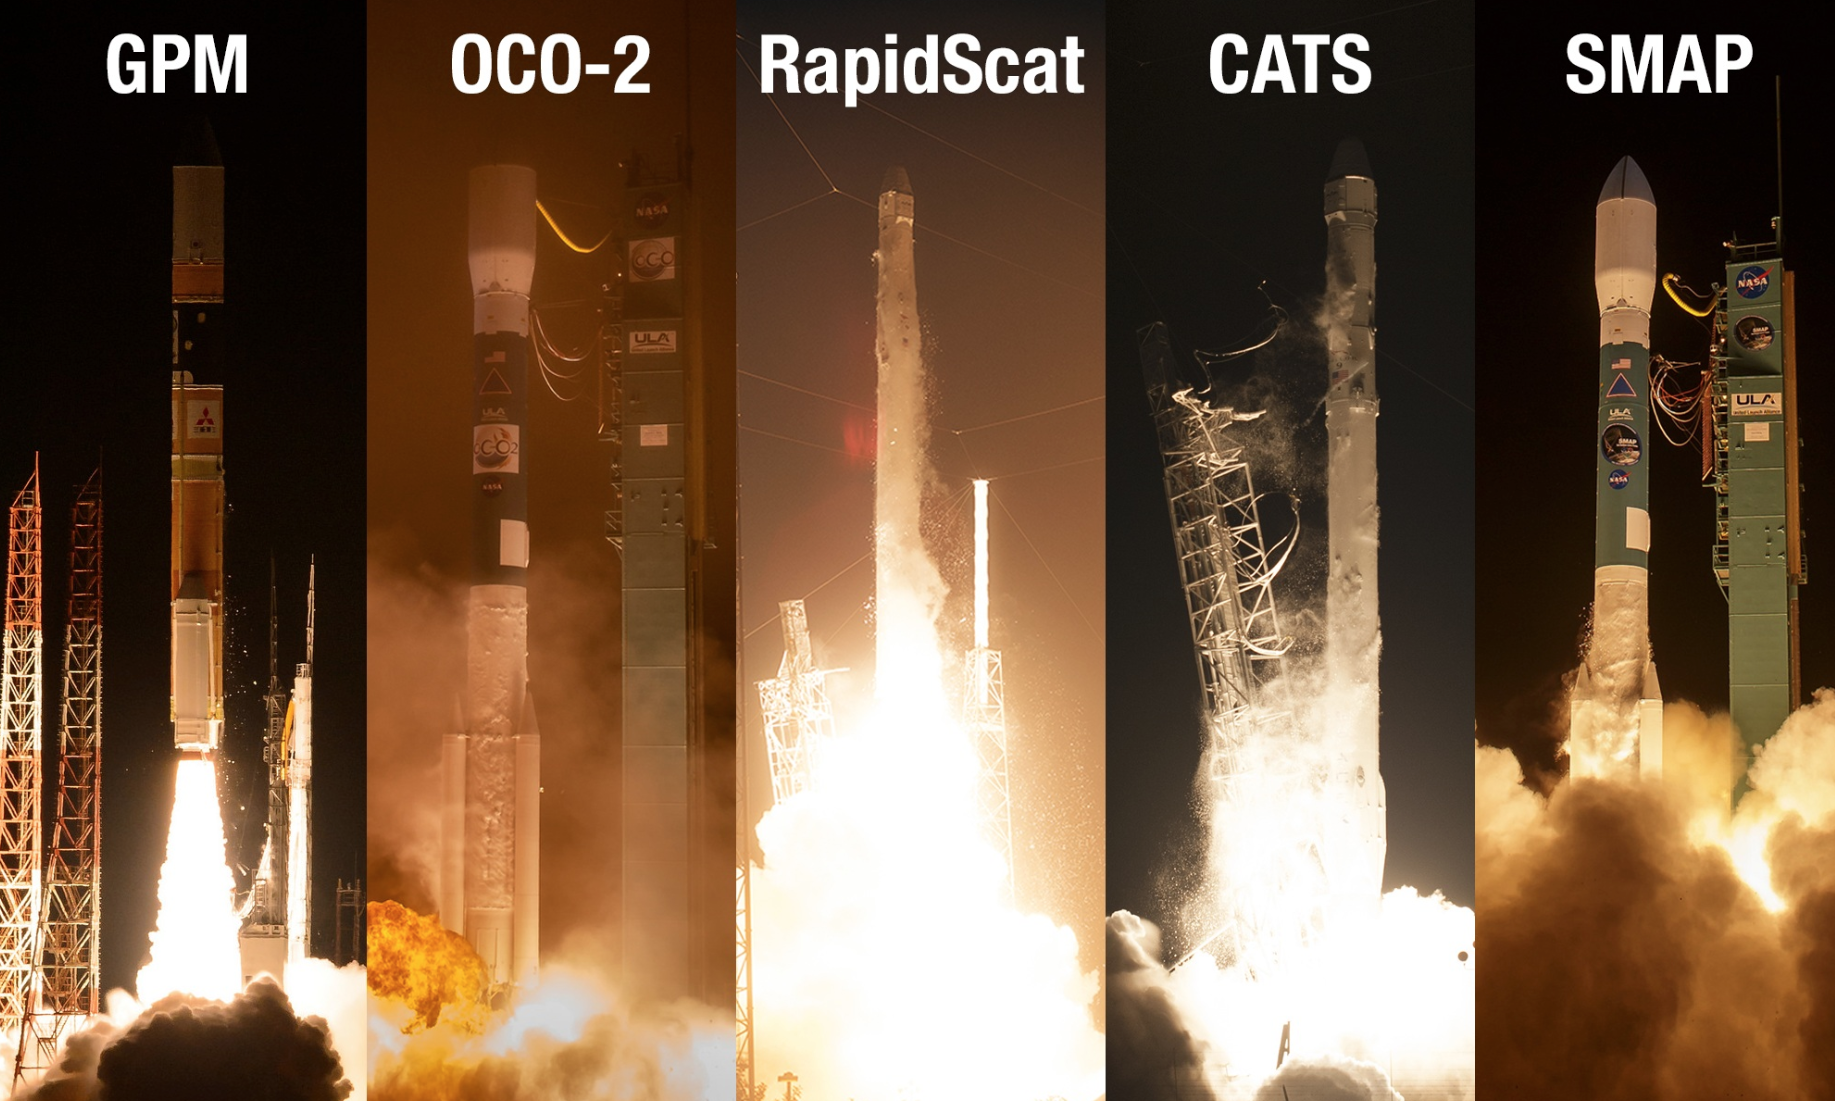
Like a lead violin tuning an orchestra, the GPM Core Observatory – launched one year ago on Feb. 27, 2014 as a collaboration between NASA and the Japan Aerospace Exploration Agency – acts as the standard to unify precipitation measurements from a network of 12 satellites. The result is NASA's Integrated Multi-satellite Retrievals for GPM data product, called IMERG, which combines all of these data from 12 satellites into a single, seamless map.
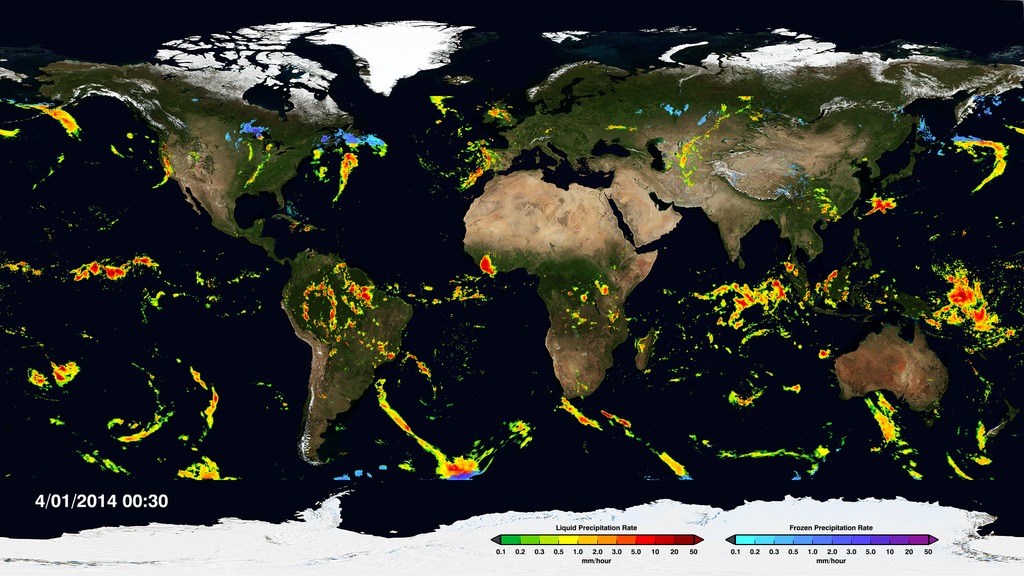
This first IMERG data set spans the initial months of GPM data collection from April to September, 2014. The precipitation data collected covers the 87 percent of the globe that falls between 60 degrees north and 60 degrees south latitude, updated every half hour.
The map covers more of the globe than any previous NASA precipitation data set, allowing scientists to see how rain and snowstorms move around nearly the entire planet. As scientists work to understand all the elements of Earth’s climate and weather systems, and how they could change in the future, GPM provides a major step forward in providing the scientific community comprehensive and consistent measurements of precipitation.
For complete transcript, click here.
For More Information
Credits
Please give credit for this item to:
NASA's Goddard Space Flight Center
-
Producer
- Joy Ng (USRA)
-
Data visualizers
- Horace Mitchell (NASA/GSFC)
- Alex Kekesi (Global Science and Technology, Inc.)
-
Writer
- Ellen T. Gray (ADNET Systems, Inc.)
Release date
This page was originally published on Thursday, February 26, 2015.
This page was last updated on Wednesday, May 3, 2023 at 1:49 PM EDT.
Missions
This visualization is related to the following missions:Series
This visualization can be found in the following series:Related
- ID: 11764
 Produced Video
 - ID: 11784
 Produced Video
 - ID: 11788
 Produced Video
 - ID: 4257
 Visualization