Earth Right Now Briefing - February 26, 2015
Over the past 12 months NASA has added five missions to its orbiting Earth-observing fleet – the biggest one-year increase in more than a decade. NASA scientists will discuss early observations from the new missions and their current status during a media teleconference at 2 p.m. EST Thursday, Feb. 26.
New views of global carbon dioxide, rain and snowfall, ocean winds, and aerosol particles in the atmosphere will be presented during the briefing.
The teleconference panelists are:
Peg Luce, deputy director of the Earth Science Division in NASA’s Science Mission Directorate, Headquarters, Washington
Gail Skofronick-Jackson, GPM project scientist, NASA’s Goddard Space Flight Center, Greenbelt, Maryland
Ralph Basilio, Orbiting Carbon Observatory-2 project manager, NASA’s Jet Propulsion Laboratory, Pasadena, California
Bryan Stiles, ISS-RapidScat science processing lead, NASA’s Jet Propulsion Laboratory
Matthew McGill, Cloud Aerosol Transport System (CATS) principal investigator, NASA’s Goddard Space Flight Center
NASA Releases First Global Rainfall and Snowfall Map from New Mission.
Africa, from a CATS point of view.
New NASA Earth Science Mission Expand View of Our Home Planet.

FIGURE 1 (Luce) -- Over the past 12 months NASA has added five missions to its orbiting Earth-observing fleet – the biggest one-year increase in more than a decade. The Global Precipitation Measurement (GPM) Core Observatory was launched from Japan on Feb. 27, 2014. The most recent mission, the Soil Moisture Active Passive (SMAP), was launched from California on Jan. 31. Two missions are collecting NASA’s first ongoing Earth observations from the International Space Station.
Image Credit: NASA
FIGURE 2 (Luce) -- NASA's Soil Moisture Active Passive (SMAP) mission will produce high-resolution global maps of soil moisture to track water availability around our planet and guide policy decisions.
Credit: NASA/JPL-Caltech
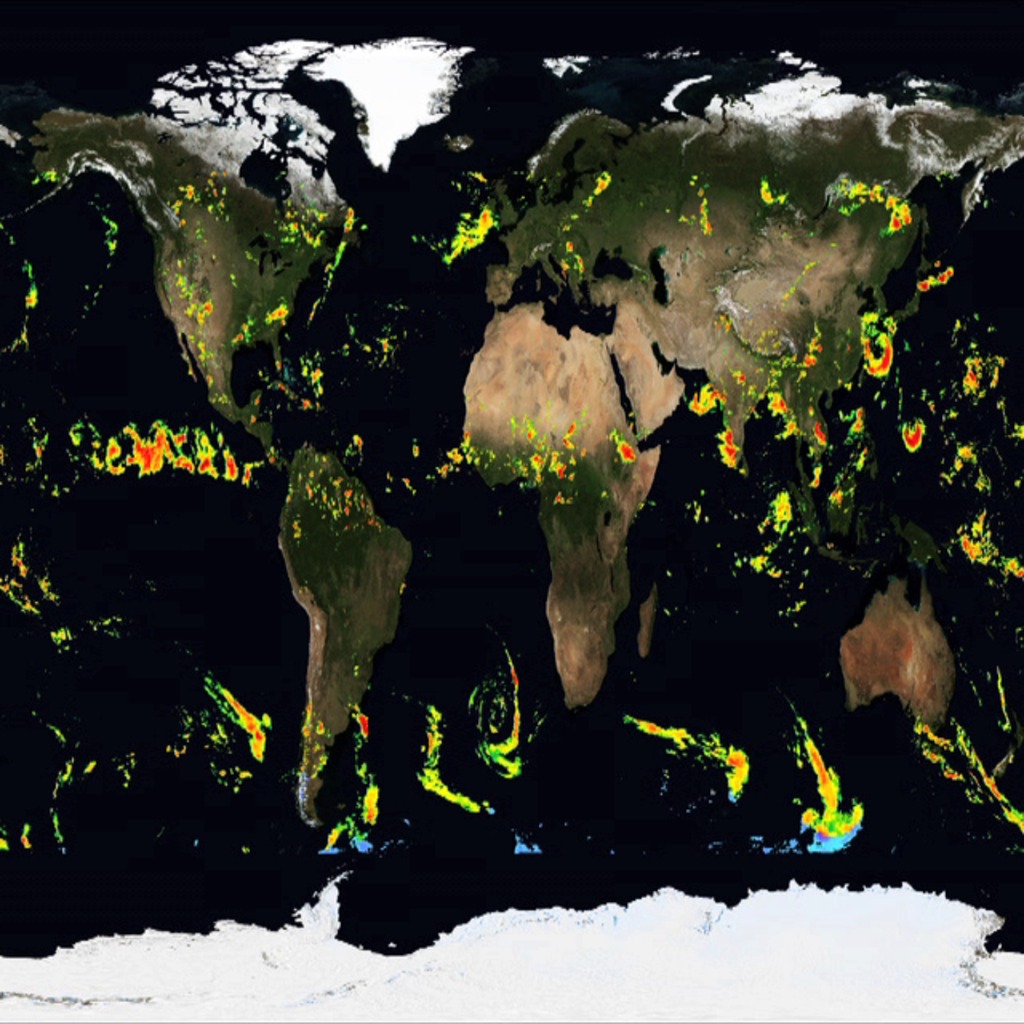
FIGURE 3 (Skofronick-Jackson) -- This is the first global map of falling rain and snow produced by NASA's Global Precipitation Measurement mission; it is based on a NASA data product called Integrated Multi-satellitE Retrievals for GPM, IMERG, which combines observations from an international network of 12 satellites and the GPM Core Observatory into a single, seamless map. Image credit: NASA’s Goddard Space Flight Center
FIGURE 4 (Skofronick-Jackson) -- The GPM Core Observatory captured a 3-D image of a winter storm on Feb. 17 that left six to 12 inches of snow over parts of Kentucky, West Virginia, and North Carolina. The frozen and snowy tops of clouds appear in shades of blue. More intense snow rates are shown in darker blue. Underneath the clouds, the most intense rainfall is shown in red. Image credit: NASA’s Goddard Space Flight Center
FIGURE 5 (Basilio) -- NASA’s Orbiting Carbon Observatory-2 satellite produced these measurements of atmospheric carbon dioxide. The map shows average concentrations over the period Nov. 21 to Dec. 27, 2014. Image credit: NASA/JPL-Caltech
FIGURE 6 (Basilio) -- This map shows solar-induced fluorescence, a plant process that occurs during photosynthesis, from Nov. through Dec. 2014 as measured by NASA's Orbiting Carbon Observatory-2. Image credit: NASA/JPL-Caltech
FIGURE 7 (Stiles) -- Animation of RapidScat daily coverage. Before RapidScat launched the European ASCAT radar was the only source for near-real-time global ocean surface wind vectors. ASCAT provides forecasters with global coverage every 48 hours. With the addition of RapidScat, wind vectors from one of the two radars are available everywhere (except the polar regions) within 24 hours. Image Credit: NASA/JPL-Caltech
FIGURE 8 (Stiles) -- Daily variation in zonal (east-west) winds as observed by RapidScat. The animation cycles through 4 times of day. It depicts average variation throughout the day in the west-to-east flow of winds. For each time, areas where winds consistently move more westward at that time of day are colored blue while areas where they move more eastward are red. Regions where the winds stay the same all day or fluctuate randomly are white. Image Credit: NASA/JPL-Caltech
FIGURE 9 (McGill) -- Video of the installation of the Cloud-Aerosol Transport System (CATS) instrument on the International Space Station on Jan. 22, 2015. Image credit: NASA’s Goddard Space Flight Center
FIGURE 10 (McGill) -- This data image from the CATS lidar instrument shows the vertical distribution of clouds and plumes of dust and smoke measured as the ISS passed over Africa on Feb. 11, 2015. Image credit: NASA’s Goddard Space Flight Center
Credits
Please give credit for this item to:
NASA's Goddard Space Flight Center
-
Writer
- Patrick Lynch (Wyle Information Systems)
-
Producers
- Matthew R. Radcliff (USRA)
- Ryan Fitzgibbons (USRA)
-
Technical support
- Swarupa Nune (InuTeq)
-
Scientists
- Gail Skofronick Jackson (NASA/GSFC)
- Matthew McGill (NASA/GSFC)
-
Visualizers
- Alex Kekesi (Global Science and Technology, Inc.)
- Kel Elkins (USRA)
Release date
This page was originally published on Thursday, February 26, 2015.
This page was last updated on Wednesday, May 3, 2023 at 1:49 PM EDT.
Related
- ID: 11789
 Produced Video