Ozone and TOMS |
|
|---|---|
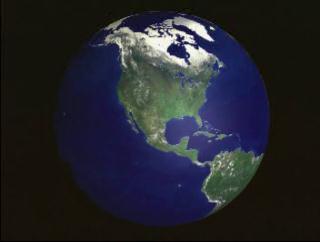
| July 10, 2001 - Date of Web Publication | Following on a legacy of 23 years of daily mapping of the Earth's ozone layer, NASA will launch the fifth TOMS instrument aboard the QuikTOMS spacecraft. The Total Ozone Mapping Spectrometer (TOMS) continuously monitors changes of the Antarctic ozone hole, global and local ozone levels, as well as sulfur dioxide and ash from volcanic eruptions, smoke from forest fires and the flux of ultraviolet radiation reaching the Earth's surface. |
| Page listing EVERY SVS visualization using TOMS data by category
Page listing EVERY SVS visualization using TOMS data by year |
|

Play QuickTime |
QUIKTOMS IN ACTION: Built in just two years rather than the traditional three to five, the Quick Total Ozone Mapping Spectrometer (QuikTOMS) will take over for the TOMS spacecraft in monitoring the Arctic and Antarctic ozone levels, sulfur dioxide, ash, smoke from fires and ultraviolet radiation reaching the Earth's surface. Perhaps most importantly, QuikTOMS follows on a 23-year legacy; this kind of extended period of observation allows scientists to separate human-forced changes from natural atmospheric variations and to help quantify the individual roles of these factors. Of recent note, researchers are hoping to see some ozone recovery as a result of actions like the 1987 Montreal Protocol that limited chloroflourocarbon (CFC) production and use. |
Play MPEG-1 |
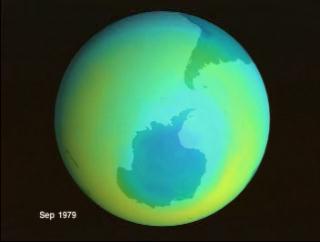
THE ANTARCTIC OZONE HOLE: The year 2000 marked the largest Antarctic hole ever observed. Using data from NASA's Total Ozone mapping Spectrometer (TOMS), scientists can monitor polar ozone levels to gain a better understanding of exposure to harmful radiation, and get a good idea of how the climate is changing. The gap last year reached 28.3 million kilometers squared, roughly three times the size of the United States. |
Play MPEG |
THE ANTARCTIC OZONE LEGACY: Continuous long-term monitoring of ozone levels is crucial in determining how much ozone loss is attributable to human activities and how much is the result of natural atmospheric processes. TOMS instruments have been in space since 1978 monitoring the ups and downs of the ozone and now watch with a hopeful eye for changes resulting from political agreements, like the 1987 Montreal Protocol limiting chloroflourocarbon (CFC) production and use. |

Play QuickTime Play MPEG |
ARCTIC OZONE LAYER animation - While not the 'hole' that exists over the Antarctic, the depleted region of ozone in the Arctic reached its lowest point in 1999 to an altitude of nearly 60,000 feet. The dramatic drop in Arctic stratospheric ozone levels is attributed to extremely low temperatures leading to the formation of Polar Stratospheric Clouds at an earlier date, despite very dry conditions in the stratosphere. These clouds alter chlorine from its benign molecular form to chlorine monoxide, an ozone-destructive compound. |

Play MPEG |
VOLCANIC ASH: When Mt. Pinatubo erupted on June 15, 1991; it was the largest volcanic event in nearly a century with global consequences. Global average temperatures were one degree (F) cooler for over a year due to the massive injection of dust and gases into the upper atmosphere and stratospheric aerosols increased by over 20 times. In addition, the protective ozone layer in the upper atmosphere weakened for more than a year from the gases injected into the stratosphere.
Fortunately the Pinatubo eruption also marked one of the largest climatic events to be observed by a fleet of spacecraft, creating one of science's greatest lab experiments. The TOMS instrument on the Earth Probe spacecraft in particular observed the affected ozone and the aerosols, as seen here. The aerosols resulted from many thousands of tons of sulfur dioxide gas being sent into the stratosphere where it was converted to sulfuric acid particles, or aerosols. It was these particles that helped to reflect sunlight and cool the Earth for a year. |

Play MPEG |
AEROSOLS IN AFRICA: As part of the 2000 SAFARI field campaign in southern Africa, scientists studied pollution and fires - both controlled and natural from space. Here, TOMS aerosol data is combined with fire data from the Advanced Very High Resolution Radiometer (AVHRR) onboard the NOAA-14 satellite. The unprecedented number of fires generated large amounts of aerosols.
Tiny particles suspended in the air, approximately 90% of the aerosols trapped in the atmosphere originated from volcanoes, dust, forest and grassland fires, living vegetation and sea spray. Tracking aerosols is crucial for determining their influence on climate change - at the moment it is unclear whether aerosol content is constant, diminishing, or increasing, or even if they are warming or cooling the planet. |

Play MPEG |
SMOG ACROSS OCEANS: A mixture of smoke and fog, smog is made up of particulates that are formed by a chemical reaction triggered by sunlight. Between July and October of 1997 the tropospheric ozone (smog) levels rose in the Indian Ocean and around Southeast Asia. Smog from biomass burning in Africa traveled across the sea too, combining with Indonesian smog to create a canopy over the region with the highest levels on October 22, 1997. Red denotes high concentrations of ozone and green indicates lower levels while smoke from fires is white as seen by TOMS. |

Play MPEG |
GROUND-LEVEL UV EXPOSED: With decreased ozone levels come elevated levels of ultraviolet exposure, radiation that can reach ground level. TOMS tracks UV-B radiation measured at 290-320 wavelengths. The most dangerous form, it can cause everything from sunburns to skin cancer to cataracts. Worldwide and US measurements of UV-B levels are shown for the year 2000. |
| Back to Top | |
| Page listing EVERY SVS visualization using TOMS data by category
Page listing EVERY SVS visualization using TOMS data by year |
|