|
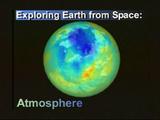
Exploring Earth from Space:
Dr. Marshall Shepherd, NASA/GSFC |
 |
| The previous Landsat Image is a compelling example of how tropical rainfall can devastate developing countries like Mozambique. The Tropical Rainfall Measuring Mission or TRMM (pronounced "Tr-im"), a joint NASA-Japanese Space Agency mission, is providing unprecedented measurements of tropical rainfall. I will speak more on TRMM later, however it is fascinating to observe monthly rainfall totals in the region of Mozambique. If you direct your attention to the red colors in Southeastern Africa in the globe on the left, this represents extremely large rainfall totals during the early part of this year. These rainfall totals caused the massive flooding in Mozambique that Dr. Williams illustrated. | 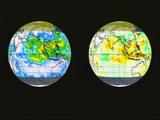 View Movie: [0.6 MB QuickTime] [4.4 MB MPEG-1] |
| Another heavy rainfall producer in this geographic region is the cyclone. We observe, using a Geosynchronous satellite similar to NOAA's GOES series, a Cyclone originating in the Indian Ocean in May of 1999. These storms can end droughts or cause devastating floods on the Indian Subcontinent. There is is no major difference other than geography between a Cyclone in India, a Willy-Willy in Australia, a Typhoon in the Western Pacific, or a Hurricane in the Atlantic. | 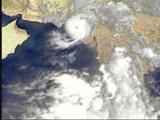 View Movie: [0.7 MB QuickTime] [2.9 MB MPEG-1] |
| Well, we are near the statistical peak in the Atlantic Hurricane Season and closer to home, Hurricanes are hazardous for residents along the East Coast and Gulf of Mexico. Hurricane Floyd was a devastating flood-producer along the eastern U.S. coast in 1999. This view of Floyd is from one of NOAAs GOES satellites, which was developed and launched by NASA. Like its predecessors, Hurricane Hugo and Andrew, Floyd was one of the U.S.'s most costly and deadly hurricanes. Keeping this in mind, it is not hard to imagine why Hurricane Floyd, much larger than Andrew and Hugo in sheer size, prompted the largest emergency management evacuation in history along the East Coast. | 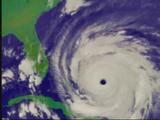 View Movie: [1.0 MB QuickTime] [5.1 MB MPEG-1] |
| GOES is critical for monitoring hurricane size, movement, and path, but NASA's TRMM satellite is enabling new perspectives on hurricanes that many have never seen before. In this Cat-Scan of Hurricane Bonnie, microwave energy from the world's first space-based rain radar, similar to weather radars on TV newscasts, are used to monitor the size and growth of massive thunderstorms within hurricanes. Monitoring these growing thunderstorms in the eyewall could provide clues to processes that cause rapid strengthening of hurricanes. Hurricanes are like big heat engines and the growing thunderstorms are the supercharged pistons converting moist water vapor to energy. This is very similar to how an automobile engine converts gasoline to energy. Some of the thunderstorms depicted in yellow are close to 60,000 feet in height. TRMM was designed to provide critical information on tropical rainfall and its relationship to climate change. As with many NASA satellites however, TRMM is making new discoveries far beyond its original intent. | 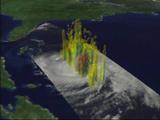 View Movie: [1.9 MB QuickTime] [9.0 MB MPEG-1] |
| In addition to the natural hazards like hurricanes and flooding, NASA's Earth Science Enterprise seeks to monitor and understand global climate change. Depletion of "good" ozone in the stratosphere is an example of an important change in the atmospheric component of Earth's system. In fact, earlier this month, NASA's Total Ozone Mapping Spectrometer or TOMS detected an Arctic Ozone hole three times the entire land mass of the US, the largest "hole" ever observed. Variations in ozone depletion are common from year to year, however this observation demonstrates the importance of monitoring ozone. Recent evidence from TOMS also indicates that Ozone Depletion over the Arctic is occurring (low ozone amounts during the most recent winter are represented in blue). According to NASA scientists, Ozone losses of over 60 percent occurred in the Arctic stratosphere this winter, one of the coldest on record. This was one of the worst ozone losses over the Arctic. At this point, I should remind you that Ozone in the stratosphere is a vital filter of the sun's UV radiation, which is harmful to human skin and our vegetation food supply. | 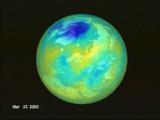 View Movie: [0.4 MB QuickTime] [1.7 MB MPEG-1] |
| Investigations into the Arctic stratosphere have provided some clues as to what may be happening and the culprit may be Polar Stratospheric Clouds (represented by the pink masses moving around the arctic circle). Polar stratospheric clouds aid in the destruction of stratospheric ozone by promoting chemical reactions involving chlorine. Here we see that this past winter, polar stratospheric clouds covered a larger area, and persisted for a longer period of time, than for any Arctic winter during the past 20 years. These conditions indicate a possible connection between climate change and stratospheric ozone depletion. Upcoming launches of NASA's QuiKTOMS and AURA satellites will continue gathering important data on ozone. | 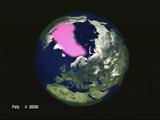 View Movie: [0.6 MB QuickTime] [2.7 MB MPEG-1] |
| As we've seen, chemical reactions in the stratosphere play critical roles in the destruction of so called "good Ozone". A bit closer to the surface, NASA's flagship in the Earth Observing System program (introduced by Dr. Williams earlier), Terra, is providing important information (in some cases, for the first time) on global coverage of carbon monoxide and aerosols in the troposphere. Both constituents are produced by burning fossil fuels and other human or natural activities (like forest or wild fires). | 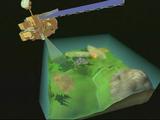 View Movie: [0.8 MB QuickTime] [3.7 MB MPEG-1] |
| The data that you see from TERRA data shows global coverage of Carbon Monoxide as measured by instrument aboard TERRA called MOPITT (Measurements of Pollution in the Troposphere), which was developed in partnership with the Canadian Space Agency. Focusing on the African Sahel, reds and yellows indicate large amounts of carbon monoxide associated with widespread burning brush and trees for agricultural use. Sahel Fires are identified as warm colored dots, measured by MODIS (Moderate resolution Imaging Spectroradiometer), also aboard TERRA. If you've heard the saying, "where there is smoke there is fire", TERRA seems to indicate that "where there is fire, there is carbon monoxide." This data is an important example of the linkages between the atmosphere and land that TERRA can provide. The makeup of greenhouse gases and aerosols in the troposphere is vital to our ability to assess if global warming is occurring and what its impact on life will be. Finally, because Earth behaves as a system, it is important to show how aspects of weather and climate respond to different parts of the system. Such linkages highlight the importance of NASA's comprehensive systems approach to understanding climate change. | 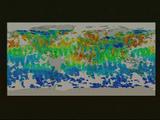 View Movie: [0.8 MB QuickTime] [3.8 MB MPEG-1] |
| The TRMM satellite, which you see here, is providing comprehensive rainfall measurements in the tropics. Almost 67% of the world's rainfall occurs in the tropics. This rainfall provides 75% of the energy supply that drives atmospheric circulation, which ultimately produce day to day weather as well as climate. | 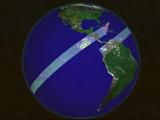 View Movie: [0.4 MB QuickTime] [1.6 MB MPEG-1] |
| In the globe on the left, large rainfall totals are represented in this two year data set from 1998-2000 as yellow and red colors. Such rainfall measurements and the associated latent heating information are showing positive impact in climate and experimental hurricane forecast models. Additionally, TRMM information can produce rainfall anomalies (how wet or dry a region is compared to an average). Anomalies indicate regions along the globe that are experiencing extreme amounts of rainfall (red, yellow, and brown colors) and a lack of rainfall (green colors). Such information is valuable for assessing agricultural activities, land-use planning, the likelihood of vector-borne disease outbreaks, or even assessing El Niño/La Niña patterns. We have already seen an extreme example of flooding in Mozambique. One reason that rainfall in southeast Africa was so extreme this year relates to the sea surface temperatures in the Indian Ocean. Dr. David Adamec will now explore NASA efforts to better understand important ocean processes and how they impact weather, climate, and land processes. | View Movie: [1.3 MB QuickTime] [6.9 MB MPEG-1] |