LASER ALTIMETER PROVIDES FIRST MEASUREMENTS OF SEASONAL SNOW DEPTH ON MARS
A global view of how Mars changes with the seasons has been provided by extremely precise observations from two investigations on NASA's Mars Global Surveyor (MGS) spacecraft.
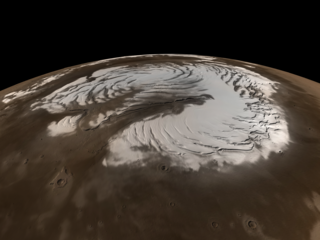
True color image of Mars' North Pole
|
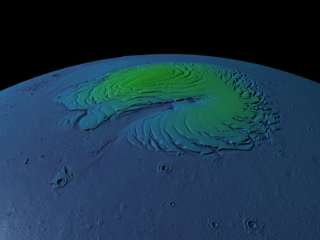
False color image of Mars' North Pole
|
Mystery of the Martian Snow
The Poles of Mars: These images of the north and south poles use
precise measurements from MOLA to generate a 3-D topography
view of Mars. The images on the left are colored by mosaic provided
by the MGS Mars Orbiter Camera (MOC). The images on the right are colored
according to the relative height of the surface features.
Scientists uses a special palette to
color MOLA topography. The higher relative elevations are
indicated by warm colors and lower elevations are shown by
cool colors.
|
|
True color image of Mars' South Pole
|
False color of Mars' South Pole
|
|
Elevation and gravity measurements of Mars from MGS have been used to measure seasonal changes in the thickness of seasonal frost deposits and to provide the first direct measurement of their density. The observations were obtained from the Mars Orbiter Laser Altimeter (MOLA) and the spacecraft's radio tracking system.
Over the course of a Martian year, which consists of 687 Earth days, as much as a third of Mars' tenuous carbon dioxide (CO2) atmosphere "freezes out" during the winter in the northern and southern hemispheres. A team consisting of Dr. David E. Smith of NASA's Goddard Space Flight Center (Greenbelt, Md.), and Drs. Maria T. Zuber and Gregory A. Neumann of the Massachusetts Institute of Technology, measured changes in the height of the Martian surface every two weeks. They showed that small changes in surface height correlate with the expected times of deposition and evaporation of CO2 from the surface. The group also measured miniscule changes in the gravity field of Mars due to the movement of carbon dioxide, which allowed them to make the first measurement of the density of surface frost deposits.
|
Image 5 |
Image 6 |
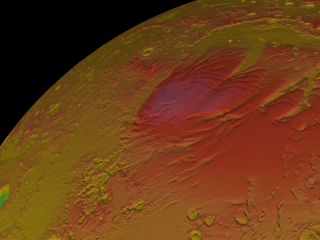
Ski Mars -- Martian Snow Depth Revealed Scientists made precise measurements from the orbiting laser over
the course of the Martian year to create a portrait
of the changing depth of the frozen carbon dioxide (CO2).
The MOLA results show that a maximum of 1.5 to 2 meters
of frozen material are deposited during the Martian
winter. During the summer, the frozen CO2 evaporates
and returns to the atmosphere. These two graphs show
the maximum amount of 'snow' that accumulated over the
northern hemisphere [first image and southern hemisphere
[second image].
|

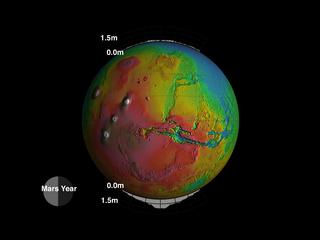
"Snow on Mars is composed of dry ice and last year it reached a maximum depth of 1.5 to 2 meters near both the north and south poles," explained Smith, Principal Investigator of the laser altimeter investigation and lead author of the study published in the December 7 issue of Science.
"Snow on Mars is denser than it is on Earth, being more ice-like than powdery," noted Zuber, the Deputy Principal Investigator of the altimeter investigation. To isolate the signals, the group measured changes of 10 centimeters in the height of the surface of Mars, and changes of a couple parts per billion in the planet's global mass distribution.
|
Image 7 |
Image 8 |
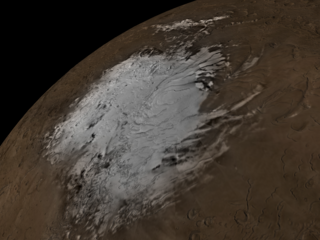
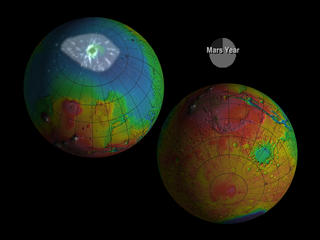
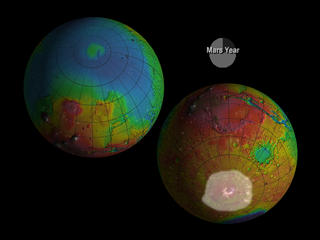
Clues from the Clouds Scientists were also able to track elusive Martian clouds linked
to the frozen deposits. The thin lines in these images
are the tracks of the laser bouncing off of the clouds.
Scientists add the tracks together can see how the range
of the clouds (white overlay) change during the Martian
year. The results will allow a better understanding
of the Martian atmosphere, which will improve the ability
to target future landers. Characterizing the present-day
behavior of CO2 is a necessary first step towards understanding
past climates on Mars. The images show the clouds associated
with the CO2 precipitation in the northern hemisphere
[first image] and the southern hemisphere [second image].
|
The results will allow a better understanding of the Martian atmosphere, which will improve the ability to target future landers. In addition, carbon dioxide is the most abundant gas in the atmosphere of Mars and it is a greenhouse gas. "Characterizing the present-day behavior of CO2 is a necessary first step towards understanding past climates on Mars," noted Neumann.
Mars Global Surveyor is currently in its extended mapping mission,
which runs until April 2002. The MOLA instrument was designed
and built by the Laser Remote Sensing Branch of the Laboratory
for Terrestrial Physics at Goddard. The MGS Radio Science
experiment is implemented from the Center for Radio Astronomy
of Stanford University, Palo Alto, Calif. The Mars Global
Surveyor mission is managed for NASA's Office of Space Science,
Washington, D.C., by the Jet Propulsion Laboratory, Pasadena,
Calif., a division of the California Institute of Technology.
High resolution images:
Image 1
Image 2
Image 3
Image 4
Image 5
Image 6
Image 7
Image 8