Cracks in the Ice - New Insights into Antarctic Ice Sheet Failures
Note: There are numerous images and animations contained on this page. This may result in longer downloads. Please SCROLL DOWN to view the animations and images.
Introduction:
Most people regard the desolate expanses of polar ice as practically unchanging and imperturbable, poetically bookending the rest of our vibrant, blue-green world. Not so, says a new study. According to a paper released in the latest issue of the Journal of Glaciology, major stretches of ice shelves along Antarctic peninsulas literally collapsed into floating splinters as several recent warmer than normal summers took their toll. The research adds strong evidence to the case that climate change can have a significant impact on the condition of the Earth’s polar caps, which in turn can play a major role in changes to wider planetary climate and environmental conditions.
IMAGES OF THE LARSEN ICE SHELF AND THE MECHANISMS OF CHANGE
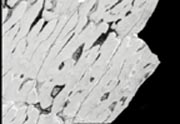
Zooming in for a Closer Look
Click here for animation
Large JPG image
TIFF image
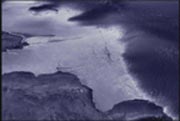
The Larsen Ice Shelf is one of a number of shelves on the southernmost continent. Looking at it from above, the region lies on the eastern side of the northernmost peninsula, a stretch of land pointing towards South America.
In 1995 alone, a region of ice on the Larsen Ice Shelf more than two-thirds the size of Rhode Island disintegrated in a fierce storm. Additional ice broke away from the rest of the shelf in 1998. This dramatic change to so much ice is the product of several forces acting in concert. In this visualization we start with an overall picture of the continent and zoom in to the specific area of study.
These images are the product of the Landsat 7 satellite. They are provided courtesy of NASA/USGS.
Surface Water
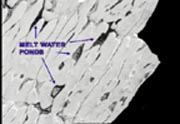
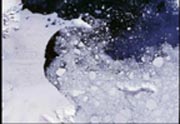
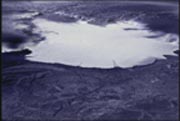
This image shows a section of the remaining Larsen Ice Shelf. The dark patches scattered around the white background are regions of surface melt water, formed during the summer season. It’s from these pools that water drained into cracks in the shelf to form the wedges that ultimately shattered the ice. NASA’s Landsat 7 spacecraft took this picture on February 21, 2000.
Images courtesy: NASA/USGS
Before and After
Click here for animation
Large JPG image from 1993
TIFF image from 1993
Large JPG image from 2000
TIFF image from 2000
The Larsen Ice Shelf is one of several so-called ice shelves in Antarctica. Although not the largest, experts consider it to be most in jeopardy of further recession due to its comparatively northern position. In this sequence, we see how the ice there has changed through time, starting in December 1993 and ending in March 2000.
These images are the product of NOAA’s AVHRR instrument, (Advanced Very High Resolution Radiometer), flying aboard that agency’s POES (Polar Orbiting Environmental Spacecraft) satellite.
The POES spacecraft took the images used to create this sequence on the following dates:
December 26, 1993, February 13, 1995, March 21, 1998, November 21, 1998, March 2, 2000.
Images courtesy: NOAA/NASA
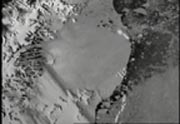
A Process of Change: What Happened to Shatter the Ice
Click here for animation
Large JPG image
TIFF image
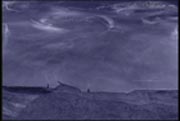
The mechanism that rends vast stretches of Antarctic ice from its moorings is similar to what causes roads to crack in late winter.
Cracks form in the ice shelf for a number of reasons. But crevasses often appear along the landward side of the shelf as ice moving in glaciers grinds past features on the coast and plows into the ice on the shelf.
As melting water on the surface of the shelf fills in those fissures and crevasses, pressure builds in the structure of the sheet. That process can either increase gradually, or it can be repeated seasonally. What happens is a gradual splintering of a wide section of shelf, which is then ultimately rent asunder by tides or storms.
The process is believed to be more a function of mean summertime temperatures, as opposed to overall annual temperatures.
Antarctica’s ice shelves account for about two percent of all ice found there. Experts say that advance and retreat of those shelves usually happen in terms of decades, not individual years.
These images are the product of the Landsat 7 satellite. They are provided courtesy of NASA/USGS.
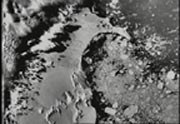
A Look at the Retreating Ice Sheet
Click here for animation
Large JPG image
TIFF image
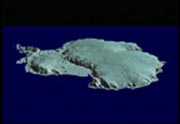
We start this animation with a look at Antarctica’s ice pack as it appears today. Then the scene changes to describe how the continent likely looked at the peak of the last ice age, nearly 20,000 years ago. As the years roll backwards in a matter of seconds, we see just how significantly the area can be altered as planetary conditions change.
As the animation cycles back to the present, consider that since the last ice age, the west Antarctic ice sheet has lost nearly two thirds of its mass during this period, a volume of ice sufficient to raise sea levels approximately 33 feet around the globe.
Images courtesy: NASA
A TOUR OF SEVERAL ANTARCTIC ICE SHEETS
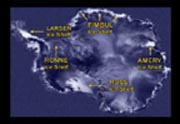
The largest of the ice shelves in Antarctica is the Ross. Its thickness varies from six hundred feet to as much as three thousand in places; it covers an area approximately as large as France. The Ross catches the outflow of major glaciers and ice streams, draining ice from the continent’s interior. Experts caution that a massive collapse of the Ross Ice Shelf could have measurable effects on global sea levels.
This image is the product of the Canadian Space Agency's RADARSAT satellite. They are provided courtesy of NASA, the Canadian Space Agency, and Ohio State University.
LARSEN ICE SHELF – Another comparison
Click here for animation
Large JPG image
TIFF image
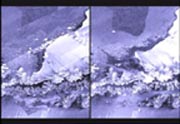
In 1978, scientists predicted that global warming would lead to a disintegration of Antarctic Peninsula ice shelves. Spaceborne data indicate that this prediction may be coming true. In these before and after images, note the dramatic change in the apparent shoreline. Scientists captured the first image in using the ERS-1 satellite in 1992. As seen in the second image, collected by RADARSAT in 1997, huge changes have come to the coastline. Notice how the once attached expanse of ice that was Larsen became thousands of floating shards and icebergs, drifting out to sea.
FIMBUL ICE SHELF
Click here for animation
Large JPG image
TIFF image
Icebergs form when hunks of ice break away from glaciers pushing into the ocean. Ice shelves are the edges of those glaciers, extending out into the ocean faster than ice bergs can break off from the edge. The Fimbul Ice Shelf has remained relatively consistent in its appearance for the last thirty years, but researchers are paying close attention to changes. Ice shelves are considered to be particularly sensitive to climatic changes and scientists have detected a marked retreat along the Antarctic Peninsula. Note the fascinating formations along the Fimbul, believed to be the product of glacial ice flowing over rocky outcroppings and islands.
These images are the product of the Canadian Space Agency's RADARSAT satellite. They are provided courtesy of NASA, the Canadian Space Agency, and Ohio State University. Back to top
AMERY ICE SHELF
Click here for animation
Large JPG image
TIFF image
At the mouth of the Lambert Glacier spreads the Amery Ice Shelf. For the most part, ice shelves grow from glaciers pushing down into the sea. They also grow from precipitation. Ice Shelves respond to climate change faster than sheets of ice on the ground or continental glaciers. Scientists hope that continued study of ice shelves like Amery will help them better understand what sorts of changes are happening to the world’s climate in general. Of particular interest is whether observed changes in various ice shelves are the result of natural processes or are anthropogenic, that is, the result of actions taken by humans.
These images are the product of the Canadian Space Agency's RADARSAT satellite. They are provided courtesy of NASA, the Canadian Space Agency, and Ohio State University. Back to top
RONNE ICE SHELF
The Ronne Ice Shelf grows primarily due to a constant flow from inland ice sheets. Where shearing stresses are greater than the strength of the ice itself, cracks form. These cracks ultimately widen and spread like varicose veins in the frozen skin of the coast, only to break loose and become icebergs. Early in the 1990’s a slab of ice the size of Delaware broke free from this area. A recent iceberg more than 40 miles wide now floating in the South Atlantic originated from the Ronne Ice Shelf.
Interestingly, as ice shelves break up into icebergs, the sea level generally doesn’t rise. That’s because ice shelves are ostensibly floating in the water already. That floating ice, connected to the shore by ice sheets and glaciers, displaces a volume of water equal to the volume of water contained in the shelf. When a berg breaks off, or calves, there is no new water to displace. It simply separates from shore...and goes on its way.
These images are the product of the Canadian Space Agency's RADARSAT satellite. They are provided courtesy of NASA, Canadian Space Agency, and Ohio State University.
LANDSAT 7 - KEEPING AN EYE ON EARTH'S CHANGING FACE
Click here for animation
Large JPG image
TIFF image
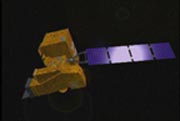
From an altitude of 438 miles (730 kilometers), Landsat 7 can see surface features as small as 15 meters, providing world-wide land resource information for a diverse range of uses. The satellite is part of a global research effort NASA calls the Earth Science Enterprise, which seeks to acquire a long term understanding of the changes to our planet. Landsat 7 is the latest in a series of satellites. It roared into orbit aboard a Boeing Delta II rocket on April 15, 1999 from Vandenberg Air Force Base in California. NASA officially called the first Landsat satellite the Earth Resources Technology Satellite, or ERTS-1, on July 23, 1972. Since then the program has continued to pave the way in research and data acquisition techniques about the surface of our planet.
Images courtesy: NASA/USGS
THE RADARSAT SATELLITE
Click here for animation
Large JPG image
TIFF image
NASA launched the RADARSAT satellite for the Canadian Space Agency in exchange for certain operational executions. Unlike mapping satellites that rely on reflected sunlight or infrared readings, RADARSAT’s Synthetic Aperture Radar (SAR) is able to penetrate cloud cover or work in the dark of night.
Courtesy: NASA/Canadian Space Agency
This multimedia project is the work of a dedicated team of researchers, animators, and media specialists. A detailed companion video to this web site is available from NASA-TV. Below are a list of agencies, departments, and researchers who provided expertise and data for this production:
NASA - Goddard Space Flight Center
Scientific Visualization Studio
Television Production NASA-TV/GSFC
Conceptual Image Lab
Content Preparation & Project Production: Michael Starobin
GSFC Public Affairs Contact: Wade Sisler
Press Release
Goddard's Ice web page
NASA’s Earth Observing System
EOS Data and Information System (EOSDIS)
The Earth Observatory
The Remote Sensing Tutorial
The Landsat Gateway
RADARSAT International
Byrd Polar Research Center
NASA Studies Shrinking Ice Sheet (press release)