Predicting Hurricane Intensity Far from Land
Read the official press release
For years scientists have known of the strong correlation between sea
surface temperature and the intensity of hurricanes. But one of the major
stumbling blocks for forecasters has been the precise measurement of those
temperatures when a storm begins to form. Traditional techniques for sea
surface temperature measurement can not see through clouds. Now researchers
using the TRMM (Tropical Rainfall Measuring Mission) satellite have
developed a technique for looking through
clouds is likely to enhance forecasters' abilities to predict hurricane
intensity before their massive energies fully develop.
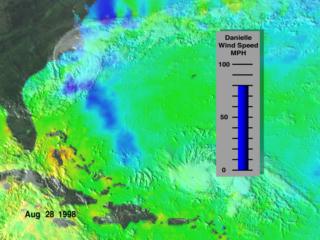
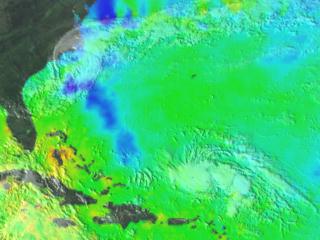
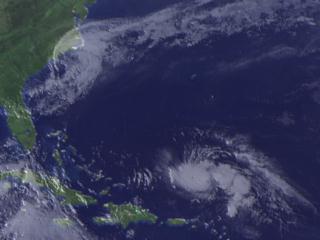
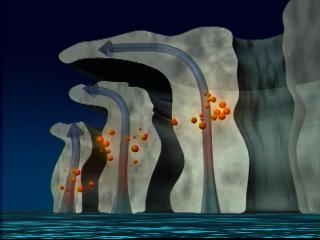
Cause and Effect: Bonnie's Trail Weakens Danielle A hurricane gathers energy from warm waters found in tropical latitudes. In this image we see Hurricane Bonnie cross the Atlantic, leaving a cooler trail of water in its wake. As Hurricane Danielle crosses Bonnie's path, the wind speed of the second storm drops markedly, as available energy to fuel the storm's engine drops off. As Danielle crosses Bonnie's wake, however, notice how winds speeds increase due to temperature increases in surface water aound the storm. See Animation Seeing Surface Temperature through Clouds The clouds shown in this image were collected by the Geostationary Operational Environmental Satellite (GOES). Surface temperatures were gathered by TMI, the TRMM Microwave Imager. Notice how the ocean area directly following each storm registers as slightly cooler than surrounding ocean water. This is due to the nature of hurricanes in that they power themselves on heat found in tropical ocean surfaces. See Animation Cooling off the Engine: Colder Waters Affect Hurricane Strength The Clouds of Hurricanes Bonnie and Danielle The Inner Structure of a HurricaneStudying the Heartbeat of Hurricanes TRMM has enabled scientists to look inside hurricanes and better understand how they work by using a unique suite of active and passive sensors capable of measuring rainfall and sea surface temperature. These powerful storms act essentially as engines, drawing energy up from warm tropical ocean waters to power the churning, swirling winds of their radial arms. Unwrapping the Clouds The driving engine of a hurricane converts heat from tropical ocean waters to raging winds and heavy rain. In this animation, notice how heat is drawn up by central, cyclonic winds and distributed to the swirling clouds surrounding the eye. The warmer the ocean waters beneath, the more powerful the storm is likely to grow. See Animation Releasing Energy from Water Molecules As water vapor evaporates from the warm ocean surface, it's forced upward in towering convective clouds that surround the eyewall and rainband regions of the storm. As the water vapor cools and condenses from a gas back to a liquid state it releases latent heat. See Animation Towering Clouds The release of latent heat warms the surrounding air, making it lighter and thus promoting more vigorous cloud development. It's believed that rapid bursts of cloud growth, particularly in the eyewall region of hurricanes, may relate to the intensification phase of a storm. It is also interesting to note that it's due to the intense winds speeds surrounding the eye that clouds are often absent from the center of a hurricane; they're simply thrown out from the center. See Animation TRMM Sees Inside Hurricanes
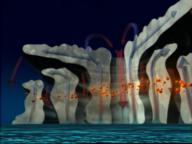
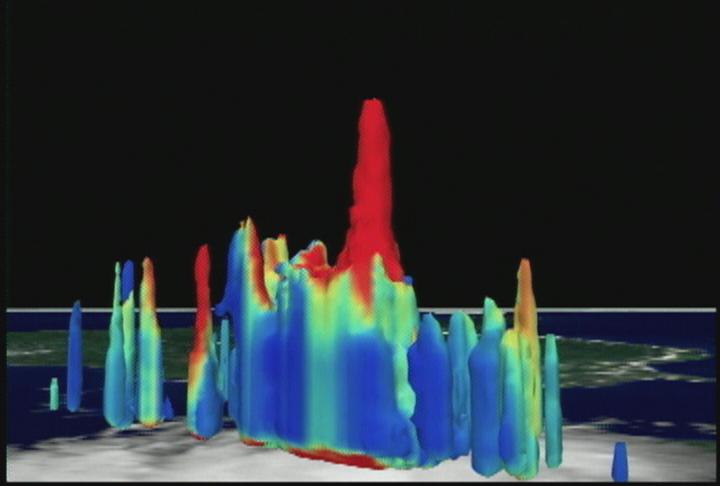
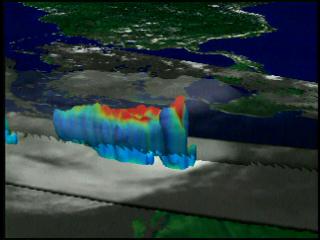
These images of Hurricane Bonnie come from the rain radar flying aboard TRMM. They show a cumulonimbus (storm) cloud towering 59,000 feet into the sky from the eyewall. Scientists believe that towering cloud structures like this are probably precursors to hurricane intensification. These images were obtained August 22, 1998. See Animation Hurricane CAT Scans
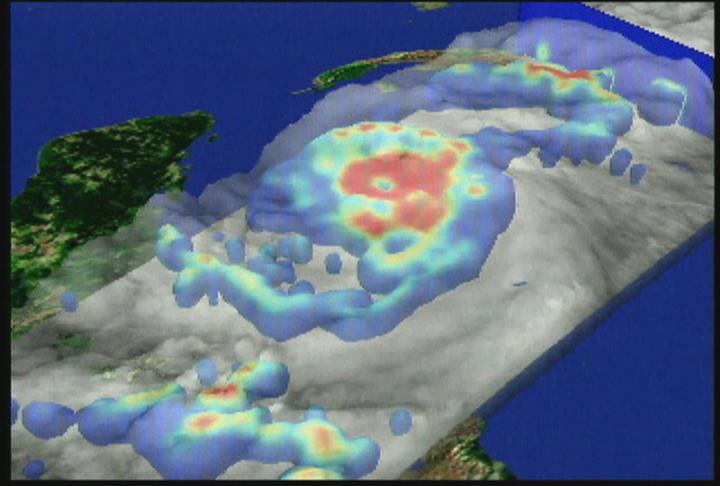
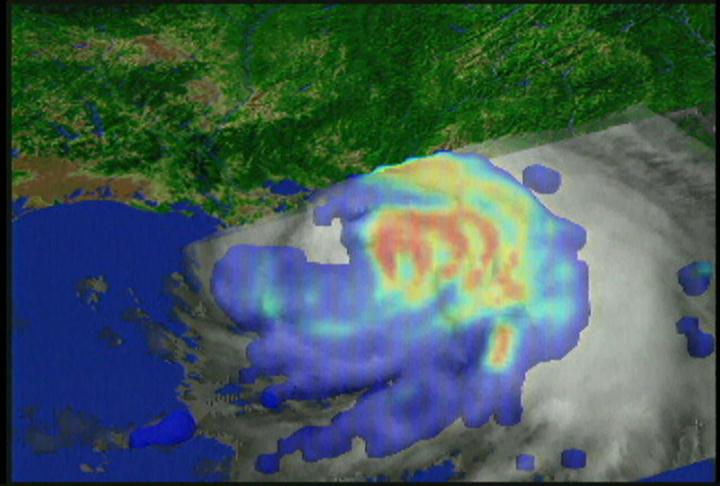
The following Hurricane visualizations were developed using data from TRMM's precipitation
radar. High rates of rainfall appear in red, with lesser amounts appearing
in blue. By mapping the structure of storms, experts can "take them apart"
in the laboratory as they try to understand how they work. TRMM gathered data
for these images of hurricanes Mitch, George, and Earl in 1998.
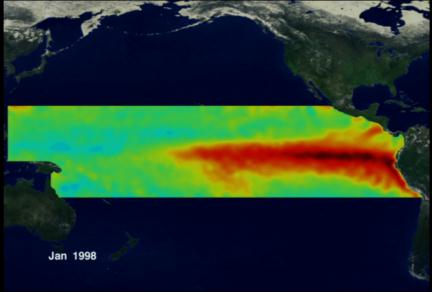
El Niño Sea Surface Temperatures Satellite observations trace the evolution of warmer than normal Pacific waters associated with El Niño (shown in red) from its peak in December 1997 through its decline in early 1998. TRMM's Microwave Imager collected the data for these observations. Rainfall Predictions using the "Super-ensemble" Model TRMM has been highly successful in increasing meteorological forecasting
capabilities. Project researchers recently announced the "super-ensemble"
forecasting technique where TRMM data was added to existing weather
prediction information, yielding an increase in rainfall forecasting
accuracy of nearly 100%. In the following images gathered during September
1999, compare the month's collected one-day forecasts to the collected daily
observations of actual rainfall. It was during that month that Hurricanes
Floyd and Irene drenched much of the East Coast. In this representation the
overall forecasting trend through time is more significant than precise
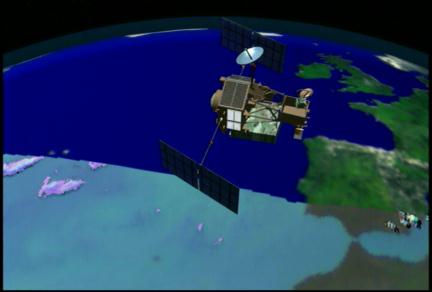
matching of the rainfall areas shown in the animation's two maps. TRMM Satellite Animation The TRMM (Tropical Rainfall Measuring Mission) satellite measures tropical rainfall in a band around the Earth stretching 35 degrees north and south of the equator. The instrument uses several instruments to detect rainfall, including radar, microwave imaging, and lightning sensors. TRMM data is available to researchers around the world; it is managed by a team at NASA's Goddard Space Flight Center in Greenbelt, Maryland. For further information, check out the following web sites:
Please give credit for these images to: NASA - Goddard Space Flight Center Scientific Visualization Studio Project Scientist: Chelle Gentemann Project Scientist: Frank Wentz Content Preparation & Project Production: Michael Starobin Last Revised: February 4, 2019 at 06:02 PM EST |