El Niño Visualizations
NASA-Goddard Space Flight Center
The animations and images below show a combined perspective of the El Niño induced change in the sea surface topography as viewed from space by the NASA TOPEX radar altimetry satellite and sea surface temperature observed by NOAA's AVHRR sensor for the period from January 1997 to December 1997 . The three dimensional relief map shows a sea level rise along the Equator in the eastern Pacific Ocean of up to 34 centimeters with the red colors indicating an associated change in sea surface temperature of up to 5.4 degrees Celsius. Also shown is a combined perspective of the the weakening of the Trade Winds across the Pacific Ocean and the associated increase in sea surface temperature. The convergence of the surface wind field into the anomalous warm water regions indicates a continued strengthening of this El Niño event.
You can also get an up to date view of the current situation in the tropical Pacific and a tutorial on the El Niño phenomenon by clicking here.
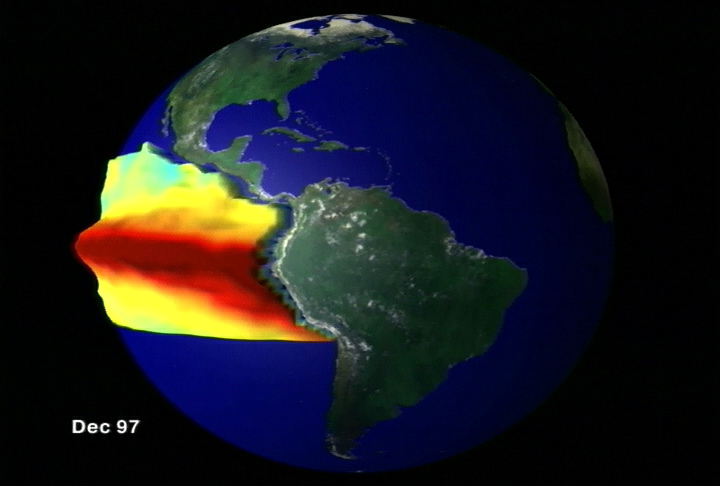 |
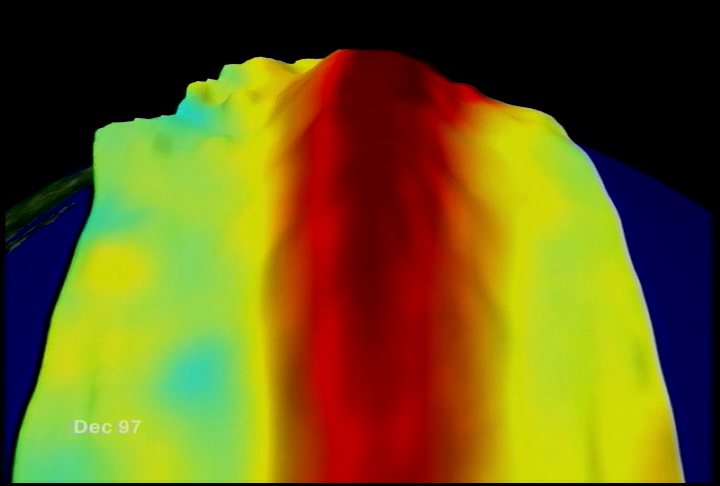
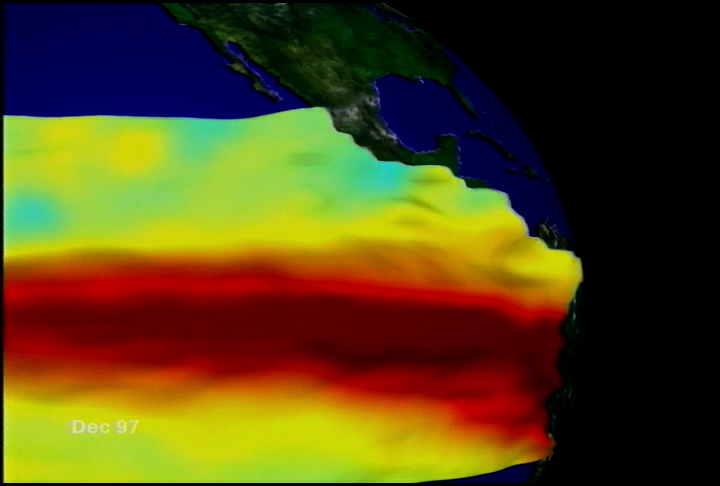
3D Views of SSH and SST Three views of sea surface height (represented by the bumps) and sea surface temperature (represented by the color). Red is 5 degrees C above normal, blue is 5 degrees C below normal. Data from 1/1/97 to 12/6/97. Movie (3.36 MB) |
 |
|
 |
|
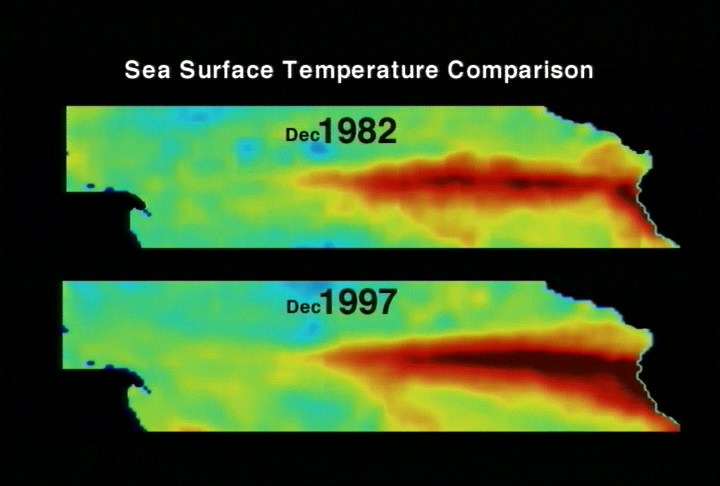 |
1982-83 to 1997 SST Comparison Compares 1982-83 sea surface temperature anomaly to 1997 anomaly (red is 5 degrees C above normal, blue is 5 degrees C below normal). Data from 1/1/82 to 12/23/83 & 1/1/97 to 12/6/97. Movie (6.53 MB) |
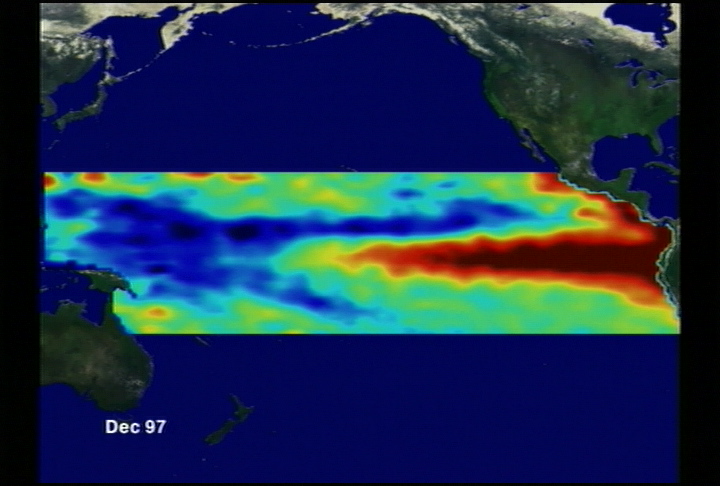 |
1997 Sea Surface Height Anomaly Shows the difference in sea level between 1997 and a normal year (red is 15 cm above normal, blue is 15 cm below normal). Data from 1/1/97 to 11/29/97. Movie (3.06 MB) |
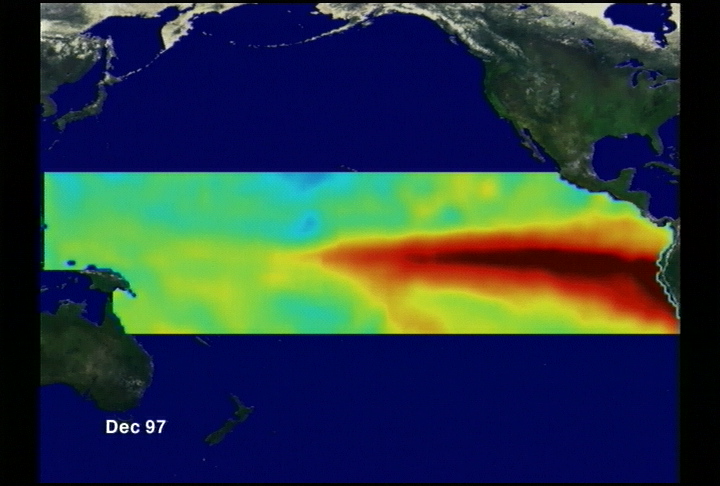 |
1997 Sea Surface Temperature Anomaly Shows the difference in sea surface temperature between 1997 and a normal year (red is 5 degrees C above normal, blue is 5 degrees C below normal). Data from 1/1/97 to 12/6/97. Movie (3.81 MB) |
 |
Studying El Niño Using Multiple Data Sets Shows how scientists study many different elements that cause El Niño, including sea surface height, sea surface temperature, and sea surface winds. Data from 1/1/97 to 12/6/97. Movie (6.63 MB) |
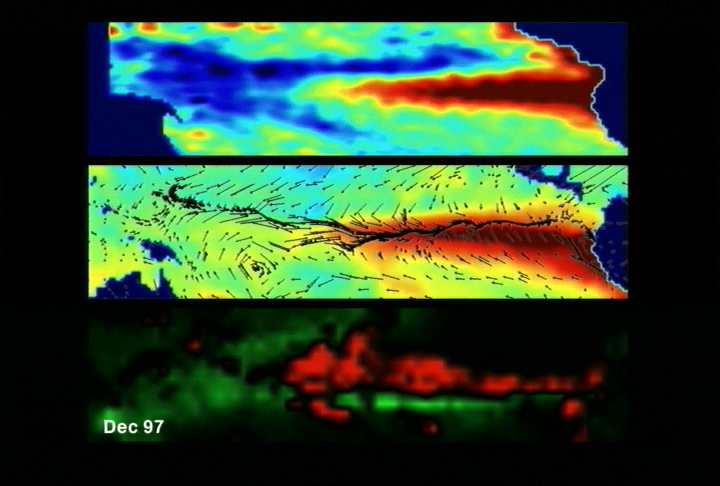 |
1997 SSH, SST, Wind, and Precipitation Anomalies Shows sea surface height anomaly on top, sea surface temperature anomaly with sea surface winds anomaly in the middle, and surface precipitation on the bottom. Data from 1/1/97 to 12/6/97. Movie (3.37 MB) |
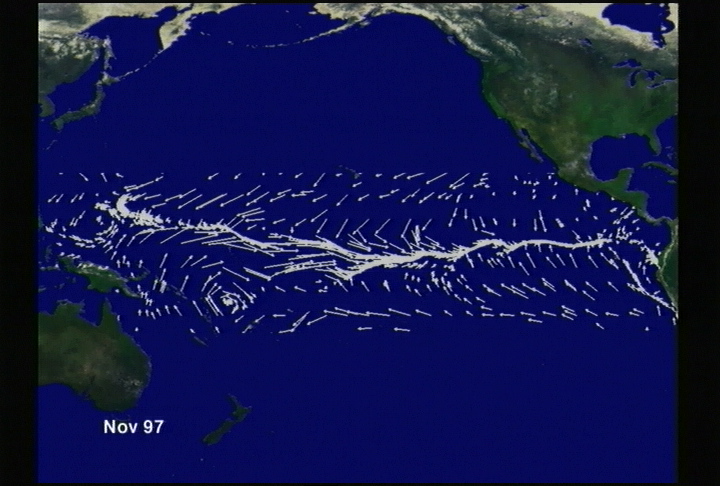 |
1997 Sea Surface Wind Anomaly Shows the sea surface wind anomalies and the weakening of the Trade Winds across the Pacific Ocean . Movie (682 K) |
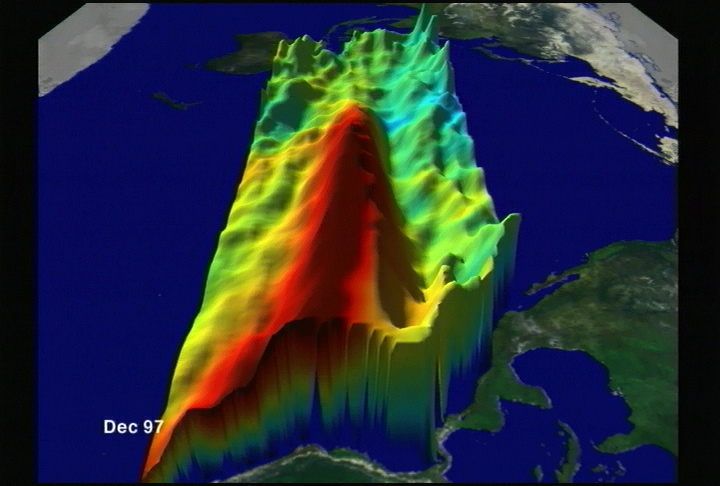 |
1997 SSH & SST Anomalies Side View Shows sea surface height (represented by the bumps) and sea surface temperature (represented by the color). Red is 5 degrees C above normal, blue is 5 degrees C below normal. Data from 1/1/97 to 12/6/97. Movie (713 K) |
 |
1997 SSH & SST Anomalies Iso View Shows sea surface height (represented by the bumps) and sea surface temperature (represented by the color). Red is 5 degrees C above normal, blue is 5 degrees C below normal. Data from 1/1/97 to 12/6/97. Movie (713 K) |
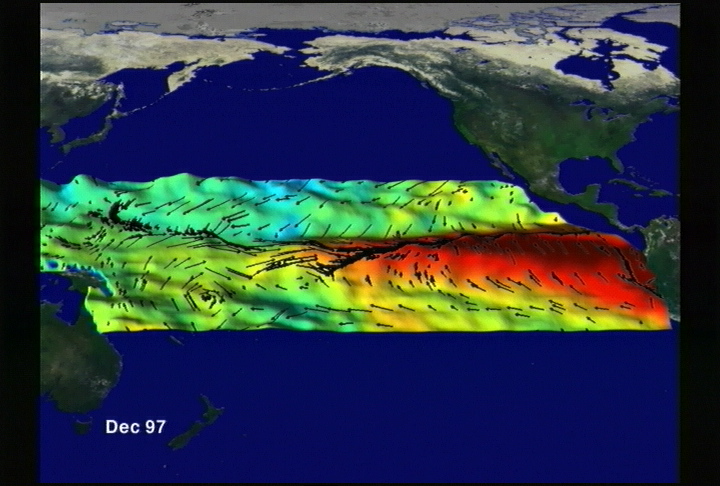 |
1997 SSH, SST, & Wind Anomalies Shows sea surface height (represented by the bumps), sea surface temperature (represented by the color), and sea surface winds (represented by arrows). Red is 5 degrees C above normal, blue is 5 degrees C below normal. Data from 1/1/97 to 12/6/97. Movie (3.05 MB) |
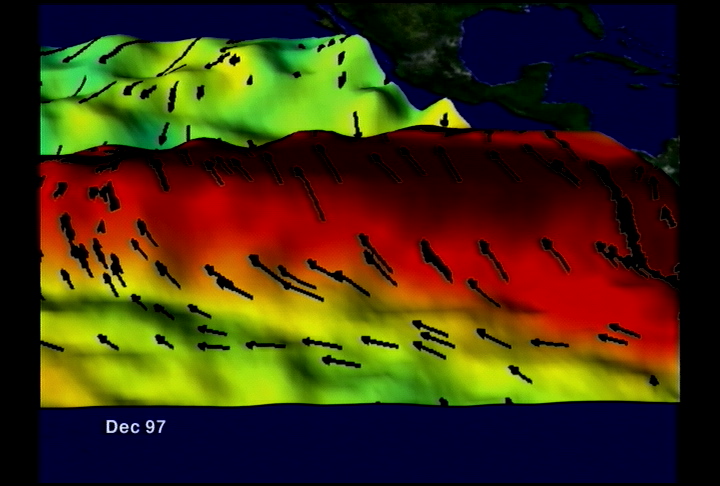 |
1997 SSH, SST, & Wind Anomalies Closeup View (see above) |
Images and Animations produced: | ||||
|