
 |
 |
 |
| September 1973 | May 1983 | September 2000 |
View Long Movie
View Short Movie
THE BIG BREAK--ANTARCTIC GLACIER CRACKS

When NASA glaciologist Bob Bindschadler saw the picture, he knew he had found something important.
Taken by the Landsat 7 spacecraft, the image in question showed a thin, 25 kilometer (15 mile) crack in what's called the Pine Island Glacier in Antarctica. What surprised him and the scientists he immediately contacted was the fact that images taken just ten months before showed no sign of such a fissure. A major break was forming in the Antarctic ice, and he and his colleagues had caught it in the act.
Further study would show that the tear in Antarctica's icy cloak had happened in a period of little more than five weeks. Although the speed of the crack seems to have slowed as it picks its way across the ice, Bindschadler says he believes there will be a huge new iceberg falling into the south seas within the next year and a half or so, assuming the crack continues to grow.
The Landsat 7 spacecraft actually passes over the southernmost continent 16 times a day as it orbits the Earth. During the southern summer months, the instrument takes an average of 300 images per week. This regular acquisition of surface information is what enabled researchers like Bindschadler to keep track of relatively sudden changes to the surface of the Earth.
In fact, by employing a clever strategy of image acquisition and processing, researchers hope to reveal important details about Antarctica following this year's data collection. Previously the spacecraft took images of the surface as it flew towards the pole. But this year marked a change. For the first time, images were taken as the spacecraft moved past the pole--heading away, in other words. What this does in practical terms is offer a different angle on already catalogued features. The change in viewing angle helped expose detail that could not be seen from the other direction.
But there's more. By combining the two angles, experts will not only be able to see things in the ice they've never seen before, but will also be able to infer detail about the land and ice hidden below the surface. This is because surface features on wide stretches of ice tend to reflect the contour, shape, and texture of more durable material underneath. By getting a refined picture of the ice on top, new pictures of the hidden ground underneath suddenly become possible like never before.
View Movie
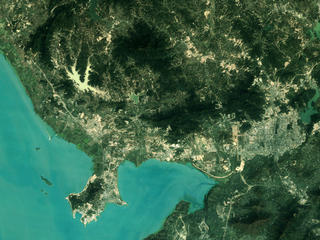
SHENZHEN, CHINA 1988-1996:EXPLOSIVE URBAN GROWTH CHANGES THE SHAPE OF A CONTINENT
True Color Sequence| Shenzhen, China 1988 | Shenzhen, China 1996 |
|---|---|
 |
 |
The People's Republic of China is one of the fastest growing economies in the world. Additionally, much of the Chinese political and cultural landscape is in a state of transition, and economic development is remarkably strong, particularly in southern industrial cities. As seen by Landsat, Shenzen, China practically transforms from a regional urban center to a metropolitan powerhouse in the space of roughly ten years. Notice along the southern peninsula as the actual outline of the land changes, with huge structures emerging in the waters off-shore.
Landsat 5 collected the data. You can see how roads, bridges, and massive construction projects transform the landscape. New structures appear off the southern coast, and highways grow less distinct against the background as significant building spreads along the sides of the roads. Also notice how the massive growth alters lakes and mountains in the area, adding sediment and changing borders.
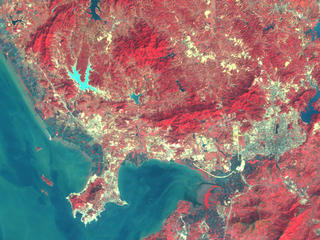
Changes in Vegetation--False Color Sequence
| Shenzhen, China 1988 | Shenzhen, China 1996 |
|---|---|
 |
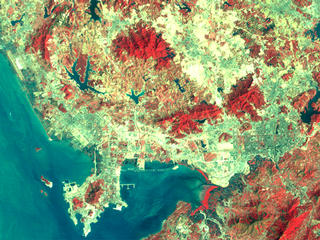 |
As construction goes up, something has to go down. In these images, the same scenes are presented in a way that highlights vegetation concentration. Red indicates density of plant life, and as becomes immediately apparent, vegetation all but disappears across the region over the last ten years. By using data like this, researchers can better understand the causes of environmental changes they find in cities like Shenzhen, and better monitor a region's overall health.
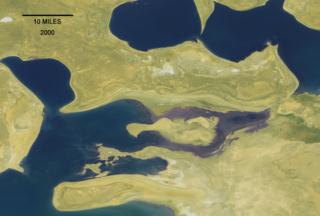
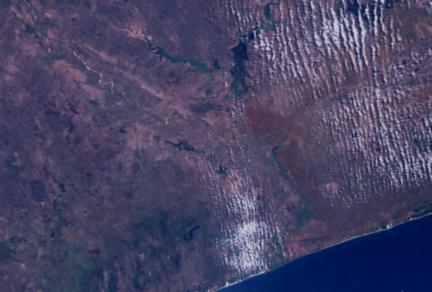
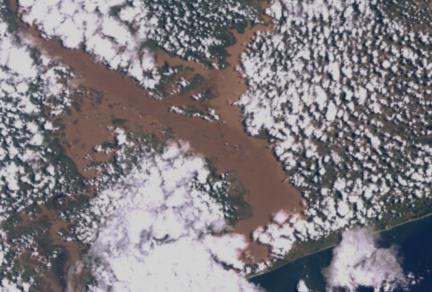
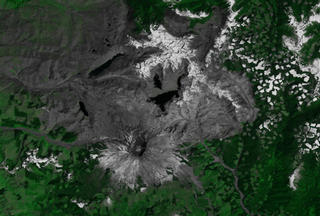
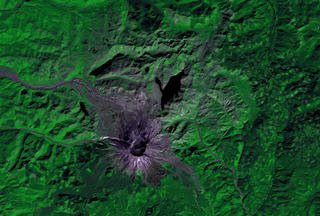
LOSING FORESTS IN BOLIVIA

This scene starts in space, high above South America. As we zoom in closer, we see the national outlines of Bolivia come into view on the map.
By focusing on one particular region, we're able to see effects of deforestation in the equatorial forest. The sequence that follows shows two images of the Santa Cruz region of Bolivia. The first was taken in 1984. Landsat 7 took the second in 2000. In just a few short years, we see how intense agricultural development has transformed the forest.
View Movie
COLORADO MOSAIC
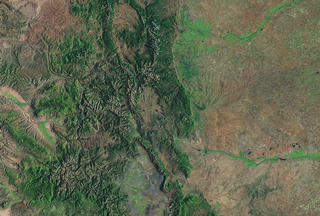
Using the data collected by the versatile Extented Thematic Mapper Plus instrument onboard the Landsat 7 satellite, we can take a tour of Colorado in a way that was impossible just a few years ago.
This virtual fly-over of Colorado is the product of dozens of Landsat scenes digitally stitched together into a single, unified mosaic. We see the state as an unbroken whole, but only after it's been cut into manageable sections, beamed to Earth, stored, retrieved from the Landsat database, assembled, and digitally reprocessed.
View Movie
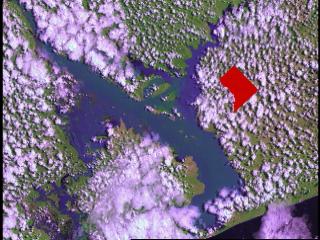
TREES FALLING:MAPPING DEFORESTATION IN RONDONIA, BRAZIL

Throughout much of the 1980s, deforestation in Brazil eliminated more than 15,000 square kilometers (9000 square miles) per year. That pace has only increased through the 90s and into the 21st century.
Brazil is also home to more than a quarter of Earth's tropical forests. Considering that the band of lush green that circles the globe through many equatorial nations is fundamental to the overall health of the whole planet's environment, careful monitoring of forest health in the tropics is essential. Tropical forests act as major carbon "sinks", places where ambient carbon dioxide in the atmosphere can be absorbed by growing things and sequestered for years. Definitive evidence shows that excess carbon dioxide can contribute to the greenhouse effect and speed global warming. Similarly, tropical forests also act as a primary producer of oxygen. In the respiration process that absorbs gaseous carbon dioxide, trees and other plants give off oxygen. It is for these and a host of other reasons why scientists and policy makers need to monitor and forestall wholesale deforestation.
This sequence shows how profligate clear cutting can influence that trust. Data gathered over time by several in the Landsat series of spacecraft shows enormous tracts of forest disappearing in Rondonia, Brazil. This territory underwent an enormous rise in population towards the end of the twentieth century, buoyed by cheap land offered by the national government for agricultural use. As you see the visualization progress, it's useful to note how the human phenomenon of deforestation generally works, especially in the dense tropical forests of Brazil. Systematic cutting of a road opens new territory to potential deforestation by penetrating into new areas. Clearing of vegetation along the sides of those roads tends to fan out to create a pattern akin to a fish skeleton. As new paths appear in the woods, new areas become vulnerable. The spaces between the "skeletal bones" fall to defoliation, and another inch of the Earth's biological rudder is no longer reliably steering the planet into the future.
View Movie
Click Here for Page Three
Portions of this multimedia presentation includes material from Space Imaging L.P.
For further information about Landsat, Terra, EO-1, remote sensing, Earth science conducted by NASA and its partners, or related topics, check out the following web sites:
- The Landsat Gateway
- Terra: The EOS Flagship
- Earth Observing-1 Homepage
- Formation Flying
- NASA's Earth Observing System
- EOS Data and Information System (EOSDIS
- NASA's New Millennium Program
- The Remote Sensing Tutorial
- The United States Geological Survey
- The Goddard Space Flight Center
This multimedia project is the work of a dedicated team of researchers, animators, and media specialists. A companion video to this web site is available from NASA-TV. Below are a list of agencies, departments, and researchers who provided expertise and data for this production:
NOTE: All SeaWiFs images and data presented on this website are for research and educational use only. All commercial use of SeaWiFs data must be coordinated with ORBIMAGE.
Please give credit for these images to:
NASA - Goddard Space Flight Center
Scientific Visualization Studio
Television Production NASA-TV/GSFC
The SeaWiFs Project and ORBIMAGE
Content Preparation and Project Production: Michael Starobin
Last Revised: February 4, 2019 at 06:02 PM EST