|
|
||
 |
 |
 |
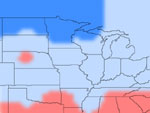
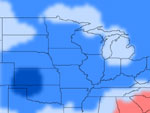
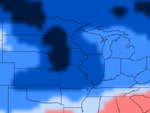
| Year 2020 | Year 2050 | Year 2080 |
| Images 4, 5, and 6 | ||
These images show projections of rainfall changes from a NASA global climate model for the 2020s, 2050s and 2080s. The model is more aggressive than the previous page includes influences from higher population and related green house gas emissions growth rate.
Credit: NASA/Goddard Space Flight Center Scientific Visualization Studio.