Aura Video Resources
Table of Contents
May 17, 2004 - (date of web publication)
NASA's Aura: A Mission to Understand and Protect the Air We Breathe
NASA's Earth-observing satellite, Aura, will supply the most complete information yet on the health of Earth's atmosphere, once it is launched in spring 2004. This satellite will help scientists understand the causes behind worsening global air quality, our rapidly changing climate, and track the predicted recovery of the ozone layer.
Item 1
To view animation click
here.
To view image in higher resolution click
here.
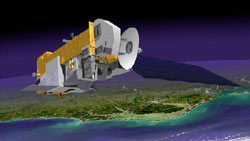
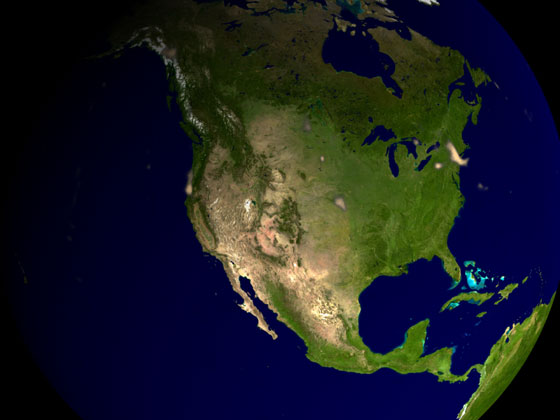
With the launch of the Aura spacecraft NASA's Earth Science Enterprise gains a powerful suite of tools. Flying at an altitude of 438 miles (705 km), the vehicle carries four advanced instruments designed to study various Earth processes. As part of the mission design, these instruments are specifically tailored to work together as well as separately to study atmospheric chemistry. Aura's measurements will be combined with other satellite missions to study the interaction of climate and chemistry.
Grand Chemistry Laboratory in Space
To view animation click
here.
Aura will provide an unprecedented and complete picture of the chemistry of the atmosphere, from the troposphere, where we live, through the stratosphere, where most of the ozone resides. This satellite will help scientists understand how our climate is affected by changes in the atmosphere, what are the processes controlling air quality, as well as track whether our ozone layer is recovering as predicted.
Note: Animation is 45.5 MB
To view animation, click
here.
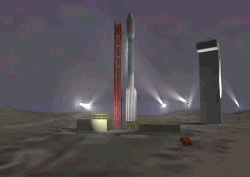
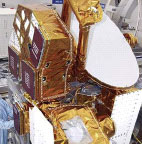
The Aura spacecraft will launch on a Delta II 7920 rocket from Vandenberg Air Force Base in California into a near polar, sun synchronous orbit of 438 mi (705 km). Aura repeats its ground track every 16 days. The space craft was built by Northrop Grumman Space Technology.
AURA SCIENCE OBJECTIVE 1 - Ozone
To view animation, click
here.
The stratospheric ozone layer shields life on Earth from harmful solar ultraviolet (UV) radiation. Research shows that excess exposure to UV radiation causes skin cancer and eye problems, and impacts plant growth. Global stratospheric ozone has decreased by 3 percent globally between 1980 and 2000 and has thinned by 50 percent over Antarctica in winter and spring. Depletion of the ozone layer allows more UV radiation to reach the Earth's surface. This animation shows the ozone layer blocking harmful UV radiation from the Earth's surface.
To view animation, click
here.
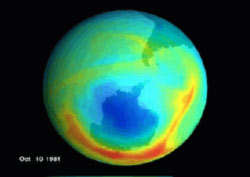
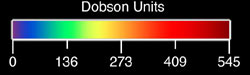
Continuous measurements of ozone levels in the stratosphere are crucial for determining how much ozone loss is attributable to human activities and how much is the result of natural atmospheric processes. Satellite observations of the ozone layer began in the 1970s. In 1985 scientists discovered deep ozone depletion over Antarctica. Known as the 'ozone hole', it grew larger throughout the late 1980's and early 1990's, as shown in this time series of maximum areas from 1979 to 2003 (excluding 1995). While the manufacture and use of ozone destroying chemicals have decreased, the chemicals will linger in the atmosphere for decades before the ozone layer will recover. Also increases in greenhouse gases can cool the stratosphere and delay stratospheric ozone recovery. Data comes from NASA's Total Ozone Mapping Spectrometer (TOMS) on the Earth Probe satellite.
|
|
|
Please note, ozone losses are in blue. |
||
|
Winter of 1997
View animation here. |
Winter of 2000
View animation here. |
Winter of 2003
View animation here. |
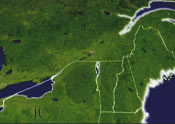
While the Antarctic regularly experiences ozone losses, circulation differences and warmer temperatures in the Arctic prevent similar low ozone levels. However, large Arctic ozone losses have occurred, theses depletions increased harmful doses of ultraviolet radiation in the more populated Northern Hemisphere. Here we show the winters of 1997, 2000, and 2003, particularly severe losses stretching over populated areas such as Northern Europe. Although with greater variability. Data from TOMS-EP.
To view animation, click
here.
Intense ultraviolet (UV) radiation in the upper atmosphere produces ozone (O3). The radiation breaks typical oxygen molecules (O2) into free oxygen atoms (O). A free oxygen atom (O) can join with an oxygen molecule (O2) to form a molecule of ozone (O3). Ozone absorbs UV, shielding the Earth from these harmful rays. Chemical reactions involving gases such as chlorine, bromine, nitrogen, and hydrogen destroy ozone. The ozone depletion over Antarctica results from the combined actions of very cold conditions, the return of sunlight in the Antarctic spring, and ozone depleting chemicals, which mostly come from human-produced compounds.
To view animation, click
here.
Ozone is about location, location, location. While ozone in the stratosphere is really good at blocking harmful ultraviolet radiation, you wouldn't want to breathe it. Ozone in the lower atmosphere, while much less concentrated, is a pollutant that degrades the quality of the air we breathe. Industry and cars generate ozone in the lower atmosphere, particularly in and near cities.
AURA SCIENCE OBJECTIVE II - Air Quality
Aura will observe the chemical composition of the Earth's air and how it varies over time to better understand air quality issues and protect public health and ecosystems.
- Forecasting Severe Pollution Events
- Asian Brown Cloud
- Haze over the United States
- Long Range Pollution Transport
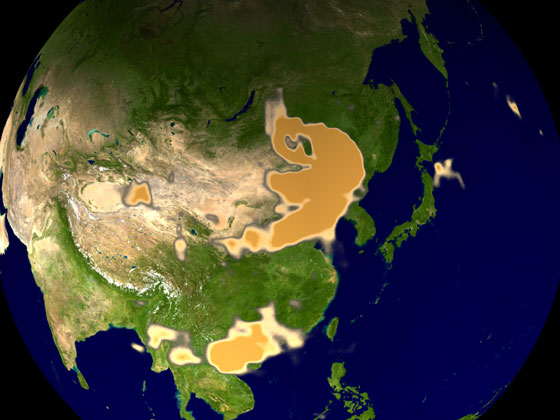
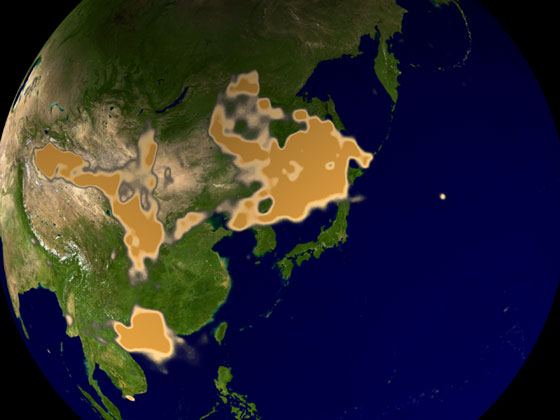
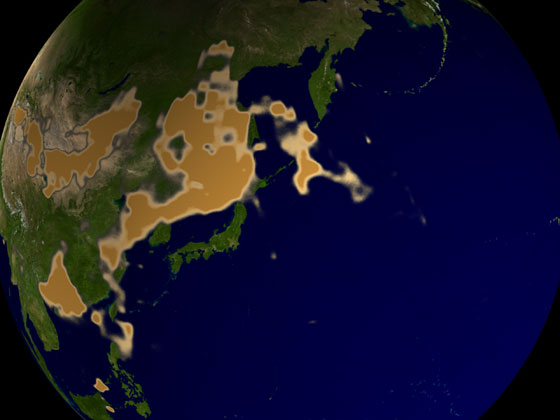
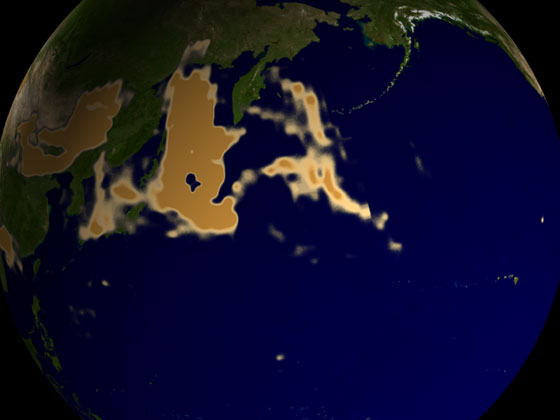
- Dust From China to The United States
- California Smoke Trail
- Carbon monoxide moves around the World
FORECASTING SEVERE POLLUTION EVENTS
The atmosphere has no political boundaries; air pollution moves great distances across oceans and continents. The quality of air has degraded over certain parts of the world and has become a health issue. Aura's instruments will provide global monitoring of air pollution on a daily basis. Aura will provide data to improve inventories of industrial emissions, and also help distinguish between industrial and natural pollution sources. Additionally, the satellite will help improve air quality forecast models.
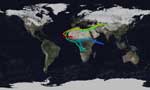
- Asian Brown Cloud, January 11, 2002 as see by NASA's Sea Viewing Wide Field of Sensor (SeaWiFS) on board the Orbview II satellite.
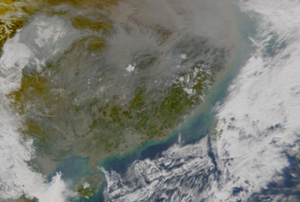
Asian Brown Cloud, January 11, 2002 as see by NASA's Sea Viewing Wide Field of Sensor (SeaWiFS) on board the Orbview II satellite.
To view animation, click
here.
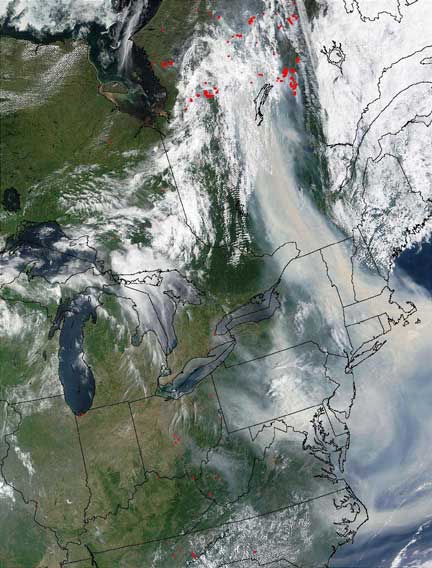
Haze over the United States from Canadian Fires, Terra MODIS, July 7, 2002
To view high resolution image, click here.
LONG RANGE POLLUTION TRANSPORT
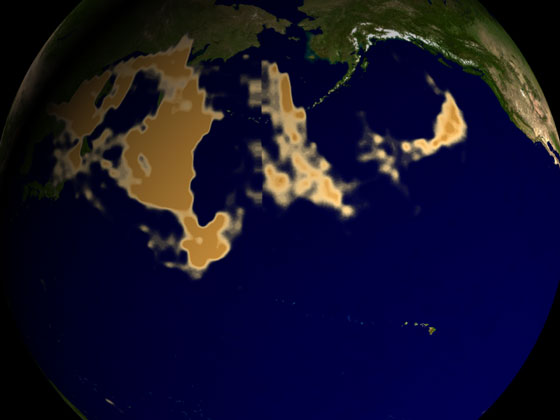
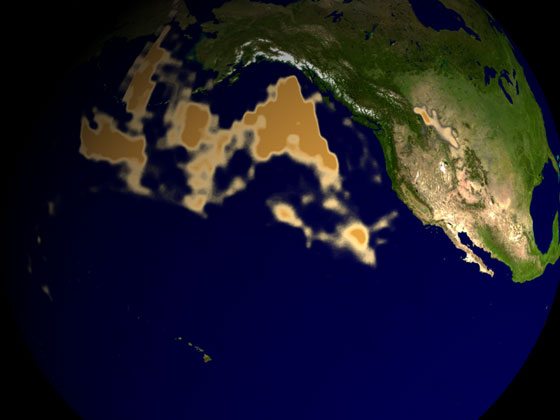
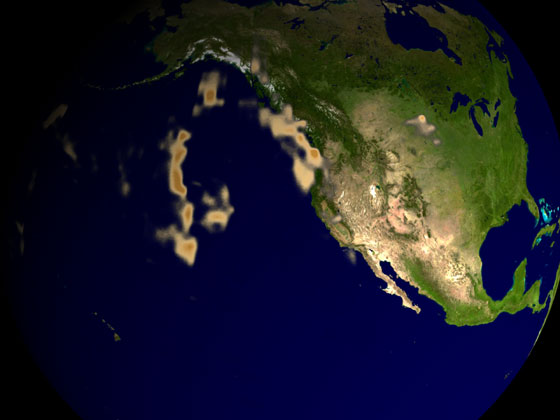
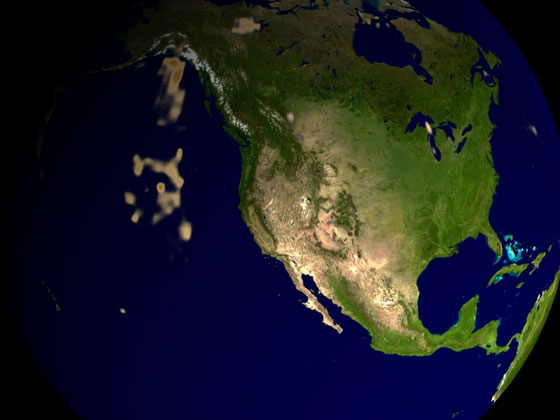
For local governments struggling to meet national air quality standards, knowing more about the sources and transport of pollution has become an important issue. Most pollution sources are local but satellite observations show that winds can carry pollutants great distances. During spring 2001, TOMS watched a huge dust storm travel halfway around the world from China to the United States. Aura will be able distinguish between locally produced pollution and pollution that is brought by transport.
|
|
|
|
|
|
| April 7, 2001 | April 8, 2003 | April 9, 2001 | April 10, 2001 | April 11, 2001 | |

|
|
|
|
|
|
| April 12, 2001 | April 13, 2001 | April 14, 2001 | April 15, 2001 | April 16, 2001 | April 17, 2001 |
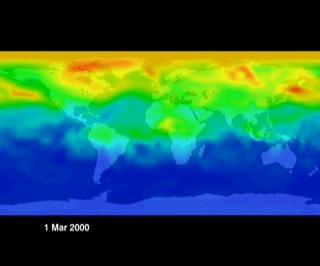
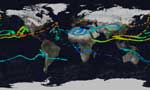
Visualization from model data of carbon monoxide moving around the world. To view animation, click here.
Aura's instruments are designed to study tropospheric chemistry and will provide global monitoring of air pollution on a daily basis. The troposphere is the lowest layer of the atmosphere. Biomass burning, inefficient coal combustion, industrial activities, cars and truck all contribute to poor air quality. They all produce tropospheric ozone and ozone precursors. Ozone precursors are pollutant gases that react in the troposphere to produce ozone. This sequence combines model and satellite to show how carbon monoxide, an ozone precursor, moves around the world. In addition to carbon monoxide, Aura will monitor nitrogen oxides, methane, and other hydrocarbons, all ozone precursors.
AURA SCIENCE OBJECTIVE III - Climate
The Earth's Climate is affected by changes in our life-sustaining atmosphere.
- Water Vapor and Climate Change
- Haze over the United States
- Volcanic Gas
- Volcanic Plume Spreads
- Aerosols Absorb, Aerosols Reflect
Water Vapor and Climate Change
To view animation, click here.
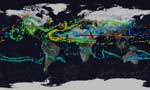
Water vapor is an important greenhouse gas. Some measurements suggest that water vapor is increasing in the stratosphere. This increase may be due to changes in the transport of air between the upper and lower atmosphere caused by climate change or it could be changes in the microphysical processes within tropical clouds. Aura's water vapor measurements combined with data from other satellites will help provide a more complete picture of climate change. By applying integrated analytic tools to the study of climate, experts hope to learn more specifically how water vapor and other greenhouse gasses move and function throughout the atmosphere. This GOES satellite animations shows water vapor moving around the Earth.
Stills from animation of haze over the United States from Canadian Fires, Terra MODIS July 7, 2002.
To view animation, click
here.
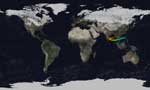
Smoke from multiple large wildfires in Canada blanketed the Great Lakes and eastern United States. The enormous smoke plume was almost 200 miles wide. The thick pall affected air quality from New York, to Baltimore, and Washington, D.C. and blocked the sunlight cooling the East Coast. The first image was taken by the Moderate Resolution Imaging Spectroradiometer (MODIS) on the Terra satellite on July 7, 2002. The second image comes from NASA's Total Ozone Mapping Spectrometer (TOMS) on the Earth Probe satellite. Highest aerosol concentration is in red. Aura will measure both light absorbing and reflecting aerosols in the lower atmosphere. These properties are important for understanding aerosol effects on weather and climate.
To view animation, click
here.
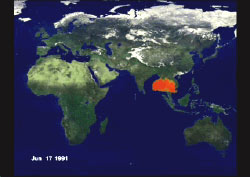
When Mt. Pinatubo erupted on June 15, 1991, it was the largest volcanic event in nearly a century with global consequences. Global average temperatures were one degree (F) cooler for over a year due to the massive injection of dust and gases into the upper atmosphere that reflected sunlight. Stratospheric aerosols increased by over 20 times. In addition, the protective ozone layer in the upper atmosphere weakened for more than a year from the gases injected into the stratosphere. The eruption marked one of the largest climatic events to be observed by a fleet of spacecraft, creating one of science's greatest lab experiments. Aura will help scientists observe the daily global distribution of aerosols. Poor knowledge of the global distribution of aerosols contributes to a large uncertainty in climate prediction.
|
|
|
| Shows atmostphere that carries the ozone | Shows atmostphere that carries the ozone (with height indicator) | Shows atmostphere that carries the ozone (with height indicator and dates) |
 Click on each image to view corresponding visualization.
Chemicals and transport process have led to changes in the stratospheric ozone. Scientists need measurements of many different chemical species to puzzle out the observed changes. Aura data will improve our capability to predict ozone changes and help untangle the roles of transport and chemistry in determining ozone trends. This sequence starts with the actual size of our thin fragile part of our atmosphere that carries ozone. Then, the atmosphere is magnified. Inside, is a dynamic and active system of chemicals that moves ozone throughout our atmosphere.
Click on image to view animation.
Our atmosphere is a very dynamic and fluid system. Scientists want to learn more about how chemicals move between the layers of the atmosphere. Aura's instruments will take detailed measurements of the transition layer between the troposphere and stratosphere called tropopause. Storms, volcanic eruptions and pollution can push particles up to the stratosphere. Large storms systems can also pull stratospheric ozone into the lower atmosphere.
FLIGHT HARDWARE: AURA'S LAB EQUIPMENT
- Ozone Monitoring Instrument (OMI)
- Microwave Limb Sounder (MLS)
- High Resolution Dynamics Limb Sounder (HIRDLS)
- Tropospheric Emission Spectrometer (TES)
Ozone Monitoring Instrument (OMI)
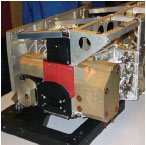
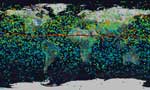
Ozone Monitoring Instrument (OMI) is the key instrument for monitoring recovery of the stratospheric ozone layer. OMI will measure both ultraviolet and visible radiation and will provide daily high resolution global maps and profiles of ozone. OMI has a viewing swath of about 2600 kilometers, which allows complete daily coverage of the globe. OMI’s predecessor, the Total Ozone Mapping Spectrometer (TOMS), could measure major aerosol producing events, such as large wildfires, ash from major volcanic eruptions, and large dust storms. OMI will also be able to map four of the US Environmental Protection Agency’s six pollutants of primary concern for air quality and track aerosols near the Earth’s surface.
The Microwave Limb Sounder (MLS) instrument will focus on Earth’s upper troposphere and stratosphere, measuring microwave radiation emitted by ozone, chlorine compounds and many other traces gases. This instrument will watch how water vapor and ozone destructing compounds like chlorine and bromine pass between the troposphere and stratosphere. Because MLS is a microwave sensor, it will be able to measure trace gases inside of clouds.
High Resolution Dynamics Limb Sounder (HIRDLS)
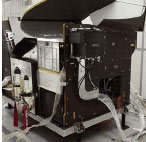
The High Resolution Dynamics Limb Sounder (HIRDLS) will retrieve ozone profiles with the highest vertical resolution ever achieved from space. HIRDLS ozone measurements provide detailed spatial information on the lower stratosphere, where the largest ozone depletion has occurred.
Tropospheric Emission Spectrometer (TES)
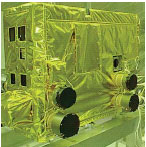
TES observes the natural thermal emission of the Earth’s surface, the atmosphere, and reflected sunlight, thereby providing day-night coverage of the atmosphere everywhere on the globe. TES will make the first direct global measurements of ozone in the lower atmosphere. TES will also measure nitrates, water vapor and tropospheric ozone precursors like carbon monoxide. TES will provide data to atmospheric chemistry prediction models and help to distinguish between man made and natural impacts on air quality.
- Teamwork -Aura's Synergy
- NASA's Earth Observing Fleet
Aura will carry four instruments each designed to survey different aspects of
Earth's atmosphere. Working in synergy, they will provide an unprecedented and
complete picture of the chemistry of the atmosphere. Aura's space-based view of
the atmosphere and its chemistry will complete the global data already being collected
by NASA’s Earth Observing System (EOS) satellites, including Terra which
monitors land, and Aqua, observing Earth's water cycle.
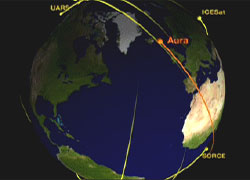
Taking the A-Train (Formation Flying)
Click image to view animation.
The name "A-Train" comes from a planned sequence of satellites on orbit, starting with Aqua and ending with Aura. These two, and the three or more that will separate them are all part of a spacecraft convoy, each part of the growing fleet of Earth watching satellites that compose the Earth Observing System. Some of the benefits of flying satellites in formation come in the area of risk management. In the future, formations of less expensive, less complex satellites means that a single instrument failure does not necessarily cause harm to an overall mission.
Click image to view animation.
Aura will join a powerful and diverse fleet of satellites. NASA's Earth Observing fleet of vehicles constitutes a major milestone in the history of Earth science, facilitating all kinds of wide scale and synergistic research endeavors that until the last decade have been impossible to even consider.