IMPACT OF WESTERN U.S. DROUGHT VISIBLE FROM SPACE
July 3, 2002 - (date of web publication)
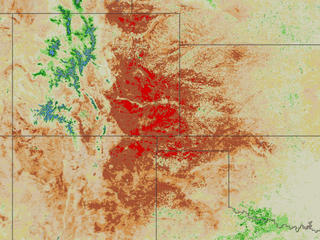
Colorado and Oklahoma
The drought plaguing the western U.S. is so intense, that its impacts on vegetation can easily be seen from space. New satellite-derived images of vegetation confirm extremely dry conditions exist that are ripe for fires in the western United States, according to a data collaboration between NASA and the USDA Foreign Agricultural Service. Images created from France's SPOT satellite show the health of vegetation as severely weakened indicating very dry conditions over large areas of the western U.S.
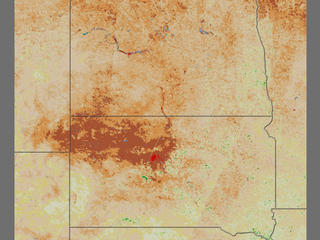
The images for May show the most severely dessicated regions to be over the western Great Plains, especially southeastern Colorado near the Texas/Oklahoma panhandle region. The data show severely dry conditions over the U.S. Southwest, and northward over the Dakotas and Montana, reaching all the way up into Canada. There is a strong correlation between the rainfall amount and vegetation "greenness" particularly for semi-arid regions. Severe and persistent below normal vegetation greenness over these regions implies drought.
Dry vegetation conditions associated with drought, shown in the images as brown and red colors, also imply a higher than normal risk of fire danger for these regions where the lushness of vegetation appears depressed.
A New Way to View Vegetation
|
|
|
|
|
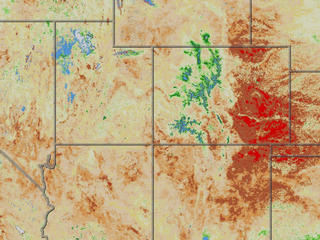
Four Corners of Utah, Colorado, Arzonia and New Mexico |
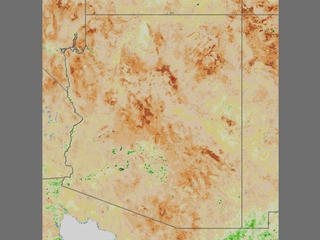
Arizona | North and South Dakota |
The product that generated these images is the Normalized Difference Vegetation Index (NDVI), which measures the health of plant life based on their levels of photosynthesis. The NDVI was developed by Compton Tucker, a senior scientist at NASA/Goddard. Several satellites now contribute remote sensing data to the NDVI by reading light reflected back from the Earth in different bands of the spectrum.
Normally, plants absorb visible red wavelengths of light (from the Sun) when they are healthy. When they are unhealthy, such as when they are stressed from drought conditions, they absorb less red light. The NDVI index measures the red light that the plants reflect. More red light than average is indicative of unhealthy plants, likely due to drought or heat stress.
The color scale for the images indicates how much the lushness of vegetation has changed from what is calculated as the average or normal state over the last 3 years. For example, the range of normal conditions (+/-5%) on the scale is indicated by a pale yellow-white color. Above normal greenness or more lush plant life is indicated by green colors.
Negative changes are indicated by yellow, beige, brown and red colors on the scale, with red being the most extreme Red areas suggest drought conditions and represent vegetation that is 60% less healthy than normal. In addition to rainfall shortages, summertime heat also causes the vegetation to become stressed and reduces its photosynthetic activity.
The NDVI data created from a SPOT vegetation sensor aboard the French SPOT-4 satellite provides a closer look at the details of the land than previous satellites. The SPOT-4 provides a resolution of 1km (6/10ths of a mile).
The SPOT based NDVI images are currently prototype products. The NDVI provides a look at how land surfaces and vegetation respond to climatic conditions and provides land resource managers with another tool to measure drought and fire hazard conditions.
High Resolution Images
Colorado and Oklahoma
Four Corners
North and South Dakota
Arizona