Previous Tape
Next Tape
Goddard TV Video Tape: G2008-034HD -- NASAs HD Chesapeake Bay Resource Tape
Movie
Title
NASA Satellites Aid in Chesapeake Bay Recovery
Chesapeake Bay Cities
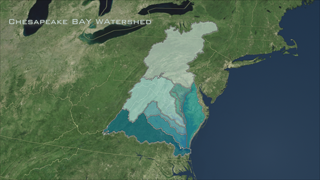
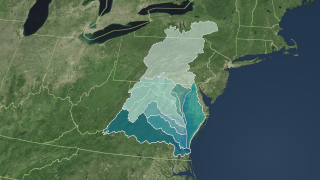
Chesapeake Bay Watershed Region (short version)
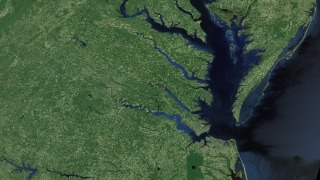
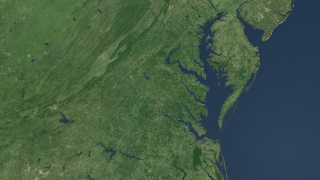
Chesapeake Bay Landsat-7 Mosaic
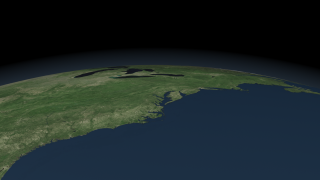
Chesapeake Bay Flyover and Watershed Region
Chesapeake Bay Flyover
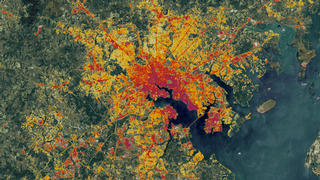
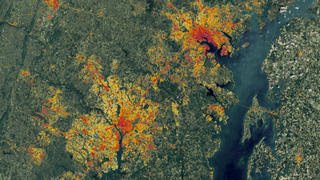
Impervious Data of the Baltimore Area
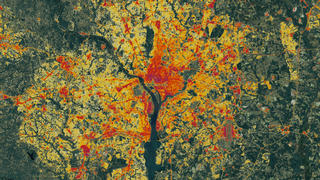
Impervious Data of the Washington, DC Area
Impervious Data of the Washington, DC and Baltimore, Maryland Area
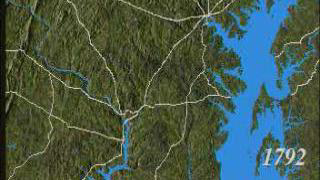
Baltimore - Washington: 200 Years of Urban Growth