Next Tape
Goddard TV Video Tape: G1997-045
Movie
Title
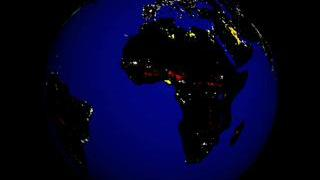
HoloGlobe: Earth at Night
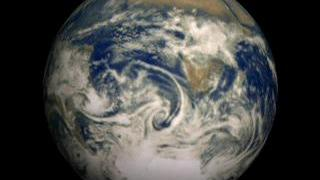
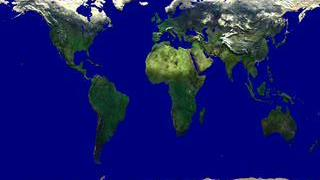
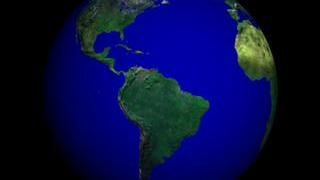
HoloGlobe: Galileo Earth
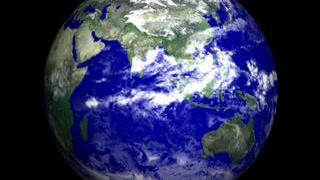
HoloGlobe: Cloud Dynamics over the Eastern Hemisphere
HoloGlobe: Countries in the GLOBE Program as of April 1997
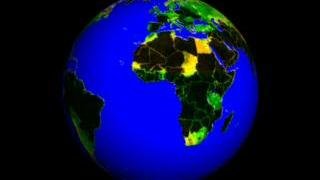
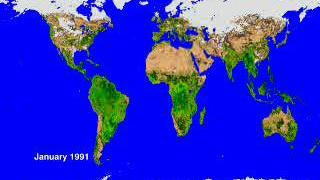
HoloGlobe: Vegetation Index for 1991 on a Flat Earth (with Dates)
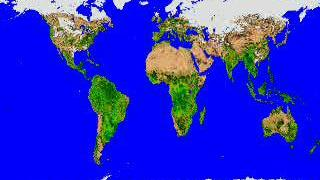
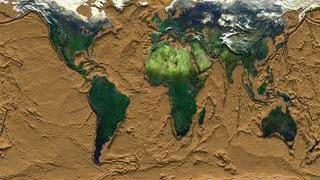
HoloGlobe: Vegetation Index for 1991 on a Flat Earth
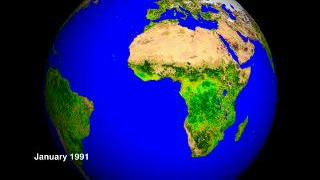
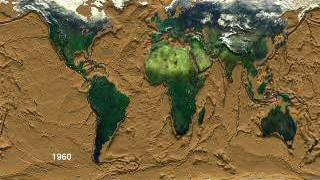
HoloGlobe: Vegetation Index for 1991 on a Globe (with Dates)
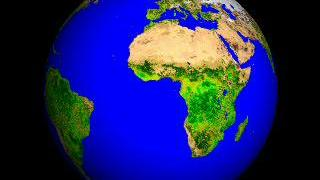
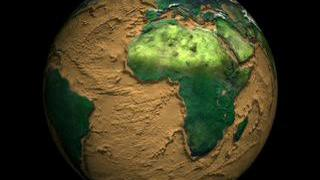
HoloGlobe: Vegetation Index for 1991 on a Globe
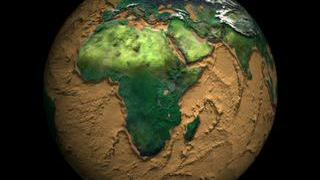
HoloGlobe: Topography and Bathymetry on a Globe
HoloGlobe: Filling the Global Oceans
HoloGlobe: Filling the Atlantic Ocean
HoloGlobe: Draining the Global Oceans
HoloGlobe: Draining the Pacific Ocean
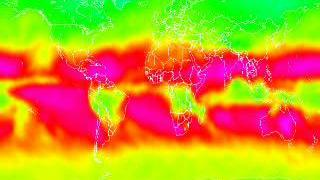
HoloGlobe: Outgoing Longwave Radiation for 1988 on a Flat Earth (with Dates)
HoloGlobe: Outgoing Longwave Radiation for 1988 on a Flat Earth
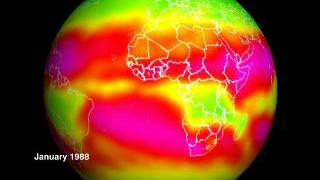
HoloGlobe: Outgoing Longwave Radiation for 1988 on a Globe (with Dates)
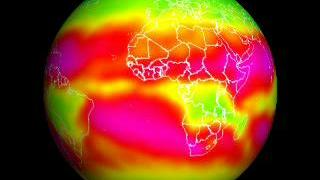
HoloGlobe: Outgoing Longwave Radiation for 1988 on a Globe
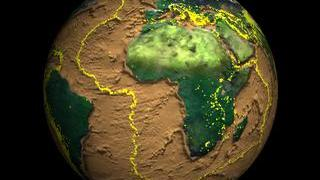
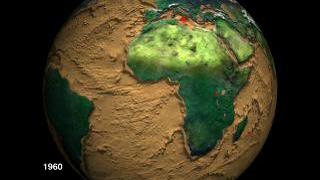
HoloGlobe: Cumulative Earthquake Activity from 1960 through 1995 on a Globe (with Dates)
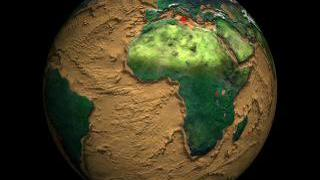
HoloGlobe: Cumulative Earthquake Activity from 1960 through 1995 on a Globe
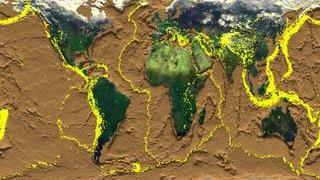
HoloGlobe: Cumulative Earthquake Activity from 1960 through 1995 on a Flat Earth (with Dates)
HoloGlobe: Cumulative Earthquake Activity from 1960 through 1995 on a Flat Earth
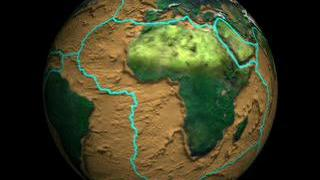
HoloGlobe: Tectonic Plate Boundaries on a Globe
HoloGlobe: Active Volcanoes from 1960 through 1995 on a Flat Earth (with Dates)
HoloGlobe: Active Volcanoes from 1960 through 1995 on a Globe (with Dates)
HoloGlobe: Active Volcanoes from 1960 through 1995 on a Flat Earth
HoloGlobe: Active Volcanoes from 1960 through 1995 on a Globe
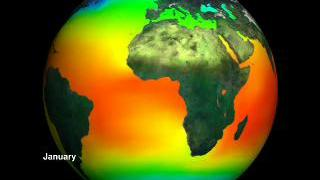
HoloGlobe: Sea Surface Temperature Climatology on a Globe (with Dates)
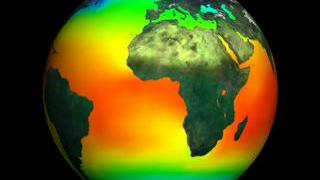
HoloGlobe: Sea Surface Temperature Climatology on a Globe
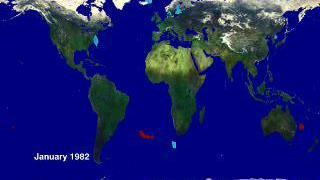
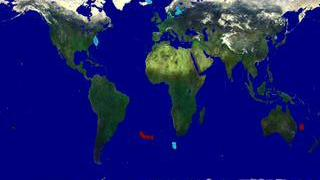
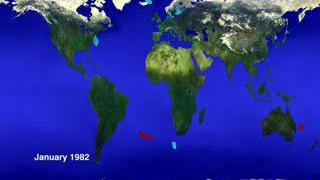
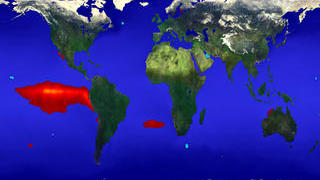
HoloGlobe: Sea Surface Temperature Anomaly on a Flat Earth (with Dates)
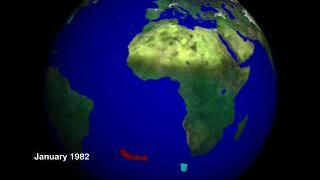
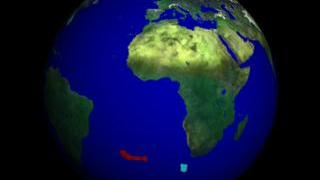
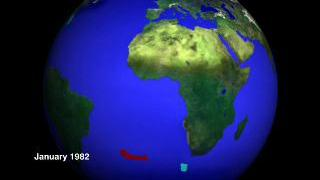
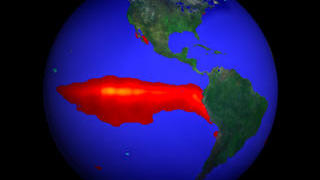
HoloGlobe: Sea Surface Temperature Anomaly on a Globe (with Dates)
HoloGlobe: Sea Surface Temperature Anomaly on a Flat Earth
HoloGlobe: Sea Surface Temperature Anomaly on a Globe
HoloGlobe: Sea Surface Temperature and Temperature Anomaly on a Globe (with Dates)
HoloGlobe: Sea Surface Temperature and Temperature Anomaly on a Flat Earth (with Dates)
HoloGlobe: Sea Surface Temperature and Temperature Anomaly on a Flat Earth
HoloGlobe: Sea Surface Temperature and Temperature Anomaly on a Globe