Superstorm Sandy
Overview
Turbulent, swirling winds traveled from the Caribbean Sea and along the Atlantic Ocean in late October of 2012 to produce one of the most impactful hurricanes on the U.S. East Coast— Hurricane Sandy.
In total, Hurricane Sandy caused 159 deaths and $70 billion in damages. Thousands of people slept at Red Cross operated-shelters and millions were without power during the aftermath. Fires erupted from ruptured natural gas lines meanwhile the torrential rains flooded subway systems. The New York Stock exchange was closed for a consecutive two days—an event that hadn’t occurred since 1888.
For the hurricane’s almost two weeks of activity, NASA satellites documented the storm’s movements and helped researchers anticipate and follow the hurricane’s path. The satellite data provided detailed information such as the size and direction of the winds, observations of the cloud structures near the storm and the amount and location of storm’s rainfall.
The accompanying image gallery shows past satellite imagery and simulations of Hurricane Sandy and the superstorm’s impact on the U.S. East Coast. For more NASA coverage on Hurricane Sandy during 2012, go here.
Visualizations and Presentations
- ID: 30465 Hyperwall Visual
Analyzing Superstorm Sandy
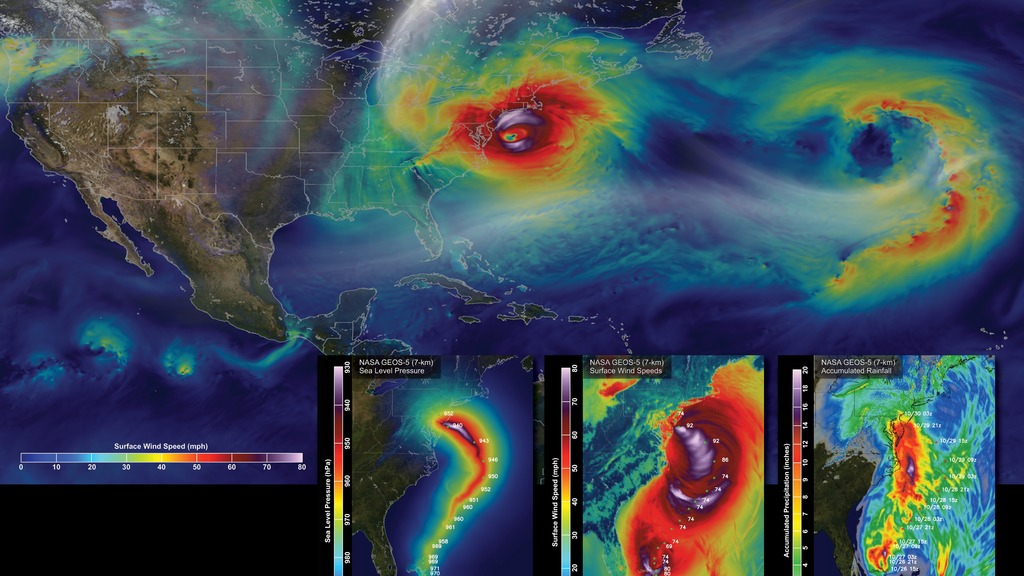
Go to this pageA rare convergence of environmental conditions during Hurricane Sandy’s lifecycle led to a storm of unforgettable destruction—hence its nickname, Superstorm Sandy. Scientists can analyze the structure and lifecycle of severe storms like Sandy using weather prediction models and incorporate what they learn into newer models, which hopefully result in even more accurate hurricane forecasts in the future. Scientists at NASA used the Goddard Earth Observing System Model, Version 5 (GEOS-5) to simulate surface wind speeds across the Atlantic during Sandy’s lifecycle. The large image above shows surface wind speeds on October 29, 2012, as simulated by the GEOS-5 at 7-kilometer (~4.3-mile) resolution just before the storm made landfall near Atlantic City, New Jersey. Wind speeds range from approximately 10 miles per hour (15 kilometers per hour), shown as dark blue, to 80 miles per hour (130 kilometers per hour), shown as very light purple. In the days following landfall, the remnants of Sandy moved inland over Northern New England and Canada before finally dissipating. The three smaller images show how GEOS-5 simulations of sea level pressure [left], surface wind speeds [center], and accumulated rainfall amounts [right] from October 26, 2012 to October 31, 2012, compare to observations from the National Oceanic and Atmospheric Administration’s National Hurricane Center.Used in 2014 Calendar. ||
- ID: 30019 Hyperwall Visual

Hurricane Sandy
Go to this pageSurface and near-surface (850 hPa) wind speeds from the NASA Goddard Earth Observing System Model (GEOS-5) operational assimilation system (consisting of a 50-kilometer analysis coupled with a 25-kilometer model) beginning September 1, 2012 preceding a 7-kilometer global simulation with the GEOS-5 atmospheric model initialized at 09Z on October 26, 2012 reveal the massive size of Hurricane Sandy versus the other storms for this period, including the persistent Hurricane Nadine, as well as hurricanes Michael and Rafael. The 7-kilometer simulation depicts the strong onshore winds in New York and New Jersey even after landfall and the dramatic influence of the land surface slowing down Sandy's inland surface winds. ||
- ID: 30220 Hyperwall Visual
Hurricane Sandy Causes Blackouts in New Jersey and New York
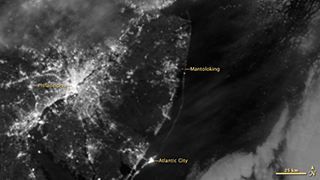
Go to this pageIn the days following landfall of Hurricane Sandy, millions remained without power. This pair of images shows the difference in city lighting across New Jersey and New York before (August 31, 2012), when conditions were normal, and after (November 1, 2012) the storm. Both images were captured by the Visible Infrared Imaging Radiometer Suite (VIIRS) “day-night band” onboard the Suomi National Polar-orbiting Partnership satellite, which detects light in a range of wavelengths and uses filtering techniques to observe signals such as gas flares, city lights, and reflected moonlight.In Manhattan, the lower third of the island is dark on November 1, while Rockaway Beach, much of Long Island, and nearly all of central New Jersey are significantly dimmer. The barrier islands along the New Jersey coast, which are heavily developed with tourist businesses and year-round residents, are just barely visible in moonlight after the blackout. ||
- ID: 30178 Hyperwall Visual
A Changed Coastline in New Jersey
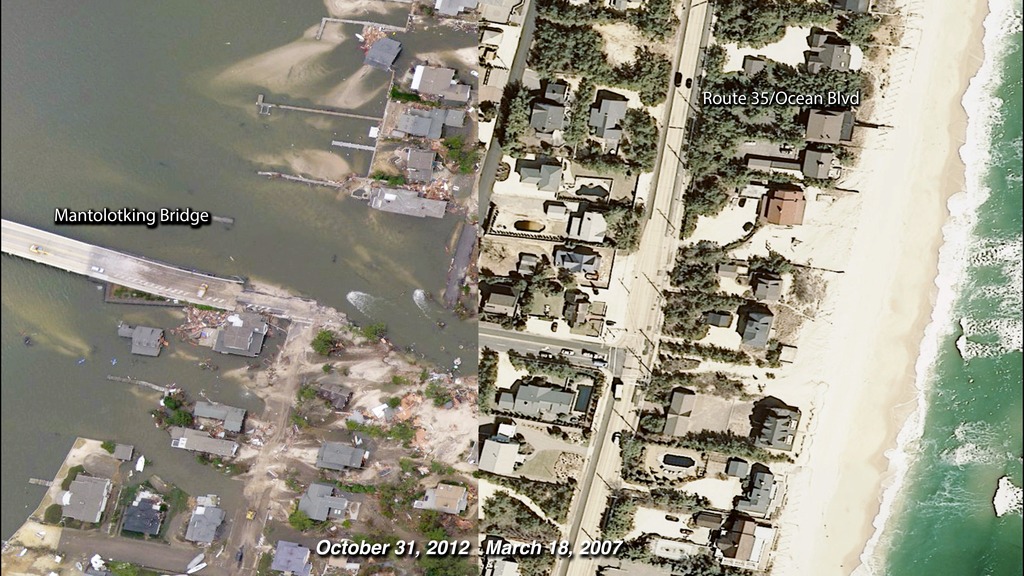
Go to this pageOn October 29, 2012, Superstorm Sandy changed the lives of many living along the U.S. East Coast—especially along the shorelines of New Jersey, New York, and Connecticut. At landfall, heavy rains pelted states as far inland as Wisconsin and surging seawater washed away beaches and flooded streets, businesses, and homes. These two images show a portion of the New Jersey coastal town of Mantolokig, just north of where the storm made landfall, before (March 18, 2007) and after (October 31, 2012) the storm. On the barrier island, entire blocks of houses along Route 35 (also called Ocean Boulevard) were damaged or completely washed away by the storm surge and wind. Fires raged in the town from natural gas lines that had ruptured and ignited. A new inlet was cut across the island, connected the Atlantic Ocean and the Jones Tide Pond. ||
- ID: 11715 Produced Video
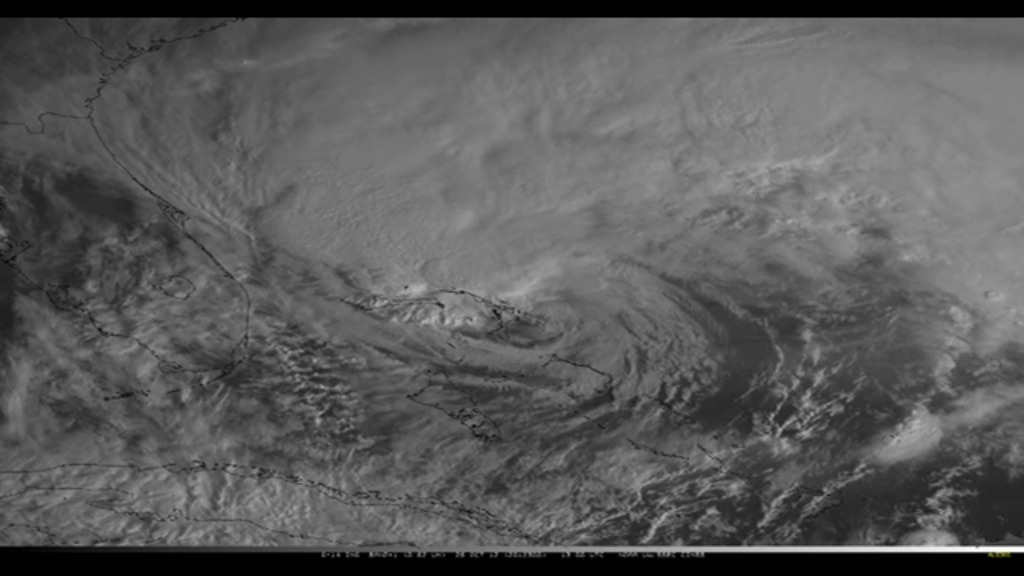
GOES-14 Scans Superstorm Sandy
Go to this pageCredit: NOAA || Sandy_Movie_GOES_R_nasaportal_print.jpg (1024x576) [91.8 KB] || Sandy_Movie_GOES_R_nasaportal_searchweb.png (320x180) [51.5 KB] || Sandy_Movie_GOES_R_nasaportal_web.png (320x180) [51.5 KB] || Sandy_Movie_GOES_R_nasaportal_thm.png (80x40) [4.3 KB] || Sandy_Movie_GOES_R_720x480.webmhd.webm (960x540) [15.3 MB] || Sandy_Movie_GOES_R_prores.mov (1280x720) [1.1 GB] || Sandy_Movie_GOES_R_youtube_hq.mov (1280x720) [114.7 MB] || Sandy_Movie_GOES_R_1280x720.wmv (1280x720) [37.4 MB] || Sandy_Movie_GOES_R_nasaportal.mov (640x360) [31.1 MB] || Sandy_Movie_GOES_R_ipod_lg.m4v (640x360) [11.7 MB] || Sandy_Movie_GOES_R_720x480.wmv (720x480) [35.0 MB] || Sandy_Movie_GOES_R_ipod_sm.mp4 (320x240) [5.9 MB] ||