Amazon Deforestation Trends
Overview
Visualizations of deforestation in the Brazilian area of the Amazonia biome. Data provided by the MapBiomas.org initiative, primarily based on Landsat data from 1985-2018.
The Amazon has undergone major transformations over the span of the Landsat program (since 1972). Working closely with their Brazilian counterparts, and in cooperation with a number of non-governmental organizations, NASA scientists have helped map the entire country of Brazil to show different kinds of land use for every year going back to 1985. Learn more about how this data is being used: https://svs.gsfc.nasa.gov/13694.
Data Visualizations
- ID: 4826 Visualization
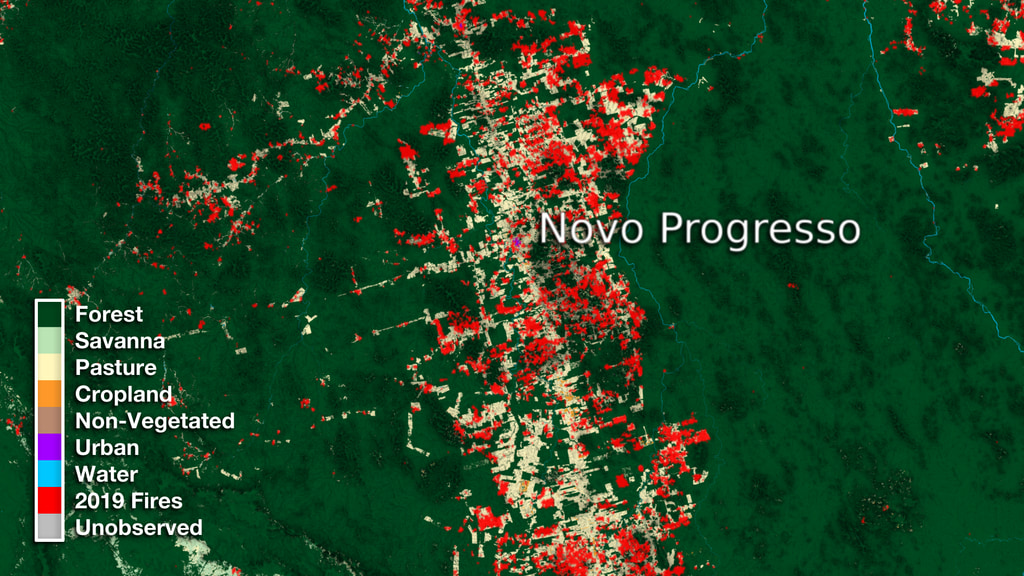
Brazil and Novo Progresso Land Use Data Over Time
Go to this pageThis animation begins by showing the similar sizes between the country of Brazil and the United States. It then cycles through over three decades of classification data for the entire Northern half of Brazil. We then zoom down to the town of Novo Progresso and compare its relative size to the San Francisco Bay region. Next we cycle through over three decades of transformation in the region showing how the north/south corridor of this region changed over time. Lastly, we fade in 2019 fire data to indicate how the data will continue to change into the upcoming year. || novo_progressov_finalcomp.2009_print.jpg (1024x576) [287.1 KB] || novo_progressov_finalcomp.2009_searchweb.png (320x180) [105.7 KB] || novo_progressov_finalcomp.2009_thm.png (80x40) [7.3 KB] || novo_progressov_finalcomp_1080p30.mp4 (1920x1080) [48.9 MB] || frames/1920x1080_16x9_30p/example_composite/ (1920x1080) [128.0 KB] || novo_progressov_finalcomp_1080p30.webm (1920x1080) [7.9 MB] ||
- ID: 4827 Visualization
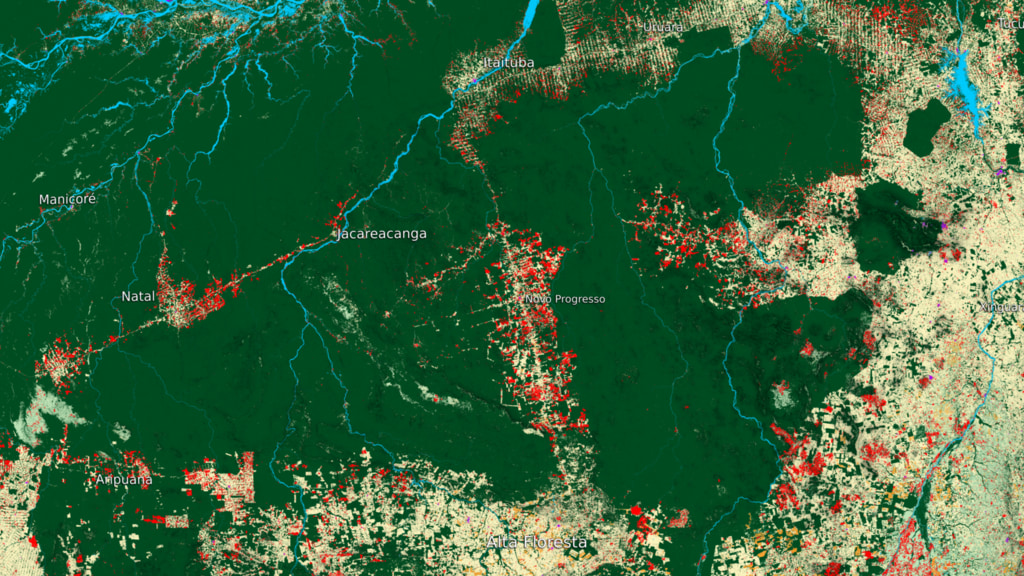
Novo Progresso Surrounding Region Land Use Data Over Time
Go to this pageThis data visualization begins with a wide view of Northern Brazil. It then zooms down to the region surrounding the town of Novo Progresso and compare its relative size to the San Francisco Bay region. Next we cycle through over three decades of transformation in the region showing how the north/south corridor of this area opened up over time. Lastly, we fade in 2019 fire data to indicate how the data will continue to change into the upcoming year. || novo_wide_finalcomp.2009_print.jpg (1024x576) [387.4 KB] || novo_wide_finalcomp.1116_print.jpg (1024x576) [221.0 KB] || novo_wide_finalcomp_1080p30_2.mp4 (1920x1080) [30.2 MB] || novo_wide_finalcomp_1080p30_2.webm (1920x1080) [3.7 MB] || frames/1920x1080_16x9_30p/Example_Composite/ (1920x1080) [64.0 KB] ||
- ID: 4828 Visualization
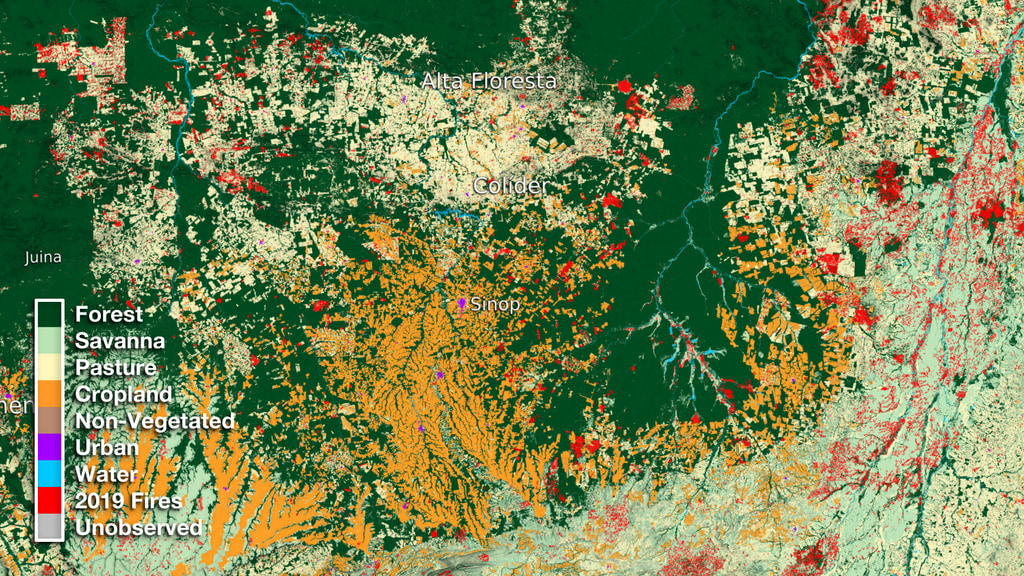
Colider Land Use Data Over Time
Go to this pageThis data visualization begins with a wide view of Northern Brazil. It then zooms down to the region surrounding the town of Colider and compares its relative size to Northern California. Next we cycle through over three decades of land use transformation showing cropland a pasture expansion over time. Lastly, we fade in 2019 fire data to indicate how the data will continue to change into the upcoming year. || colider_finalcomp.2009_print.jpg (1024x576) [548.1 KB] || colider_finalcomp.2009_searchweb.png (320x180) [144.4 KB] || colider_finalcomp.2009_thm.png (80x40) [8.4 KB] || colider_finalcomp_1080p30.mp4 (1920x1080) [40.2 MB] || colider_finalcomp_1080p30.webm (1920x1080) [4.0 MB] || frames/1920x1080_16x9_30p/Example_Composite/ (1920x1080) [64.0 KB] ||
- ID: 4829 Visualization
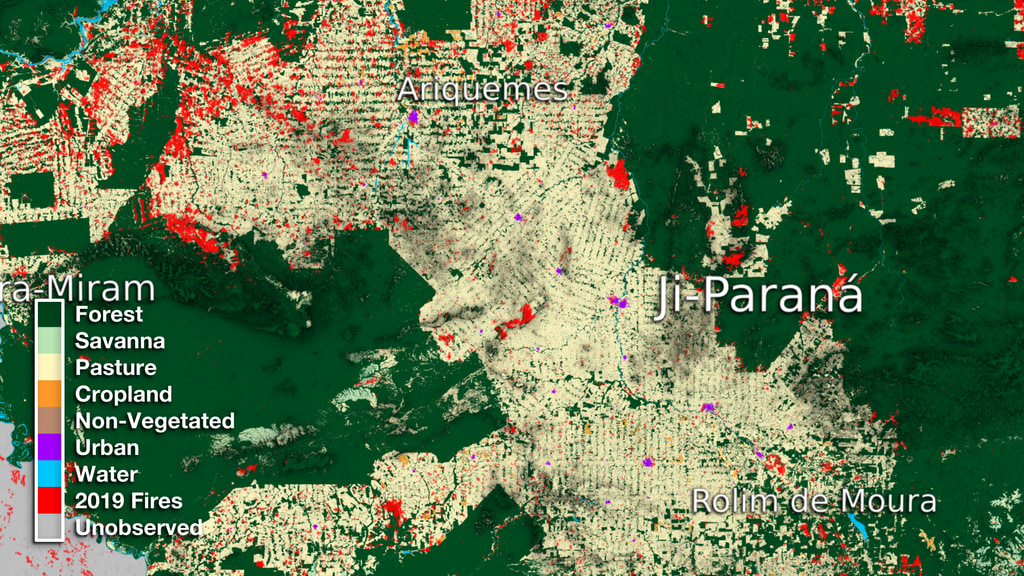
Ji-Paraná Land Use Data Over Time
Go to this pageThis data visualization begins with a wide view of Northern Brazil. It then zooms down to the region surrounding the town of Ji Parana and compares its relative size to the San Francisco Bay area. Next we cycle through over three decades of land use transformation showing cropland a pasture expansion over time. Lastly, we fade in 2019 fire data to indicate how the data will continue to change into the upcoming year. || ji_parana_finalcomp.2009_print.jpg (1024x576) [412.8 KB] || ji_parana_finalcomp.2009_searchweb.png (320x180) [133.8 KB] || ji_parana_finalcomp.2009_thm.png (80x40) [8.2 KB] || ji_parana_finalcomp_1080p30.mp4 (1920x1080) [34.0 MB] || frames/1920x1080_16x9_30p/Example_Composite/ (1920x1080) [64.0 KB] || ji_parana_finalcomp_1080p30.webm (1920x1080) [3.8 MB] ||
- ID: 4830 Visualization
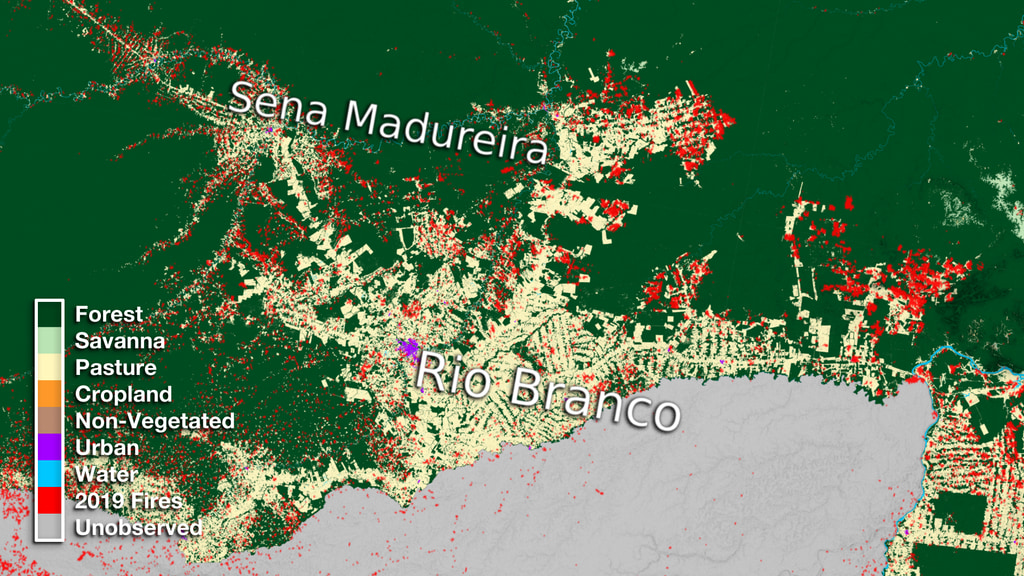
Rio Branco Land Use Data Over Time
Go to this pageThis data visualization begins with a wide view of Northern Brazil. It then zooms down to the region surrounding the town of Rio Branco and compares its relative size to the San Francisco Bay area. Next we cycle through over three decades of land use transformation showing pasture expansion over time. Lastly, we fade in 2019 fire data to indicate how the data will continue to change into the upcoming year. || rio_branco_finalcomp.2009_print.jpg (1024x576) [331.8 KB] || rio_branco_finalcomp.2009_searchweb.png (320x180) [108.8 KB] || rio_branco_finalcomp.2009_thm.png (80x40) [7.4 KB] || rio_branco_finalcomp_1080p30.mp4 (1920x1080) [24.0 MB] || rio_branco_finalcomp_1080p30.webm (1920x1080) [3.4 MB] || frames/1920x1080_16x9_30p/Example_Composite/ (1920x1080) [64.0 KB] ||
- ID: 4831 Visualization
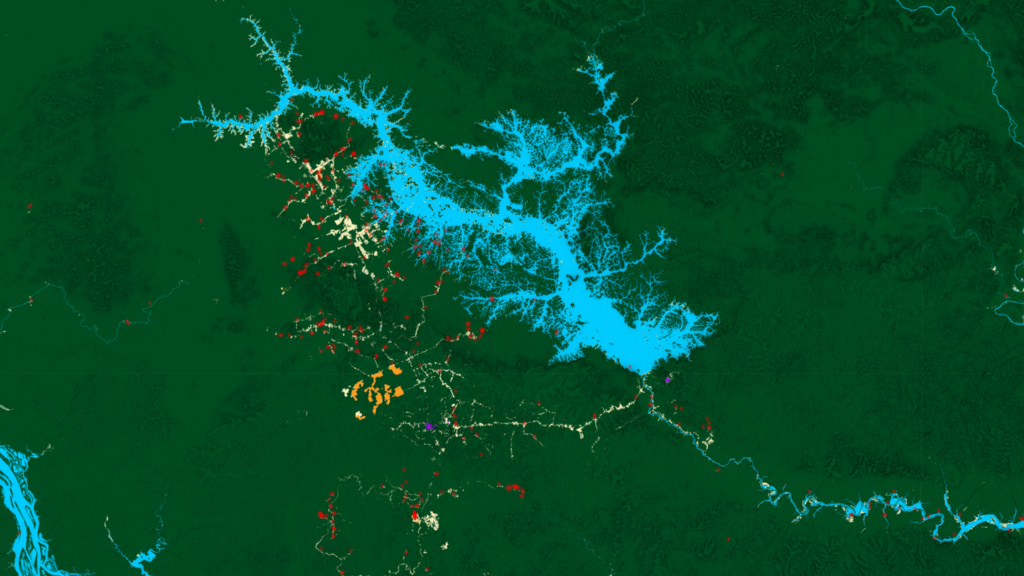
Uatumã Biological Reserve Over Time
Go to this pageThis data visualization begins with a wide view of Northern Brazil. It then zooms down to the Uatumã Biological Reserve and compares its relative size to the San Francisco Bay area. Next we cycle through over three decades of land use transformation to show the lake formation over time as well as the increased pasture and croplands to the west of the lake. Lastly, we fade in 2019 fire data to indicate how the data will continue to change into the upcoming year. || dam_finalcomp.2009_print.jpg (1024x576) [216.7 KB] || dam_finalcomp.2009_searchweb.png (320x180) [80.9 KB] || dam_finalcomp.2009_thm.png (80x40) [5.9 KB] || dam_finalcomp_1080p30.mp4 (1920x1080) [22.1 MB] || frames/1920x1080_16x9_30p/Example_Composite/ (1920x1080) [64.0 KB] || dam_finalcomp_1080p30.webm (1920x1080) [3.3 MB] ||
- ID: 4832 Visualization
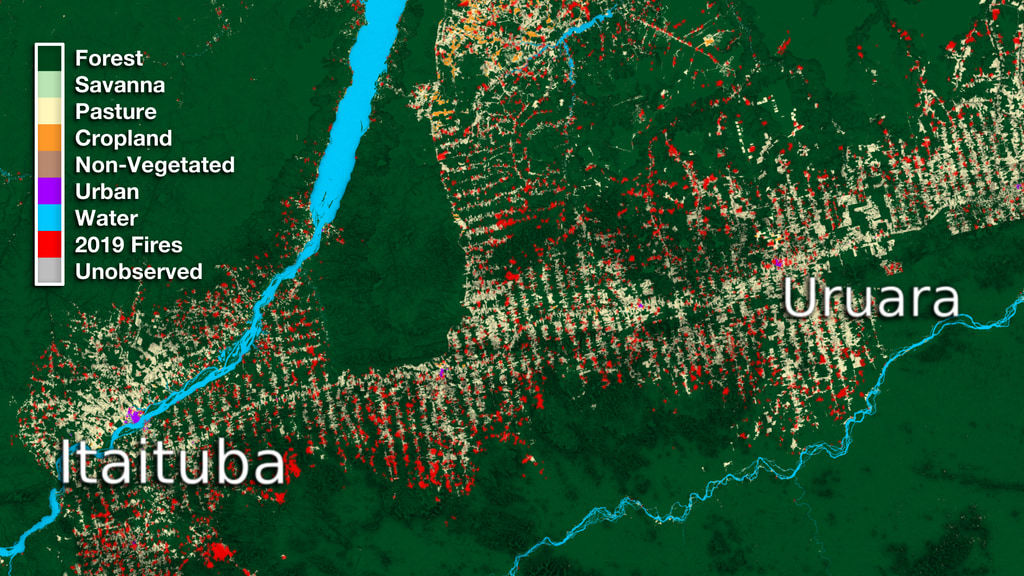
Itaituba and Uruara Land Use Data Over Time
Go to this pageThis data visualization begins with a wide view of Northern Brazil. It then zooms down to the region between Itaituba and Uruara and compares its relative size to the San Francisco Bay area. Next we cycle through over three decades of land use transformation showing pasture expansion over time. Lastly, we fade in 2019 fire data to indicate how the data will continue to change into the upcoming year. || ruropolis_finalcomp.2009_print.jpg (1024x576) [345.6 KB] || ruropolis_finalcomp.2009_searchweb.png (320x180) [116.9 KB] || ruropolis_finalcomp.2009_thm.png (80x40) [7.6 KB] || ruropolis_finalcomp_1080p30.mp4 (1920x1080) [29.5 MB] || frames/1920x1080_16x9_30p/Sample_Composite/ (1920x1080) [64.0 KB] || ruropolis_finalcomp_1080p30.webm (1920x1080) [3.5 MB] ||
- ID: 4833 Visualization
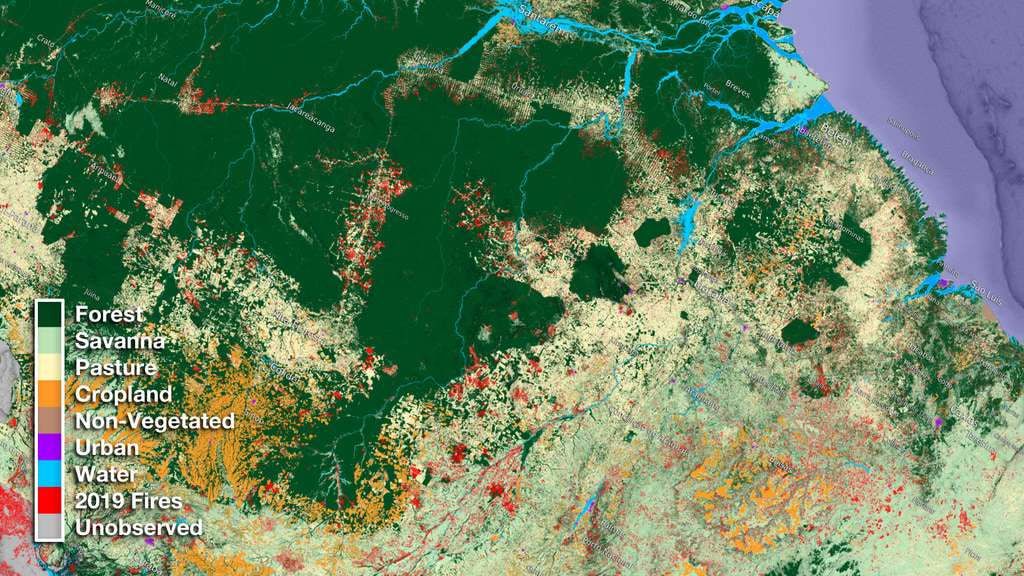
Northern Brazil Land Use Data Over Time
Go to this pageThis data visualization begins with a wide view of Northern Brazil. While zooming in a little closer an image of the United States fades in to get the relative size of the region. Next we cycle through over three decades of transformation in the region showing land use change over time. Lastly, we fade in 2019 fire data to indicate how the data will continue to change into the upcoming year. || brazil_wide_finalcomp.2009_print.jpg (1024x576) [451.8 KB] || brazil_wide_finalcomp.2009_searchweb.png (320x180) [128.6 KB] || brazil_wide_finalcomp.2009_thm.png (80x40) [8.1 KB] || brazil_wide_finalcomp_1080p30.mp4 (1920x1080) [31.3 MB] || frames/1920x1080_16x9_30p/Sample_Composite/ (1920x1080) [64.0 KB] || brazil_wide_finalcomp_1080p30.webm (1920x1080) [3.8 MB] ||
- ID: 4900 Visualization
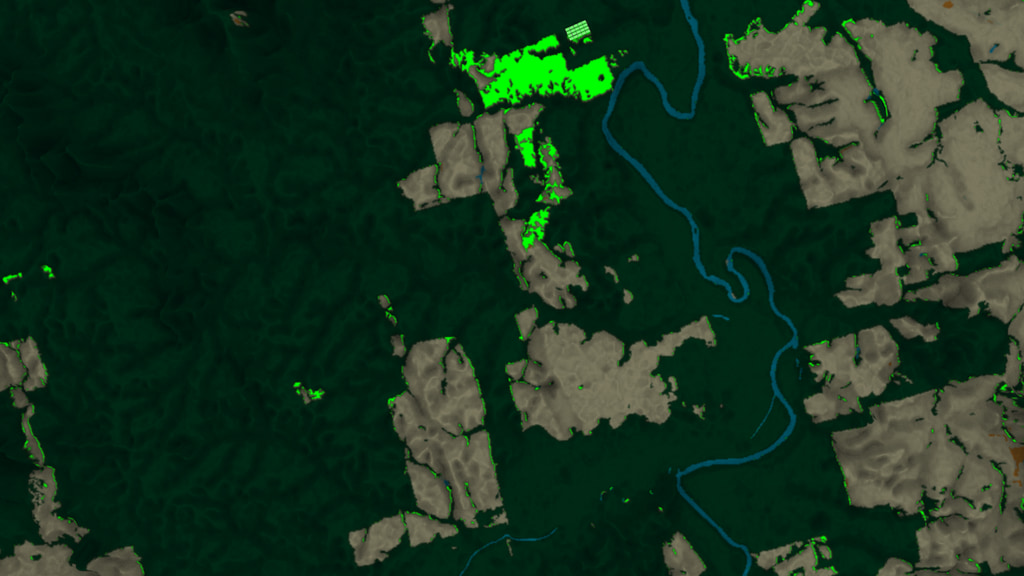
Novo Progresso Deforestation Soccer Field Comparison
Go to this pageAnimation begins with a stylized bright green soccer field. Soccer fields then fall into place over a recently deforested field showing the estimated size of the newly cleared field. The camera then pulls back to reveal all the recently deforested areas (shown in bright green) around Novo Progresso from 2017 to 2018. || soccer_comp.0700_print.jpg (1024x576) [161.5 KB] || soccer_comp.0700_searchweb.png (320x180) [85.8 KB] || soccer_comp.0700_thm.png (80x40) [14.1 KB] || soccer_2017_2018_1080p30.mp4 (1920x1080) [28.6 MB] || frames/1920x1080_16x9_30p/2017_to_2018/ (1920x1080) [128.0 KB] || soccer_2017_2018_1080p30.webm (1920x1080) [5.7 MB] ||