Earth
ID: 5098
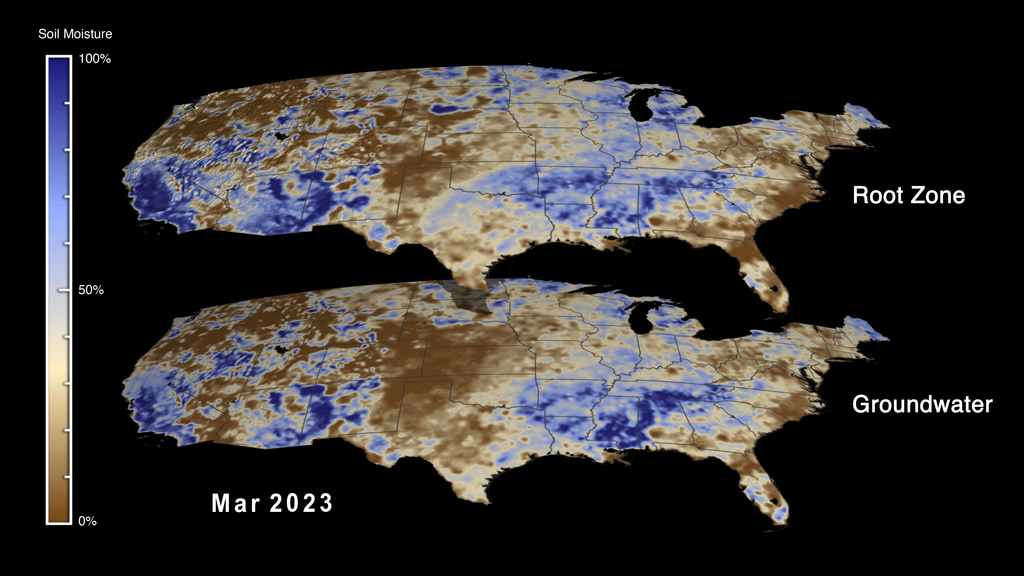
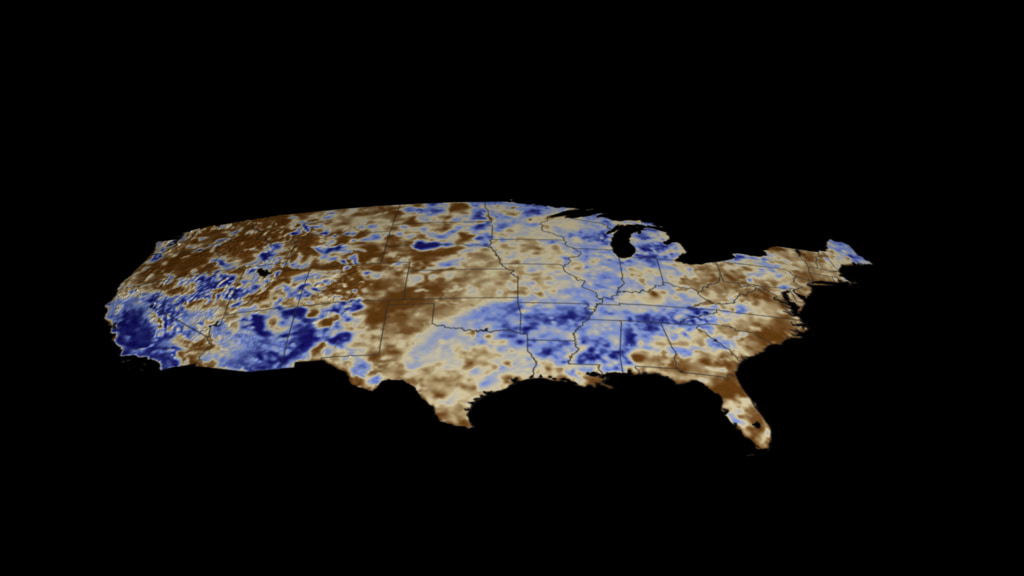
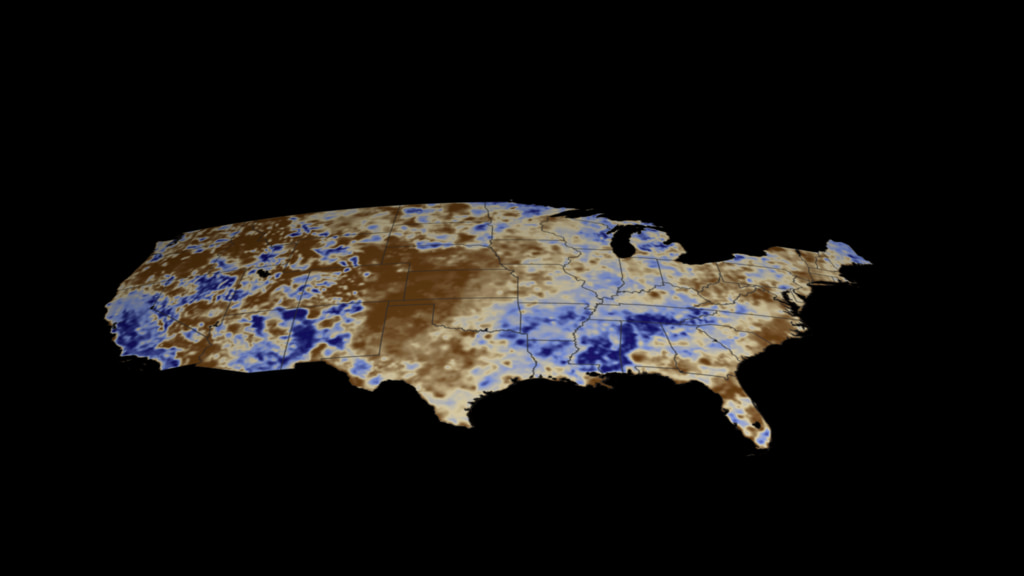
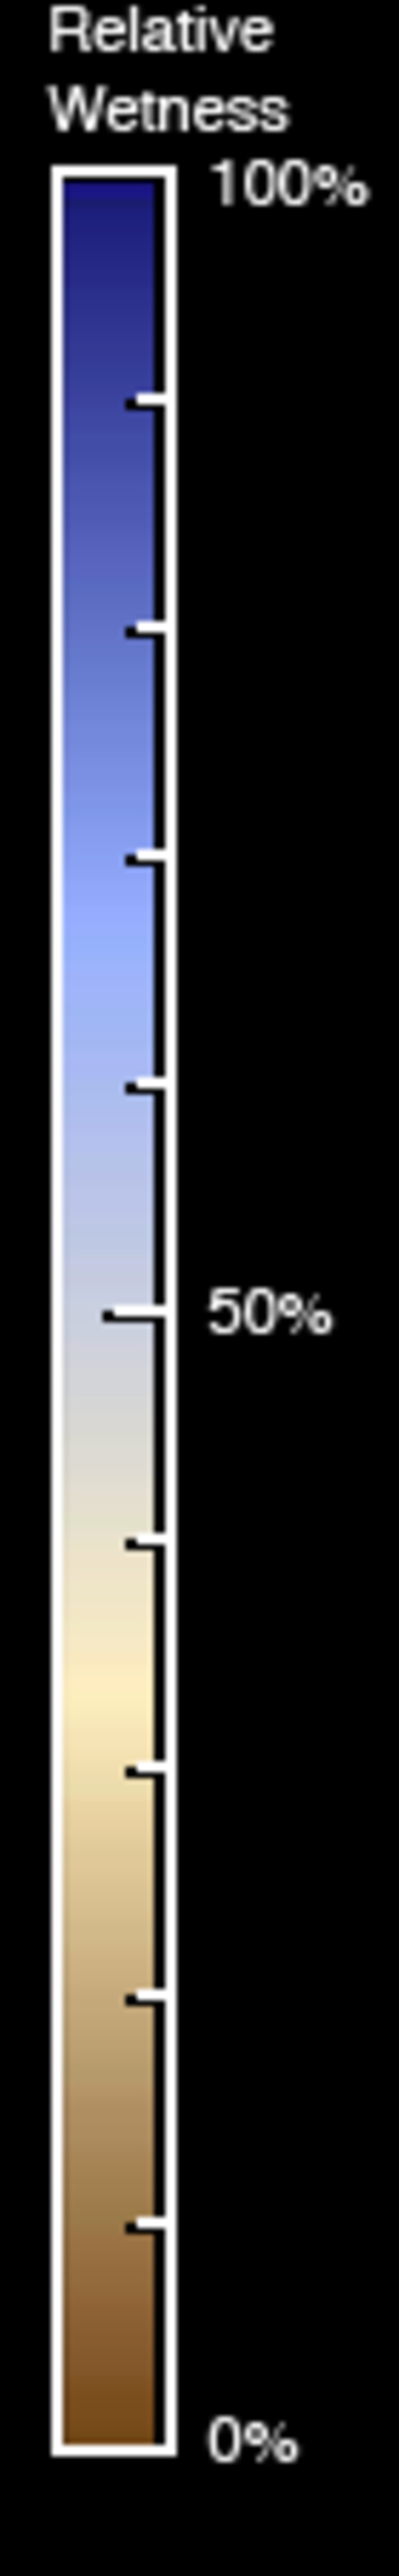
These maps combine data from the Gravity Recovery and Climate Experiment (GRACE) and GRACE Follow-On (GRACE-FO) with other satellite and ground-based measurements to model the relative amount of water stored at two different depths: plant root level and underground. The brown regions represent dry conditions. The blue regions represent wet areas. All of the maps are experimental products funded by NASA’s Applied Sciences Program and developed by scientists at NASA’s Goddard Space Flight Center and the National Drought Mitigation Center. The maps do not attempt to represent human consumption of water; but rather, they show changes in water storage related to weather, climate, and seasonal patterns.

Relative Wetness Root Zone Versus Groundwater Comparison
Visualization Credits
Alex Kekesi (Global Science and Technology, Inc.): Lead Data Visualizer
Matthew Rodell (NASA/GSFC): Lead Scientist
Kathleen Gaeta (Advocates in Manpower Management, Inc.): Lead Producer
Hiroko Kato Beaudoing (University of Maryland): Lead Data Provider
Matthew Rodell (NASA/GSFC): Lead Scientist
Kathleen Gaeta (Advocates in Manpower Management, Inc.): Lead Producer
Hiroko Kato Beaudoing (University of Maryland): Lead Data Provider
Please give credit for this item to:
NASA
NASA
Short URL to share this page:
https://svs.gsfc.nasa.gov/5098
Missions:
Gravity Recovery and Climate Experiment (GRACE)
Gravity Recovery and Climate Experiment Follow-on (GRACE-FO)
Data Used:
Note: While we identify the data sets used in these visualizations, we do not store any further details nor the data sets themselves on our site.
Keywords:
SVS >> HDTV
DLESE >> Hydrology
GCMD >> Earth Science >> Hydrosphere >> Ground Water
SVS >> Hyperwall
NASA Science >> Earth
GCMD >> Earth Science >> Human Dimensions >> Natural Hazards >> Droughts
GCMD keywords can be found on the Internet with the following citation: Olsen, L.M., G. Major, K. Shein, J. Scialdone, S. Ritz, T. Stevens, M. Morahan, A. Aleman, R. Vogel, S. Leicester, H. Weir, M. Meaux, S. Grebas, C.Solomon, M. Holland, T. Northcutt, R. A. Restrepo, R. Bilodeau, 2013. NASA/Global Change Master Directory (GCMD) Earth Science Keywords. Version 8.0.0.0.0
https://svs.gsfc.nasa.gov/5098
Missions:
Gravity Recovery and Climate Experiment (GRACE)
Gravity Recovery and Climate Experiment Follow-on (GRACE-FO)
Data Used:
Gravity Recovery and Climate Experiment (GRACE)
Keywords:
SVS >> HDTV
DLESE >> Hydrology
GCMD >> Earth Science >> Hydrosphere >> Ground Water
SVS >> Hyperwall
NASA Science >> Earth
GCMD >> Earth Science >> Human Dimensions >> Natural Hazards >> Droughts
GCMD keywords can be found on the Internet with the following citation: Olsen, L.M., G. Major, K. Shein, J. Scialdone, S. Ritz, T. Stevens, M. Morahan, A. Aleman, R. Vogel, S. Leicester, H. Weir, M. Meaux, S. Grebas, C.Solomon, M. Holland, T. Northcutt, R. A. Restrepo, R. Bilodeau, 2013. NASA/Global Change Master Directory (GCMD) Earth Science Keywords. Version 8.0.0.0.0


