Earth
ID: 5059
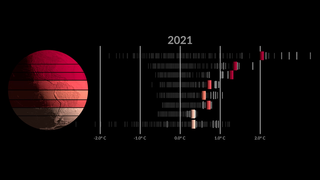
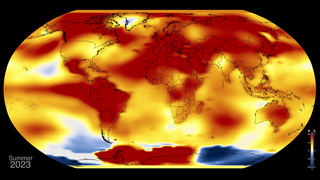
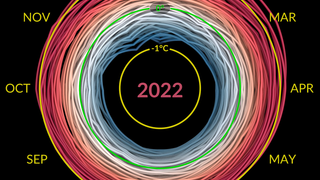
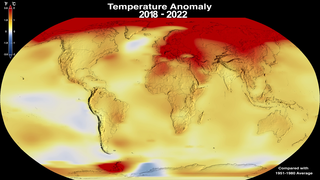
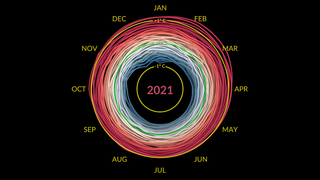
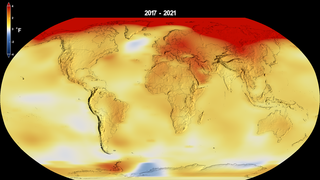
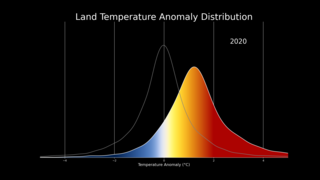
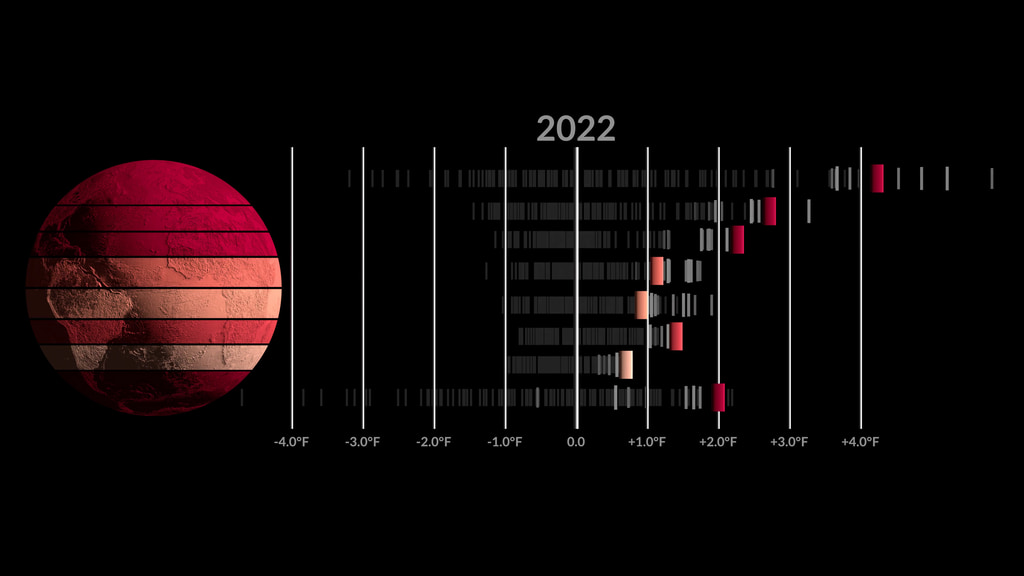
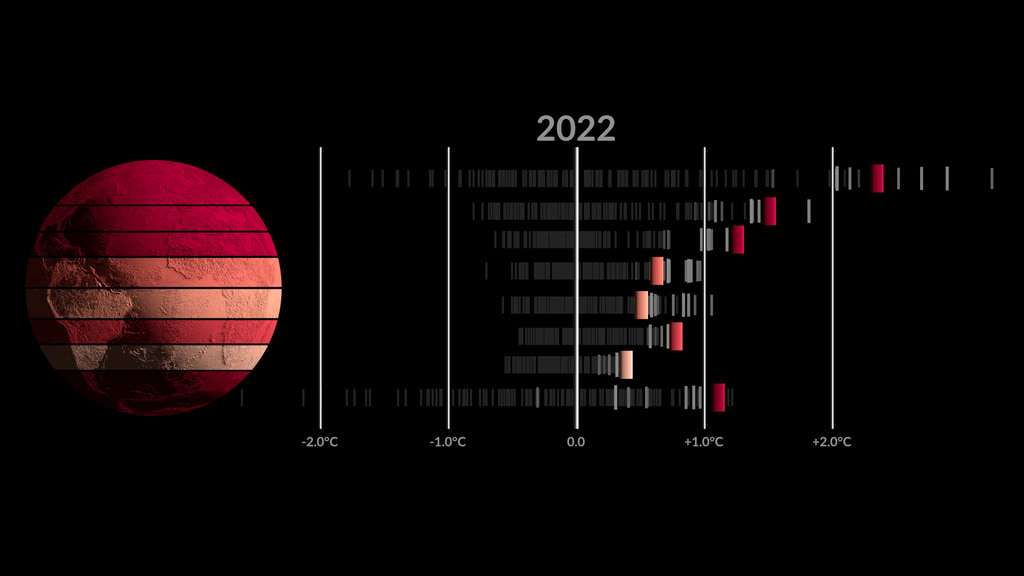
The visualization presents zonal temperature anomalies between the years 1880-2022. The visualization illustrates that the Arctic is warming much faster than other regions of the Earth.
These temperatures are based on the GISS Surface Temperature Analysis (GISTEMP v4), an estimate of global surface temperature change. The latitude zones are 90N-64N, 64N-44N, 44N-24N, 24N-EQU, EQU-24S, 24S-44S, 44S-64S, 64S-90S. Anomalies are defined relative to a base period of 1951-1980. The data file used to create this visualization can be accessed here.
The Goddard Institute of Space Studies (GISS) is a NASA laboratory managed by the Earth Sciences Division of the agency’s Goddard Space Flight Center in Greenbelt, Maryland. The laboratory is affiliated with Columbia University’s Earth Institute and School of Engineering and Applied Science in New York.
Zonal Climate Anomalies 1880-2022
These temperatures are based on the GISS Surface Temperature Analysis (GISTEMP v4), an estimate of global surface temperature change. The latitude zones are 90N-64N, 64N-44N, 44N-24N, 24N-EQU, EQU-24S, 24S-44S, 44S-64S, 64S-90S. Anomalies are defined relative to a base period of 1951-1980. The data file used to create this visualization can be accessed here.
The Goddard Institute of Space Studies (GISS) is a NASA laboratory managed by the Earth Sciences Division of the agency’s Goddard Space Flight Center in Greenbelt, Maryland. The laboratory is affiliated with Columbia University’s Earth Institute and School of Engineering and Applied Science in New York.
Older Version
Related

Visualization Credits
Mark SubbaRao (NASA/GSFC): Lead Visualizer
Laurence Schuler (ADNET Systems, Inc.): Technical Support
Ian Jones (ADNET Systems, Inc.): Technical Support
Laurence Schuler (ADNET Systems, Inc.): Technical Support
Ian Jones (ADNET Systems, Inc.): Technical Support
Please give credit for this item to:
NASA's Scientific Visualization Studio
NASA's Scientific Visualization Studio
Short URL to share this page:
https://svs.gsfc.nasa.gov/5059
Data Used:
Note: While we identify the data sets used in these visualizations, we do not store any further details nor the data sets themselves on our site.
Keywords:
SVS >> Climate
SVS >> Climate Change
NASA Science >> Earth
NASA Earth Science Focus Areas >> Climate Variability and Change
https://svs.gsfc.nasa.gov/5059
Data Used:
GISS Surface Temperature Analysis (GISTEMP)/GISTEMP
Model - NASA/GISSKeywords:
SVS >> Climate
SVS >> Climate Change
NASA Science >> Earth
NASA Earth Science Focus Areas >> Climate Variability and Change


