Earth
ID: 5026
Super Typhoon Nanmadol became one of the strongest typhoons to threaten Japan since records began in 1951. Nanmadol began as a tropical disturbance, basically an area of active thunderstorms, on September 11th southeast of Iwo Jima about midway between Tokyo and Guam. After moving to the southwest for 2 days, this disturbance became better organized and formed into a depression on the 13th. The system then made a counterclockwise loop, moving first back to the northeast before turning back again towards the west. Over this time, the system slowly intensified, becoming Tropical Storm Nanmadol just before its westward turn. At this point, Nanmadol responded to a favorable environment, including sea surface temperatures (SSTs) in the area running 0.5 to over 1.0OC above normal due in part to the ongoing La Niña, and began to steadily intensify as it headed for the southern part of Japan, becoming a typhoon on the afternoon of the 15th, a category 3 typhoon on the morning of the 16th , and a category 4 super typhoon on the evening of the 16th with maximum sustained winds estimated at 150 mph by the Joint Typhoon Warning Center (JTWC). It was during this transition from typhoon to super typhoon, at 7:57 UTC (4:57 pm JST) 16 September, that the NASA / JAXA GPM Core Observatory satellite overflew Nanmadol, providing a detailed look into the storm’s structure.
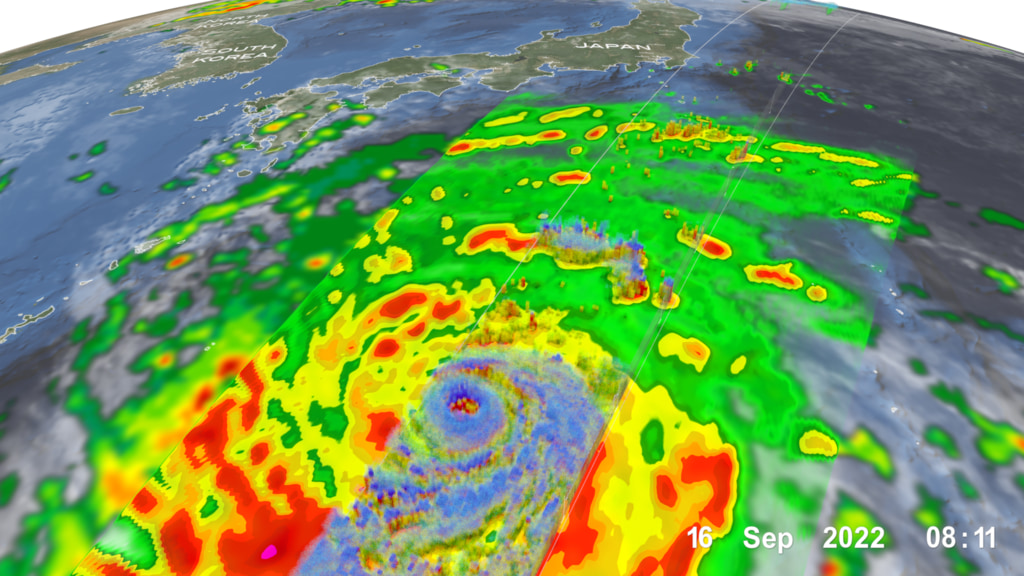
With its array of active and passive sensors, the GPM Core Observatory satellite is ideal for monitoring and studying tropical cyclones. This data visualization shows Nanmadol in the West Pacific beginning on the 15th of September 2022 as the storm was moving northwest towards southern Japan, though still far from landfall. The animation first shows a time loop of surface rainfall estimates from NASA’s IMERG precipitation product overlaid on IR data from the CPC global cloud cover composite. At the start of the loop at 07:41 UTC, IMERG shows that Nanmadol is already a well-defined typhoon having a distinct eye with moderate to heavy rain wrapping completely around the center. IMERG also reveals the size of Nanmadol’s large cyclonic (counterclockwise) circulation with curved rainbands wrapping around the center of low pressure well away from the center in nearly all directions. Over the course the IMERG loop, Nanmadol strengthened from a category 1 typhoon to a category 4 super typhoon.
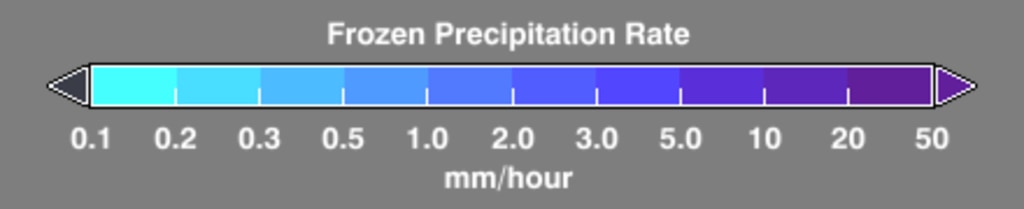
The second part of the visualization shows a detailed look into the structure and intensity of the precipitation within Nanmadol. Surface rainfall estimates from the GPM Microwave Imager (GMI) show heavy rain (in red) wrapping around the western and southern portions of the storm well away from the center as well as rainbands approaching the coast of Japan well to the north (green areas). GPM’s Dual-frequency Precipitation Radar (DPR) actively scanned the storm to provide a 3D perspective of its precipitation. Areas shaded in blue show frozen precipitation aloft. This is mainly in the form of snow but can also be graupel, which are rimed snow particles, and frozen drops, which are both present in the cores of active thunderstorms. Moreover, the structure and height to which these particles extend can provide additional information on future trends. The DPR shows that Nanmadol’s eyewall is both deep and complete, creating what is known as a “stadium effect” with a ring of tall towers surrounding a void in the center, which is the eye. This structure is only associated with mature and intense tropical cyclones and suggests Nanmadol will either maintain its intensity or strengthen. The tall towers result from strong thunderstorm updrafts generating and carrying the particles aloft. Associated with this are intense rain shafts (shown in magenta) that extend down towards the surface. Together these features suggest strong thunderstorms are actively releasing heat into Nanmadol’s core circulation and priming the storm for possible further intensification.
At the time of the GPM overpass, Nanmadol’s maximum sustained winds were estimated at 130 mph by JTWC. Just over 4 hours later at 1200 UTC September 16th, they were estimated at 150 mph, making Nanmadol a super typhoon. Nanmadol would go on to reach a peak intensity of 155 mph before starting to weaken as it neared the Japanese coast. Nanmadol made landfall on the 18th as a category 3 storm with sustained winds of around 110 mph near Kagoshima city on the island of Kyushu. Nanmadol then turned to the northeast and moved along the west coast of Honshu before crossing back out into the Pacific east of Japan. The storm has brought heavy rains to much of Japan and is so far being blamed for 2 deaths.

Super Typhoon Nanmadol intensifies on its way to Japan
With its array of active and passive sensors, the GPM Core Observatory satellite is ideal for monitoring and studying tropical cyclones. This data visualization shows Nanmadol in the West Pacific beginning on the 15th of September 2022 as the storm was moving northwest towards southern Japan, though still far from landfall. The animation first shows a time loop of surface rainfall estimates from NASA’s IMERG precipitation product overlaid on IR data from the CPC global cloud cover composite. At the start of the loop at 07:41 UTC, IMERG shows that Nanmadol is already a well-defined typhoon having a distinct eye with moderate to heavy rain wrapping completely around the center. IMERG also reveals the size of Nanmadol’s large cyclonic (counterclockwise) circulation with curved rainbands wrapping around the center of low pressure well away from the center in nearly all directions. Over the course the IMERG loop, Nanmadol strengthened from a category 1 typhoon to a category 4 super typhoon.
The second part of the visualization shows a detailed look into the structure and intensity of the precipitation within Nanmadol. Surface rainfall estimates from the GPM Microwave Imager (GMI) show heavy rain (in red) wrapping around the western and southern portions of the storm well away from the center as well as rainbands approaching the coast of Japan well to the north (green areas). GPM’s Dual-frequency Precipitation Radar (DPR) actively scanned the storm to provide a 3D perspective of its precipitation. Areas shaded in blue show frozen precipitation aloft. This is mainly in the form of snow but can also be graupel, which are rimed snow particles, and frozen drops, which are both present in the cores of active thunderstorms. Moreover, the structure and height to which these particles extend can provide additional information on future trends. The DPR shows that Nanmadol’s eyewall is both deep and complete, creating what is known as a “stadium effect” with a ring of tall towers surrounding a void in the center, which is the eye. This structure is only associated with mature and intense tropical cyclones and suggests Nanmadol will either maintain its intensity or strengthen. The tall towers result from strong thunderstorm updrafts generating and carrying the particles aloft. Associated with this are intense rain shafts (shown in magenta) that extend down towards the surface. Together these features suggest strong thunderstorms are actively releasing heat into Nanmadol’s core circulation and priming the storm for possible further intensification.
At the time of the GPM overpass, Nanmadol’s maximum sustained winds were estimated at 130 mph by JTWC. Just over 4 hours later at 1200 UTC September 16th, they were estimated at 150 mph, making Nanmadol a super typhoon. Nanmadol would go on to reach a peak intensity of 155 mph before starting to weaken as it neared the Japanese coast. Nanmadol made landfall on the 18th as a category 3 storm with sustained winds of around 110 mph near Kagoshima city on the island of Kyushu. Nanmadol then turned to the northeast and moved along the west coast of Honshu before crossing back out into the Pacific east of Japan. The storm has brought heavy rains to much of Japan and is so far being blamed for 2 deaths.
Visualization Credits
Alex Kekesi (Global Science and Technology, Inc.): Lead Data Visualizer
Greg Shirah (NASA/GSFC): Data Visualizer
George Huffman (NASA/GSFC): Lead Scientist
Scott Braun (NASA/GSFC): Scientist
Jacob Reed (Telophase): Scientist
Stephen Lang (SSAI): Lead Writer
Laurence Schuler (ADNET Systems, Inc.): Lead Technical Support
Ian Jones (ADNET Systems, Inc.): Technical Support
Greg Shirah (NASA/GSFC): Data Visualizer
George Huffman (NASA/GSFC): Lead Scientist
Scott Braun (NASA/GSFC): Scientist
Jacob Reed (Telophase): Scientist
Stephen Lang (SSAI): Lead Writer
Laurence Schuler (ADNET Systems, Inc.): Lead Technical Support
Ian Jones (ADNET Systems, Inc.): Technical Support
Please give credit for this item to:
NASA's Scientific Visualization Studio. Data provided by the joint NASA/JAXA GPM mission.
NASA's Scientific Visualization Studio. Data provided by the joint NASA/JAXA GPM mission.
Short URL to share this page:
https://svs.gsfc.nasa.gov/5026
Mission:
Global Precipitation Measurement (GPM)
Data Used:
Note: While we identify the data sets used in these visualizations, we do not store any further details nor the data sets themselves on our site.
This item is part of these series:
GPM Animations
Hurricanes
Keywords:
DLESE >> Atmospheric science
DLESE >> Hydrology
DLESE >> Natural hazards
GCMD >> Earth Science >> Atmosphere >> Atmospheric Phenomena >> Hurricanes
GCMD >> Earth Science >> Atmosphere >> Atmospheric Phenomena >> Typhoons
GCMD >> Earth Science >> Atmosphere >> Precipitation >> Rain
GCMD >> Location >> Pacific Ocean
SVS >> Hyperwall
NASA Science >> Earth
GCMD keywords can be found on the Internet with the following citation: Olsen, L.M., G. Major, K. Shein, J. Scialdone, S. Ritz, T. Stevens, M. Morahan, A. Aleman, R. Vogel, S. Leicester, H. Weir, M. Meaux, S. Grebas, C.Solomon, M. Holland, T. Northcutt, R. A. Restrepo, R. Bilodeau, 2013. NASA/Global Change Master Directory (GCMD) Earth Science Keywords. Version 8.0.0.0.0
https://svs.gsfc.nasa.gov/5026
Mission:
Global Precipitation Measurement (GPM)
Data Used:
CPC (Climate Prediction Center) Cloud Composite
Data Compilation - Climate Prediction Center (CPC) - 9/15/2022 7:41Z - 9/16/2022 8:11Z
Global cloud cover from multiple satellites
GPM/GMI/Surface Precipitation also referred to as: Rain Rates
9/16/2022 07:57:23-08:02:21Z
Credit:
Data provided by the joint NASA/JAXA GPM mission.
Data provided by the joint NASA/JAXA GPM mission.
GPM/DPR/Ku also referred to as: Volumetric Precipitation data
Observed Data - JAXA - 9/16/2022 07:41:28-08:11:27Z
Credit:
Data provided by the joint NASA/JAXA GPM mission.
Data provided by the joint NASA/JAXA GPM mission.
also referred to as: IMERG
Data Compilation - NASA/GSFC - 9/15/2022 7:41Z - 9/16/2022 8:11ZThis item is part of these series:
GPM Animations
Hurricanes
Keywords:
DLESE >> Atmospheric science
DLESE >> Hydrology
DLESE >> Natural hazards
GCMD >> Earth Science >> Atmosphere >> Atmospheric Phenomena >> Hurricanes
GCMD >> Earth Science >> Atmosphere >> Atmospheric Phenomena >> Typhoons
GCMD >> Earth Science >> Atmosphere >> Precipitation >> Rain
GCMD >> Location >> Pacific Ocean
SVS >> Hyperwall
NASA Science >> Earth
GCMD keywords can be found on the Internet with the following citation: Olsen, L.M., G. Major, K. Shein, J. Scialdone, S. Ritz, T. Stevens, M. Morahan, A. Aleman, R. Vogel, S. Leicester, H. Weir, M. Meaux, S. Grebas, C.Solomon, M. Holland, T. Northcutt, R. A. Restrepo, R. Bilodeau, 2013. NASA/Global Change Master Directory (GCMD) Earth Science Keywords. Version 8.0.0.0.0


