Earth
ID: 4781
The El Niño-Southern Oscillation (ENSO) phenomenon is an irregularly recurring climate pattern characterized by warmer (El Niño) and colder (La Niña) than usual ocean temperatures in the equatorial Pacific, which creates a ripple effect of anticipated weather changes in far-spread regions on Earth. Weather changes associated with the El Niño-Southern Oscillation phenomenon result in rainfall, temperature and environmental anomaly conditions worldwide that directly favor outbreaks of infectious diseases of public health concern.
During the last 20 years NASA scientist Dr. Assaf Anyamba and colleagues have been studying interannual climate variability patterns associated with El Niño by monitoring various climate datasets, among them land surface temperature and vegetation data from the Advanced High Resolution Radiometer (AVHRR) on board NOAA POES satelittes, the Moderate Resolution Imaging Spectroradiometer aboard NASA's Terra and Aqua satellites, and Sea Surface Temperature and precipitation anomaly datasets from NASA and the National Oceanic and Atmospheric Administration (NOAA). At the same time, the science team has been collecting, cataloguing and analyzing patterns of disease outbreaks worldwide.
Dr. Anyamba and colleagues conducted a scientific study - the first one to comprehensively assess the public health impacts of the major climate event on a global scale - that was published in the journal Nature Scientific Reports, with the title Global Disease Outbreaks Associated with the 2015-2016 El Niño event and is open access available. According to this study, the 2015-2016 El Niño event brought weather conditions that triggered disease outbreaks in ENSO teleconnected regions throughout the world.
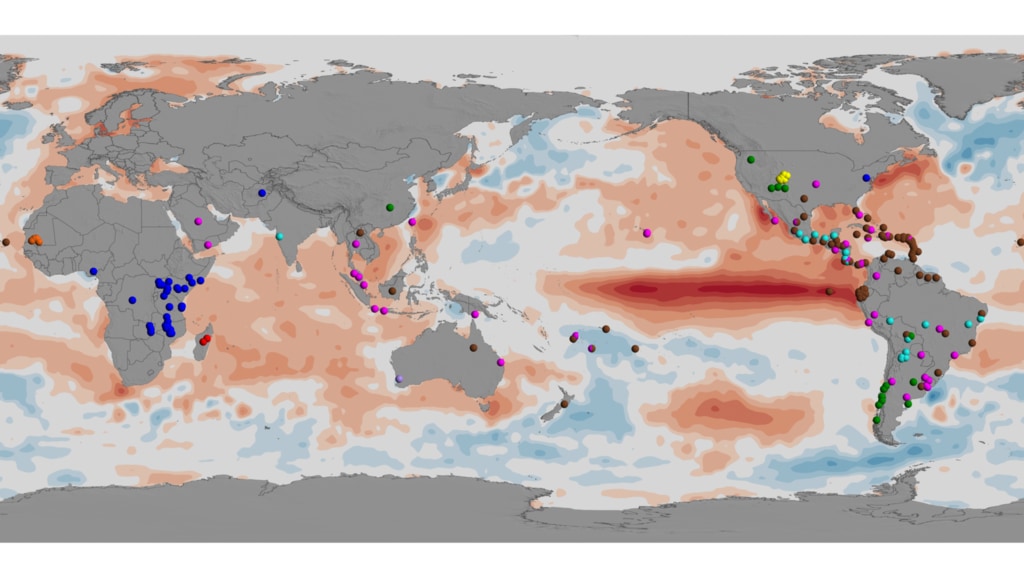
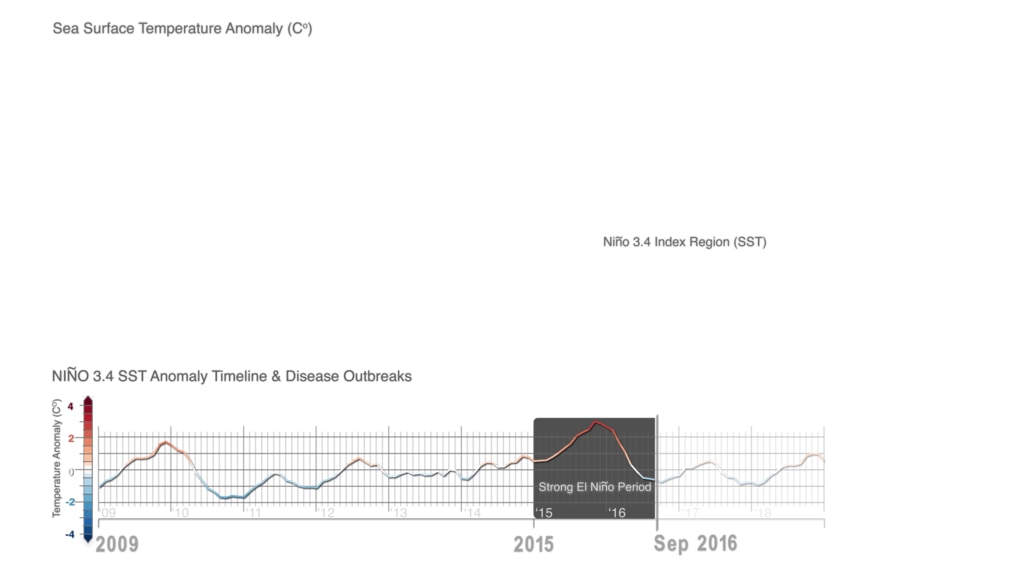
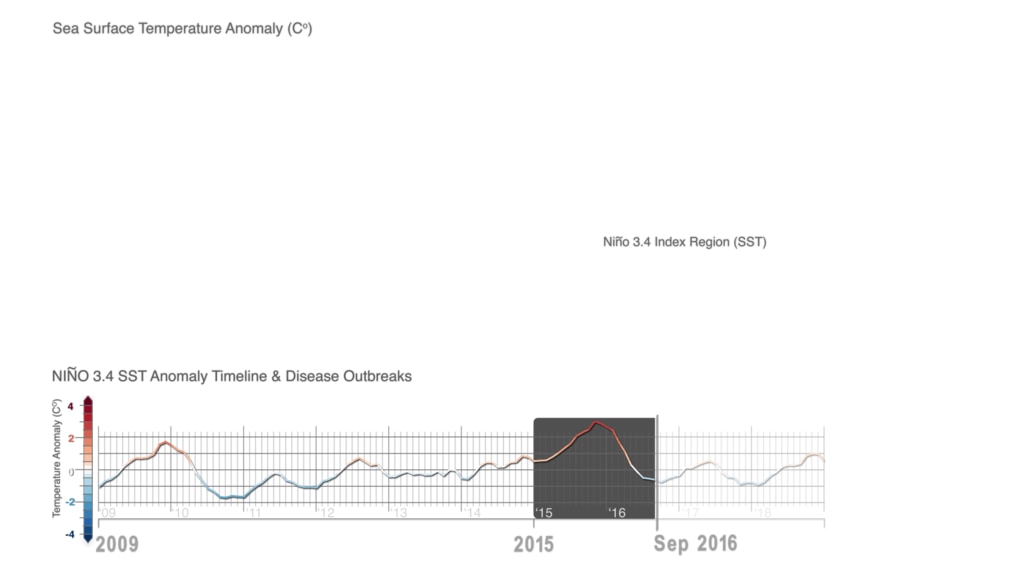
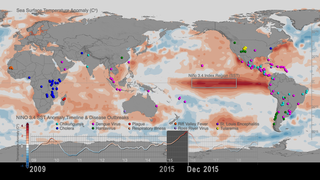
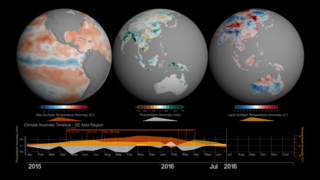
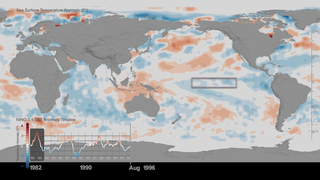
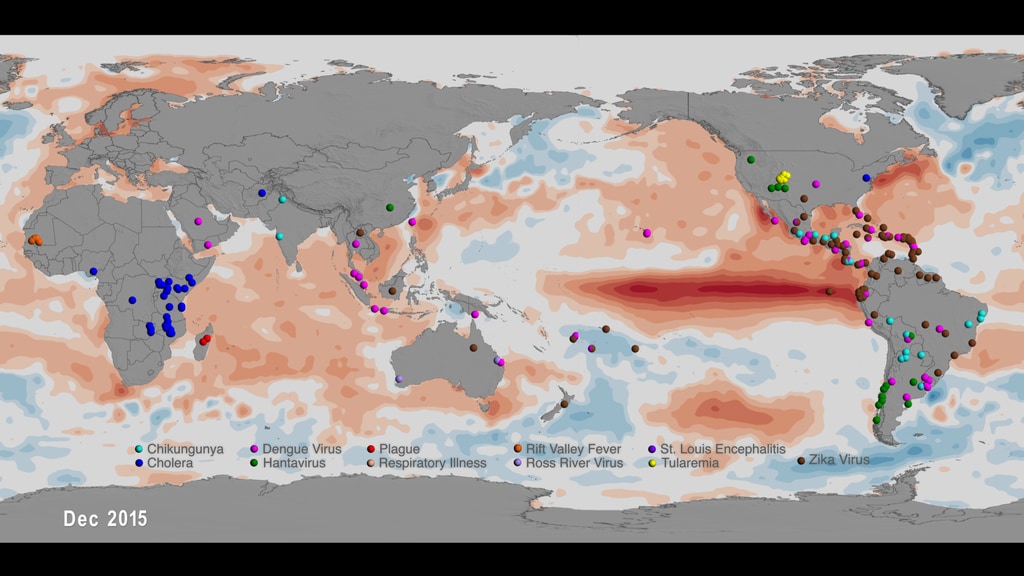
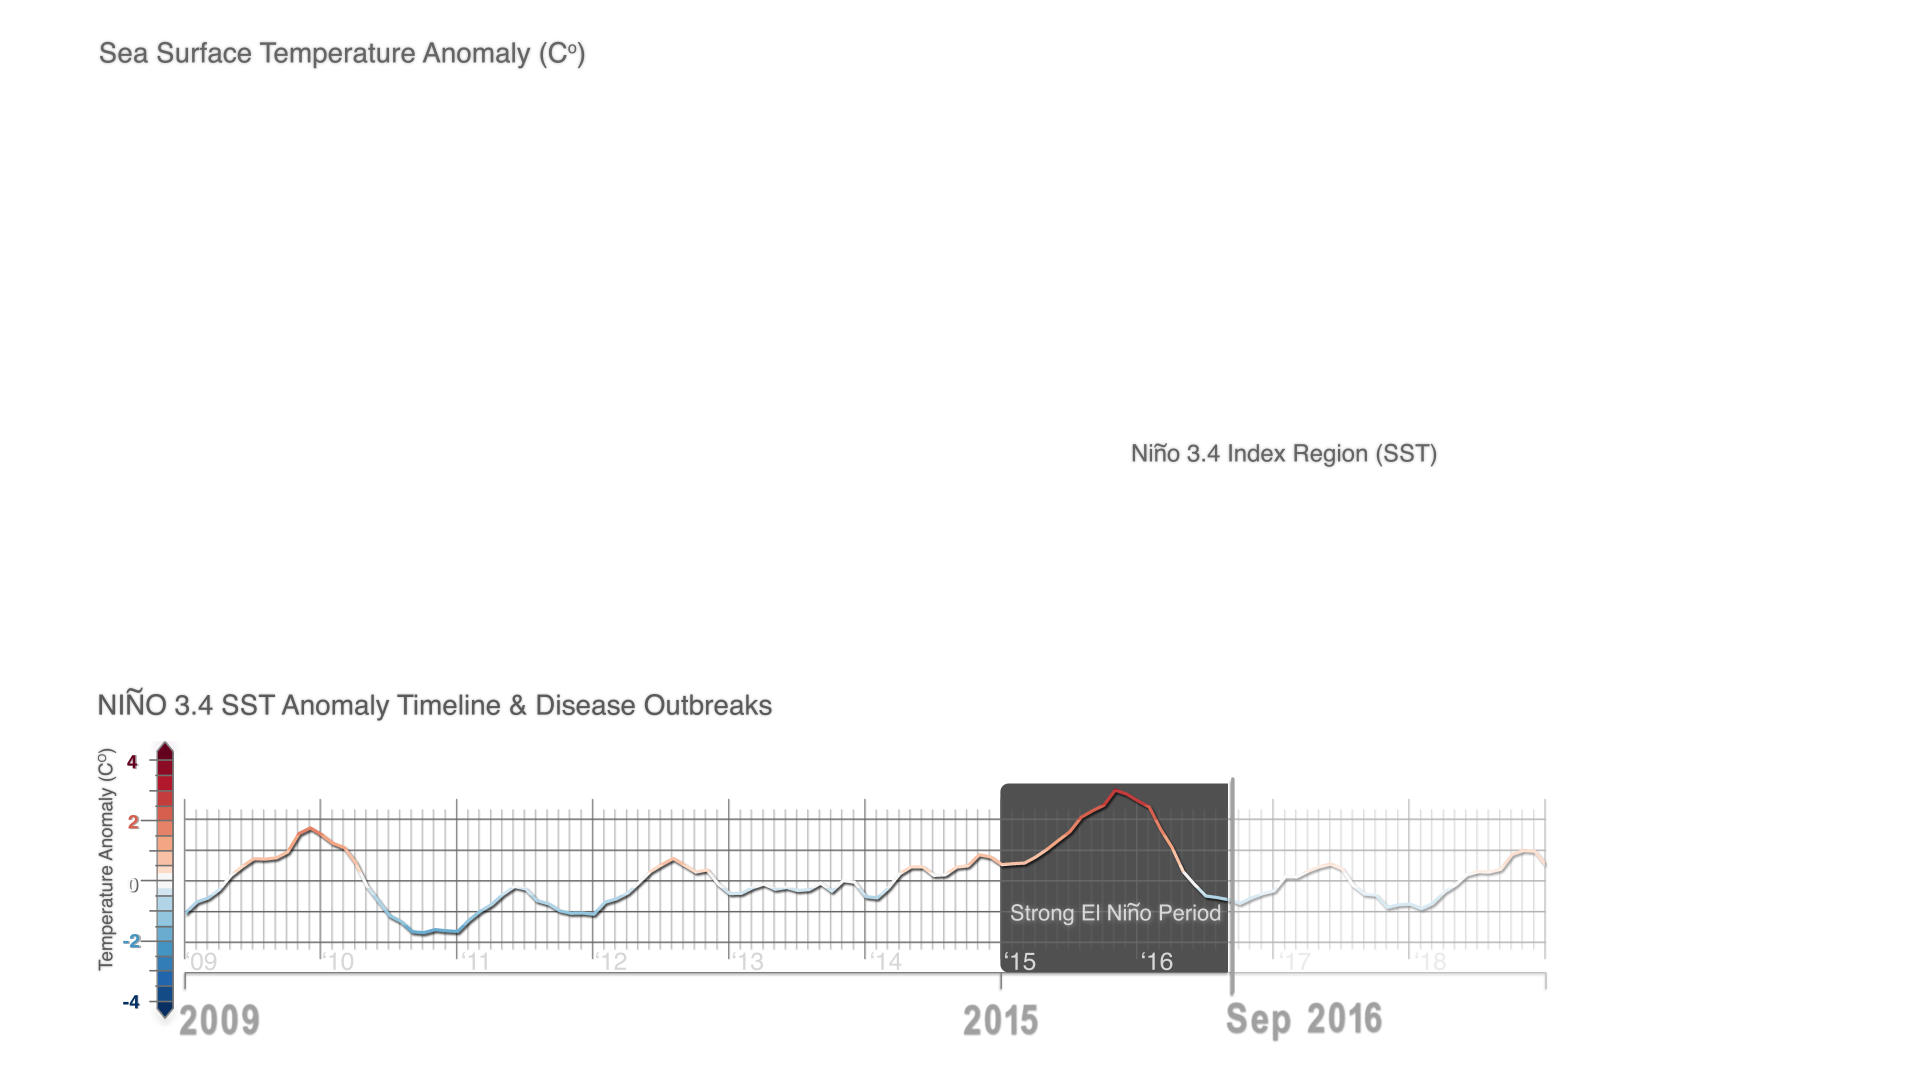
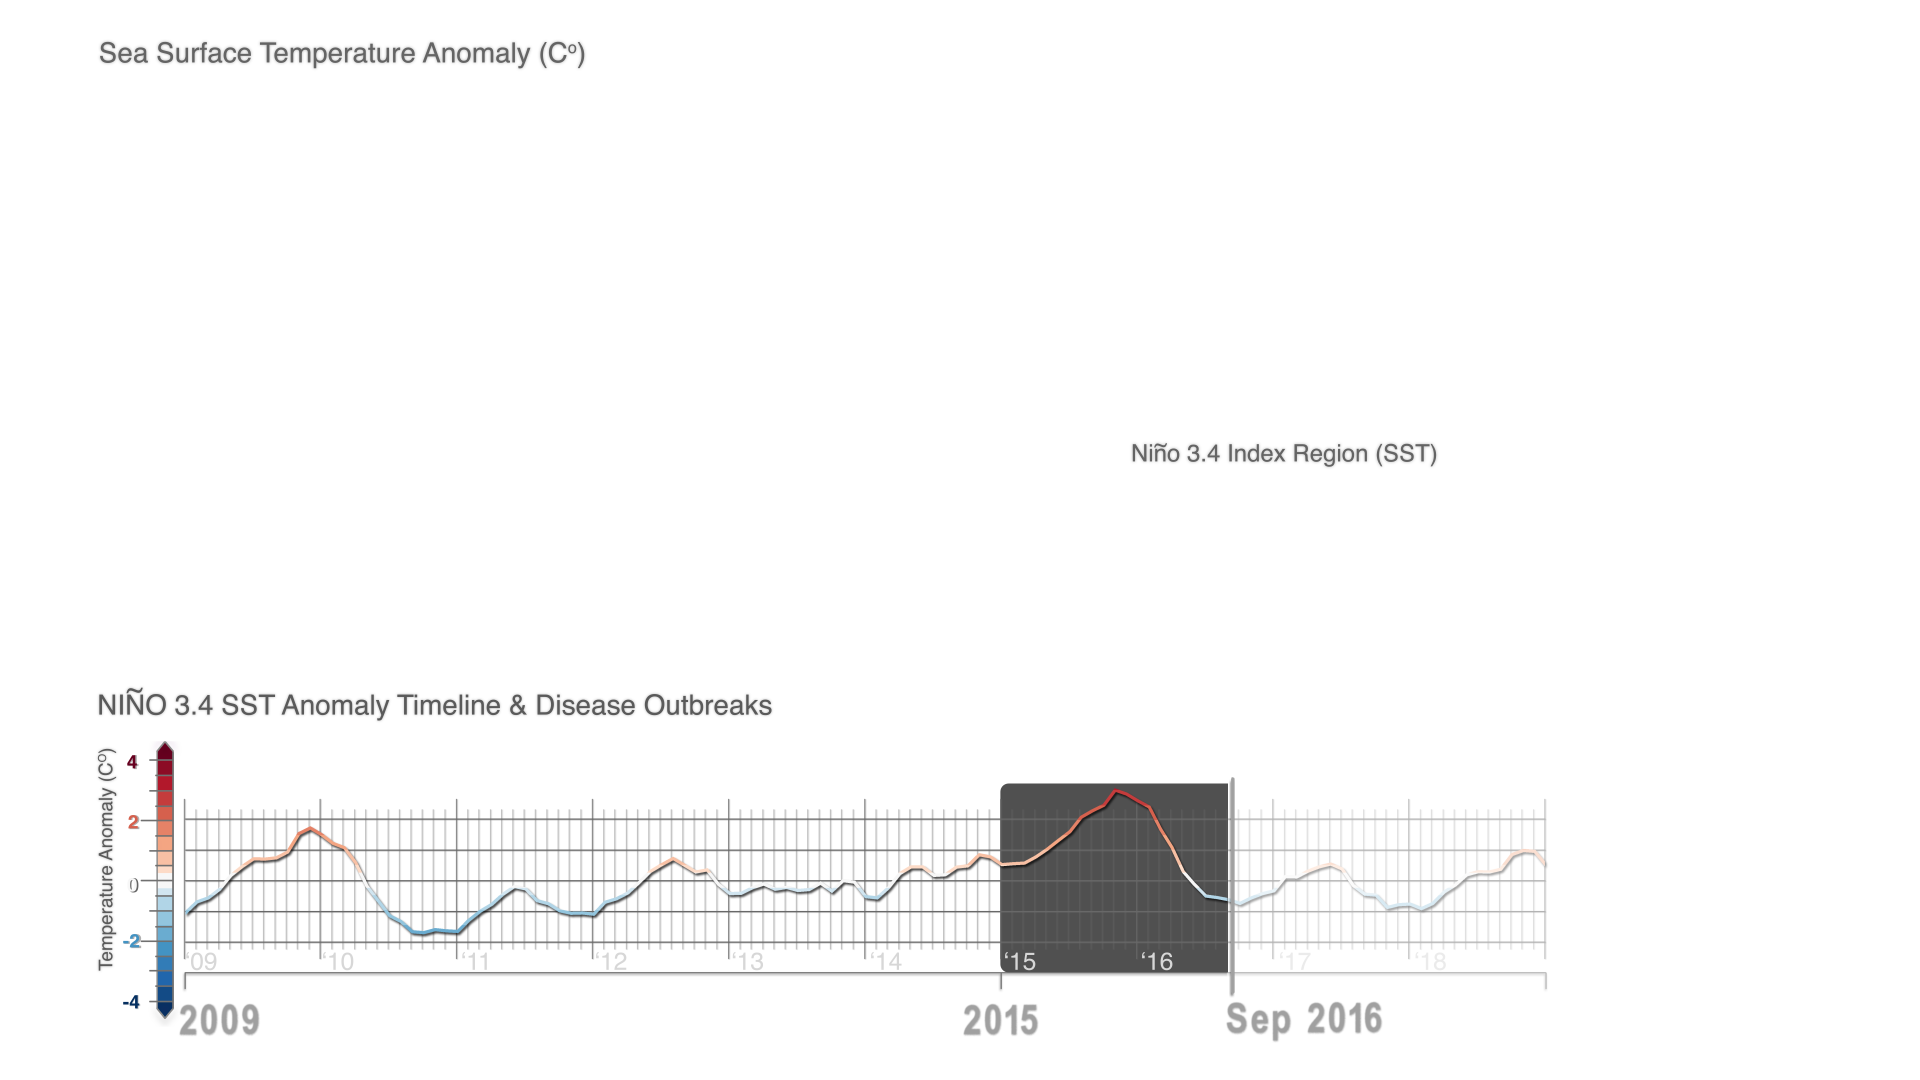
The visualization showcases a global flat map with monthly Sea Surface Temperature (SST) anomaly data on the water, the locations of Global Disease Outbreaks of eleven infectious diseases on land, along with a timeline plot of the ENSO Index (Niño 3.4 Index region SST anomaly) for the period 2009-2018 on the bottom. The Nino 3.4 Index region SST with extents (5N-5S, 120W-170W) is the box region, highlighted on the Pacific Ocean.
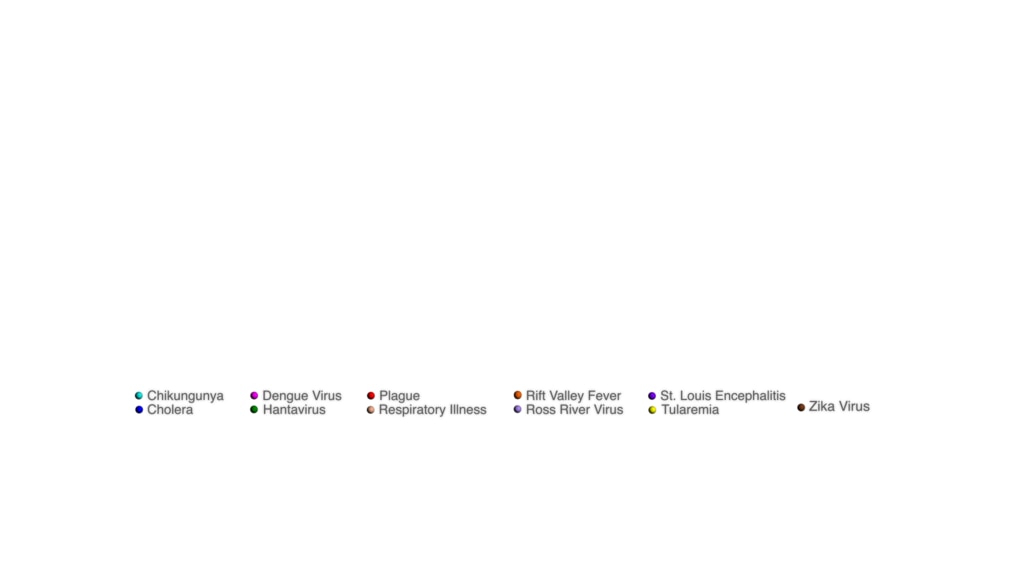
During ENSO events, SST anomalies influence the nature and patterns of rainfall, vegetation and land surface temperatures on the land surface, which in turn influence the disease outbreaks that are mapped on a global scale. The 10 diseases mapped on this visualization are: chinkungunya, cholera, dengue virus, hantavirus, respiratory illness, Rift Valley fever, Ross River virus, St. Louis encephalitis, tularemia and zika virus.
During the 2015-2016 El Nino event, which is manifested in the visualization with increased sea surface temperature anomaly (reds in Niño 3.4 Index Region), changes in precipitation, land surface temperatures and vegetation created and facilitated conditions for transmission of diseases, resulting in an uptick in reported cases for plague and hantavirus in Colorado and New Mexico (in 2015), cholera in East Africa’s Tanzania (during 2015 and 2016), and dengue fever in Brazil and Southeast Asia (during 2015), among others.
According to the study, El Niño-driven increase in rainfall and milder temperatures over the American Southwest, spurred vegetative growth, providing more food for rodents that carry hantavirus. A resulting rodent population explosion put them in more frequent contact with humans, who contract the potentially fatal disease mostly through rodent fecal or urine contamination. As their rodent hosts proliferated, so did plague-carrying fleas.
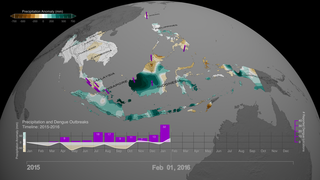
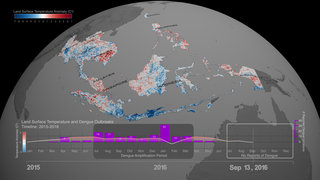
Regarding dengue outbreaks, the strong El Niño period produced higher than normal land surface temperatures and therefore drier habitats, which drew mosquitoes into populated, urban areas where there are open water storage containers providing ideal habitats for mosquito production. In addition, the higher the normal temperatures increase the maturation time of larvae to adult mosquitos and also induce frequent blood feeding/biting by mosquito vectors resulting in increased number of disease cases. The following 3 data driven visualizations demonstrate the complex relationships between the El Niño event in 2015-2016 and disease outbreaks of dengue in the South East Asia region:
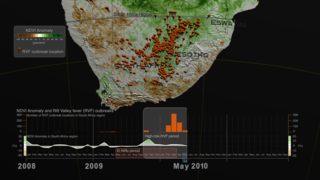
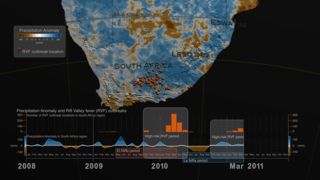
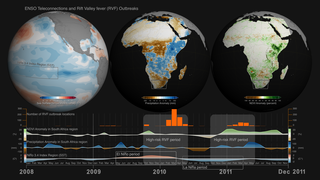
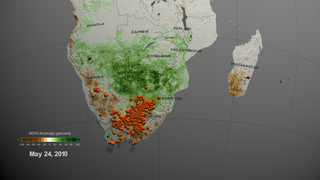
The impact of ENSO induced anomalous rainfall is clearly illustrated by outbreak patterns of Rift Valley fever (RVF) in East and South Africa. During ENSO events, Eastern Africa (El Niño) and South Africa (La Niña) receive persistent and above normal rainfall, which floods habitats of RVF mosquito vectors triggering hatching of RVF virus infected eggs. The above-normal rainfall is followed by an increase in vegetation creating appropriate habitats for the mosquito vectors setting the stage for RVF outbreak activity, which in simple terms means an uptick in mosquito populations that cause infections of domestic livestock and human populations. The results is the sea-saw pattern exhibited by the ENSO events drives patterns of disease outbreaks in different regions around the world. To learn more about the relationship between ENSO and Rift Valley fever outbreaks in the region of South Africa, please refer to:
The strong relationship between ENSO events (i.e El Niño, La Niña) and disease outbreaks underscores the importance of seasonal forecasts. Since disease outbreaks typically manifest 2-3 months after the start of ENSO events, early and regular climate monitoring, paired with the use of monthly and seasonal climate forecasts become significant tools for disease control and prevention. Findings of the scientific study suggest that by monitoring monthly climate datasets, country public health agencies and organizations such as the United Nations' World Health Organization and Food and Agriculture Organizations, can utilize early warning forecasts to undertake preventive measures to minimize the spread of ecologically coupled diseases.
Data Sources:
Supported with funding from the Defense Threat Reduction Agency's (DTRA) Joint Science and Technology Office for Chemical and Biological Defense (JSTO-CBD) Biosurveillance Ecosystem (BSVE) Program (HDTRA1-16-C-0045) and the Defense Health Agency-Armed Forces Health Surveillance Branch (AFHSB) Global Emerging Infections Surveillance and Response System (GEIS) under Project # P0072_19_NS.
This webpage provides frames, movies, colorbar information and layers associated with the development of this data visualization.


Sea Surface Temperature anomalies and patterns of Global Disease Outbreaks: 2009-2018 (updated)
During the last 20 years NASA scientist Dr. Assaf Anyamba and colleagues have been studying interannual climate variability patterns associated with El Niño by monitoring various climate datasets, among them land surface temperature and vegetation data from the Advanced High Resolution Radiometer (AVHRR) on board NOAA POES satelittes, the Moderate Resolution Imaging Spectroradiometer aboard NASA's Terra and Aqua satellites, and Sea Surface Temperature and precipitation anomaly datasets from NASA and the National Oceanic and Atmospheric Administration (NOAA). At the same time, the science team has been collecting, cataloguing and analyzing patterns of disease outbreaks worldwide.
Dr. Anyamba and colleagues conducted a scientific study - the first one to comprehensively assess the public health impacts of the major climate event on a global scale - that was published in the journal Nature Scientific Reports, with the title Global Disease Outbreaks Associated with the 2015-2016 El Niño event and is open access available. According to this study, the 2015-2016 El Niño event brought weather conditions that triggered disease outbreaks in ENSO teleconnected regions throughout the world.
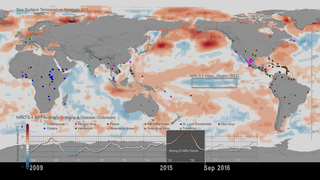
The visualization showcases a global flat map with monthly Sea Surface Temperature (SST) anomaly data on the water, the locations of Global Disease Outbreaks of eleven infectious diseases on land, along with a timeline plot of the ENSO Index (Niño 3.4 Index region SST anomaly) for the period 2009-2018 on the bottom. The Nino 3.4 Index region SST with extents (5N-5S, 120W-170W) is the box region, highlighted on the Pacific Ocean.
During ENSO events, SST anomalies influence the nature and patterns of rainfall, vegetation and land surface temperatures on the land surface, which in turn influence the disease outbreaks that are mapped on a global scale. The 10 diseases mapped on this visualization are: chinkungunya, cholera, dengue virus, hantavirus, respiratory illness, Rift Valley fever, Ross River virus, St. Louis encephalitis, tularemia and zika virus.
During the 2015-2016 El Nino event, which is manifested in the visualization with increased sea surface temperature anomaly (reds in Niño 3.4 Index Region), changes in precipitation, land surface temperatures and vegetation created and facilitated conditions for transmission of diseases, resulting in an uptick in reported cases for plague and hantavirus in Colorado and New Mexico (in 2015), cholera in East Africa’s Tanzania (during 2015 and 2016), and dengue fever in Brazil and Southeast Asia (during 2015), among others.
According to the study, El Niño-driven increase in rainfall and milder temperatures over the American Southwest, spurred vegetative growth, providing more food for rodents that carry hantavirus. A resulting rodent population explosion put them in more frequent contact with humans, who contract the potentially fatal disease mostly through rodent fecal or urine contamination. As their rodent hosts proliferated, so did plague-carrying fleas.
Regarding dengue outbreaks, the strong El Niño period produced higher than normal land surface temperatures and therefore drier habitats, which drew mosquitoes into populated, urban areas where there are open water storage containers providing ideal habitats for mosquito production. In addition, the higher the normal temperatures increase the maturation time of larvae to adult mosquitos and also induce frequent blood feeding/biting by mosquito vectors resulting in increased number of disease cases. The following 3 data driven visualizations demonstrate the complex relationships between the El Niño event in 2015-2016 and disease outbreaks of dengue in the South East Asia region:
- Teleconnections in South East Asia for the period of 2015-2016
- Precipitation Anomaly and Dengue Outbreaks in South East Asia: 2015-2016
- Land Surface Temperature Anomaly and Dengue Outbreaks in South East Asia Region: 2015-2016
The impact of ENSO induced anomalous rainfall is clearly illustrated by outbreak patterns of Rift Valley fever (RVF) in East and South Africa. During ENSO events, Eastern Africa (El Niño) and South Africa (La Niña) receive persistent and above normal rainfall, which floods habitats of RVF mosquito vectors triggering hatching of RVF virus infected eggs. The above-normal rainfall is followed by an increase in vegetation creating appropriate habitats for the mosquito vectors setting the stage for RVF outbreak activity, which in simple terms means an uptick in mosquito populations that cause infections of domestic livestock and human populations. The results is the sea-saw pattern exhibited by the ENSO events drives patterns of disease outbreaks in different regions around the world. To learn more about the relationship between ENSO and Rift Valley fever outbreaks in the region of South Africa, please refer to:
- ENSO Teleconnections and Rift Valley fever (RVF) Outbreaks
- Precipitation Anomaly and Rift Valley fever (RVF) outbreaks in South Africa: 2008-2011
- Vegetation Index Anomalies and Rift Valley fever (RVF) outbreaks in South Africa region: 2008-2011
The strong relationship between ENSO events (i.e El Niño, La Niña) and disease outbreaks underscores the importance of seasonal forecasts. Since disease outbreaks typically manifest 2-3 months after the start of ENSO events, early and regular climate monitoring, paired with the use of monthly and seasonal climate forecasts become significant tools for disease control and prevention. Findings of the scientific study suggest that by monitoring monthly climate datasets, country public health agencies and organizations such as the United Nations' World Health Organization and Food and Agriculture Organizations, can utilize early warning forecasts to undertake preventive measures to minimize the spread of ecologically coupled diseases.
Data Sources:
- Sea Surface Temperature (SST) data: The SST known as the NOAA OI.v2 SST monthly fields are derived by a linear interpolation of the weekly optimum interpolation (OI) version 2 fields to daily fields then averaging the daily values over a month. The analysis uses in situ and satellite SST's plus SST's simulated by sea-ice cover. Before the analysis is computed, the satellite data is adjusted for biases using the method of Reynolds (1988) and Reynolds and Marsico (1993). The SST dataset is available here
- Disease Outbreak data were collected from the Program for Monitoring Emerging Diseases (ProMED), the Pan-American Health Organization (PAHO) online country reports, weekly summaries of disease outbreaks reported by the Department of Defense Armed Forces Health Surveillance Branch and from the World Organisation for Animal Health/Organisation mondiale de la santé animale (OIE).
- SST ENSO index (Niño 3.4) for the period 2009-2018 is obtained from the NOAA National Center for Climate Prediction on-line archives. The warm (El Niño) and cold (La Niña) periods of ENSO events were determined using the Oceanic Niño Index (ONI) threshold of +/- 0.5°C based on centered 30-year base periods updated every 5 years. The ONI is a 3-month running mean of Extended Reconstructed Sea Surface Temperature (ERSST) Version 4 (v4) SST anomalies in the Niño 3.4 region (5 N-5 S, 120W-170W).
Supported with funding from the Defense Threat Reduction Agency's (DTRA) Joint Science and Technology Office for Chemical and Biological Defense (JSTO-CBD) Biosurveillance Ecosystem (BSVE) Program (HDTRA1-16-C-0045) and the Defense Health Agency-Armed Forces Health Surveillance Branch (AFHSB) Global Emerging Infections Surveillance and Response System (GEIS) under Project # P0072_19_NS.
This webpage provides frames, movies, colorbar information and layers associated with the development of this data visualization.
Older Version
Alternate Version
Related

Visualization Credits
Lead Visualizer:
Helen-Nicole Kostis (USRA)
Visualizer:
Greg Shirah (NASA/GSFC)
Lead Scientists:
Assaf Anyamba (USRA)
Radina Soebiyanto (USRA)
Science Support:
Jennifer Small (SSAI)
Technical Support:
Laurence Schuler (ADNET Systems, Inc.)
Ian Jones (ADNET Systems, Inc.)
Project Support:
Leann Johnson (Global Science and Technology, Inc.)
Eric Sokolowsky (Global Science and Technology, Inc.)
Outbreak Data Curators:
Sarah Hutchinson (Intern)
Destini Garrison (Intern)
Please give credit for this item to:
NASA's Scientific Visualization Studio
NASA's Scientific Visualization Studio
Science Paper:
Anyamba, A., Chretien, J-P., Britch,S.C.,Soebiyanto, R.P., Small, J. L., Jepsen, P., Forshey, B.M., Sanchez, J.L., Smith, R.D., Harris, R., Tucker, C.J., Karesh, W.B., Linthicum, K.J. (2019). Global Disease Outbreaks Associated with the 2015-2016 El Niño Event. Nature Scientific Reports. 9:1930 | 10.1038/s41598-018-38034-z
Short URL to share this page:
https://svs.gsfc.nasa.gov/4781
Data Used:
Note: While we identify the data sets used in these visualizations, we do not store any further details nor the data sets themselves on our site.
Keywords:
DLESE >> Climatology
SVS >> El Nino
DLESE >> Environmental science
DLESE >> Human geography
SVS >> SST Anomaly
SVS >> Sea Surface Temperature Anomaly
GCMD >> Earth Science >> Climate Indicators >> Drought Indices
GCMD >> Earth Science >> Climate Indicators >> Precipitation Indices
GCMD >> Earth Science >> Climate Indicators >> Teleconnections >> El Nino Southern Oscillation
GCMD >> Earth Science >> Human Dimensions >> Human Health >> Diseases/Epidemics
GCMD >> Earth Science >> Human Dimensions >> Human Health >> Public Health
SVS >> Hyperwall
NASA Science >> Earth
GCMD >> Earth Science >> Climate Indicators >> Atmospheric/ocean Indicators >> Sea Surface Temperature Indices
GCMD >> Earth Science >> Human Dimensions >> Public Health >> Diseases/epidemics
SVS >> Diseases
NASA Earth Science Focus Areas >> Climate Variability and Change
GCMD keywords can be found on the Internet with the following citation: Olsen, L.M., G. Major, K. Shein, J. Scialdone, S. Ritz, T. Stevens, M. Morahan, A. Aleman, R. Vogel, S. Leicester, H. Weir, M. Meaux, S. Grebas, C.Solomon, M. Holland, T. Northcutt, R. A. Restrepo, R. Bilodeau, 2013. NASA/Global Change Master Directory (GCMD) Earth Science Keywords. Version 8.0.0.0.0
Anyamba, A., Chretien, J-P., Britch,S.C.,Soebiyanto, R.P., Small, J. L., Jepsen, P., Forshey, B.M., Sanchez, J.L., Smith, R.D., Harris, R., Tucker, C.J., Karesh, W.B., Linthicum, K.J. (2019). Global Disease Outbreaks Associated with the 2015-2016 El Niño Event. Nature Scientific Reports. 9:1930 | 10.1038/s41598-018-38034-z
Short URL to share this page:
https://svs.gsfc.nasa.gov/4781
Data Used:
NOAA/Monthly Sea Surface Temperature (SST) OI.v2 also referred to as: NOAA OI.v2 SST
NOAA - 2009-2018NOAA Climate Prediction Center/Monthly Sea Surface Temperature (SST) ENSO Index (Niño 3.4)
NOAA - 2009-2018Disease Outbreak Data from the Program for Monitoring Emerging Diseases (ProMED) also referred to as: ProMED Disease Outbreak Data
ProMED - 2009-2018Disease Outbreak Data from Pan-American Health Organization (PAHO)
Pan-American Health Organization (PAHO) - 2009-2018Disease Outbreak Data from the World Organisation for Animal Health/Organisation mondiale de la santé animale (OIE)
World Organisation for Animal Health/Organisation mondiale de la santé animale (OIE) - 2009-2018Keywords:
DLESE >> Climatology
SVS >> El Nino
DLESE >> Environmental science
DLESE >> Human geography
SVS >> SST Anomaly
SVS >> Sea Surface Temperature Anomaly
GCMD >> Earth Science >> Climate Indicators >> Drought Indices
GCMD >> Earth Science >> Climate Indicators >> Precipitation Indices
GCMD >> Earth Science >> Climate Indicators >> Teleconnections >> El Nino Southern Oscillation
GCMD >> Earth Science >> Human Dimensions >> Human Health >> Diseases/Epidemics
GCMD >> Earth Science >> Human Dimensions >> Human Health >> Public Health
SVS >> Hyperwall
NASA Science >> Earth
GCMD >> Earth Science >> Climate Indicators >> Atmospheric/ocean Indicators >> Sea Surface Temperature Indices
GCMD >> Earth Science >> Human Dimensions >> Public Health >> Diseases/epidemics
SVS >> Diseases
NASA Earth Science Focus Areas >> Climate Variability and Change
GCMD keywords can be found on the Internet with the following citation: Olsen, L.M., G. Major, K. Shein, J. Scialdone, S. Ritz, T. Stevens, M. Morahan, A. Aleman, R. Vogel, S. Leicester, H. Weir, M. Meaux, S. Grebas, C.Solomon, M. Holland, T. Northcutt, R. A. Restrepo, R. Bilodeau, 2013. NASA/Global Change Master Directory (GCMD) Earth Science Keywords. Version 8.0.0.0.0


