Earth
ID: 4697
El Niño-Southern Oscillation (ENSO) is an irregularly recurring climate pattern characterized by warmer (El Niño) and colder (La Niña) than usual ocean temperatures in the equatorial eastern Pacific, which creates a ripple effect of anticipated weather changes in far-spread regions on our planet. Weather changes associated with the ENSO phenomenon result in climate anomalies related to each other, such as rainfall (increase or lack of thereof) and land surface temperature anomaly conditions that trigger outbreaks of infectious diseases of public health concern in different regions around the world. These distant weather effects are called teleconnections. Therefore, the effects of ENSO are called ENSO teleconnections, highlighting that warmer or colder than usual ocean temperatures in the equatorial Pacific Ocean with extents (5N-5S, 120W-170W) affect areas far from the source typically 2-3 months after.
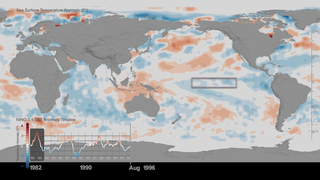
During the last 20 years NASA scientist Dr. Assaf Anyamba and colleagues have been tracking ENSO events (please see: Niño 3.4 Index and Sea Surface Temperature Anomaly Timeline: 1982-2017) and studying associated teleconnections by monitoring various climate datasets, among them Sea Surface Temperature, Precipitation and Land Surface Anomaly datasets from NASA and National Oceanic and Atmospheric Administration (NOAA). At the same time, the science team has been collecting, cataloguing and analyzing patterns and sources of infectious disease outbreaks worldwide.
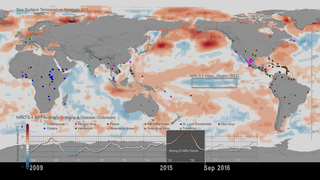
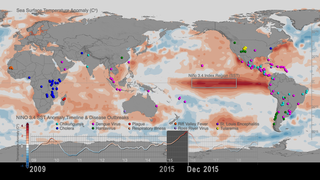
Dr. Anyamba and colleagues conducted a scientific study - the first one to comprehensively assess the public health impacts of the major climate event on a global scale - that was open access published in the journal Nature Scientific Reports, with the title Global Disease Outbreaks Associated with the 2015-2016 El Niño event. According to the study, the 2015-2016 El Niño event brought weather conditions that triggered infectious disease outbreaks in ENSO teleconnected regions around the world, such as plague and hantavirus in Colorado and New Mexico (in 2015), cholera in East Africa’s Tanzania (during 2015- 2016), and dengue fever in Brazil and Southeast Asia (during 2015) among others. These outbreaks have been visualized with data in web entry: Sea Surface Temperature anomalies and patterns of Global Disease Outbreaks: 2009-2018 (4K version)).
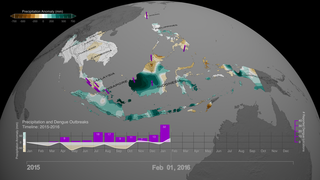
The data visualization featured on this page with corresponding multiplot graph illustrates the relationship between the 2015-2016 El Niño event and the amplification of dengue outbreaks over the region of South East Asia for the same period. The visualization comprises of two parts:
Top:
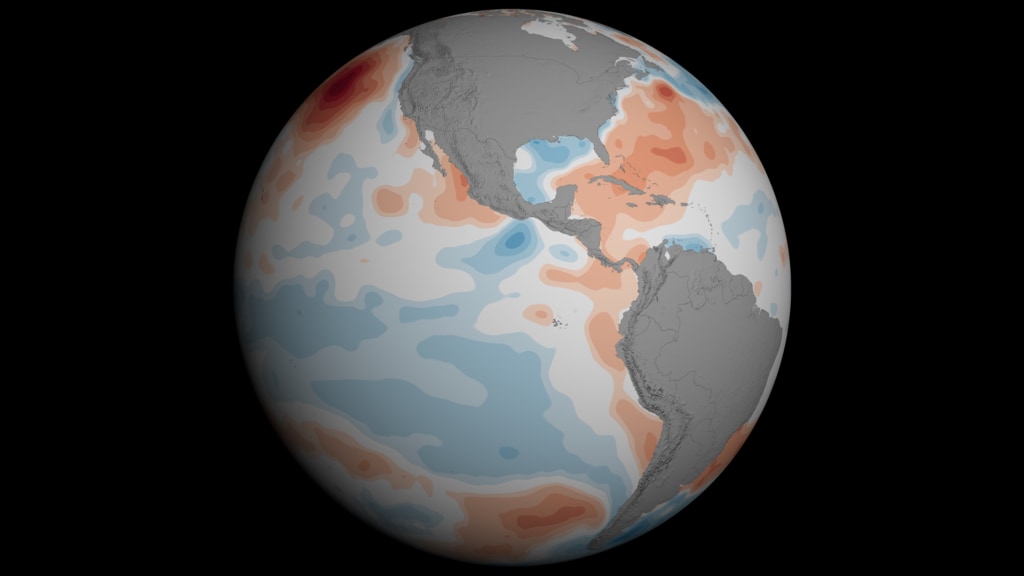
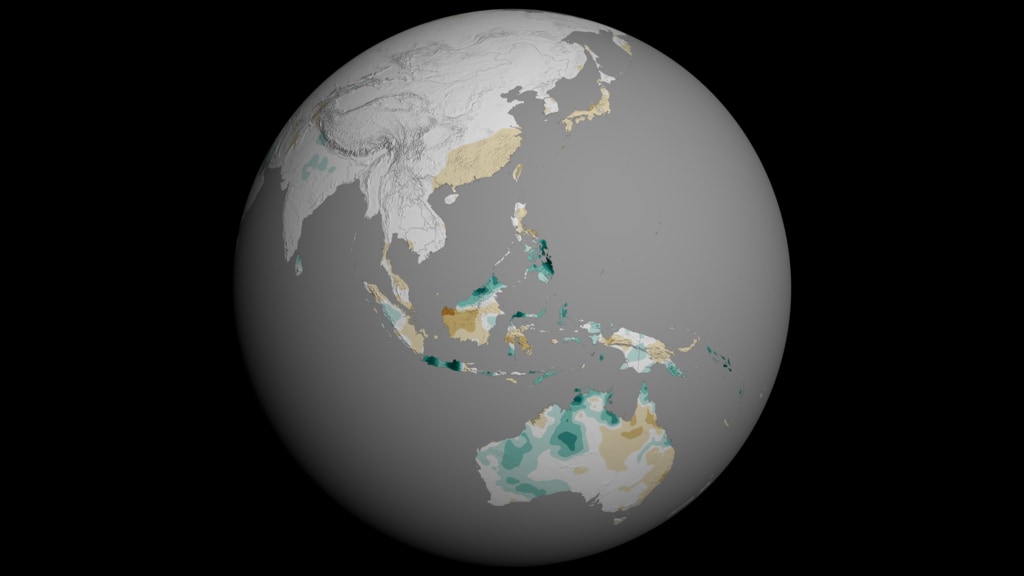
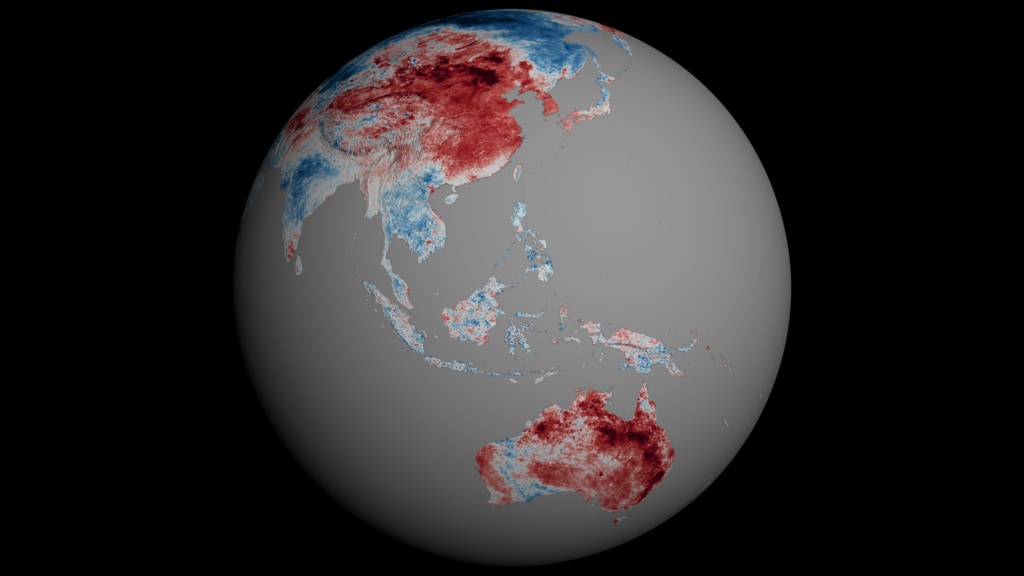
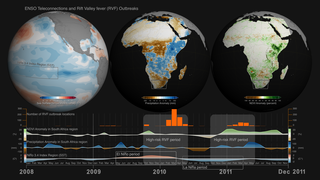
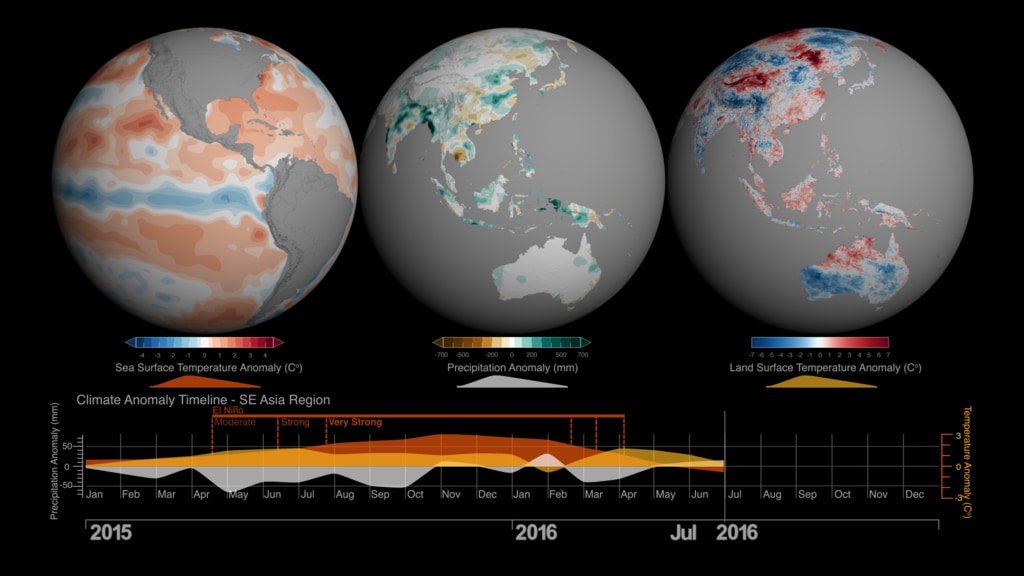
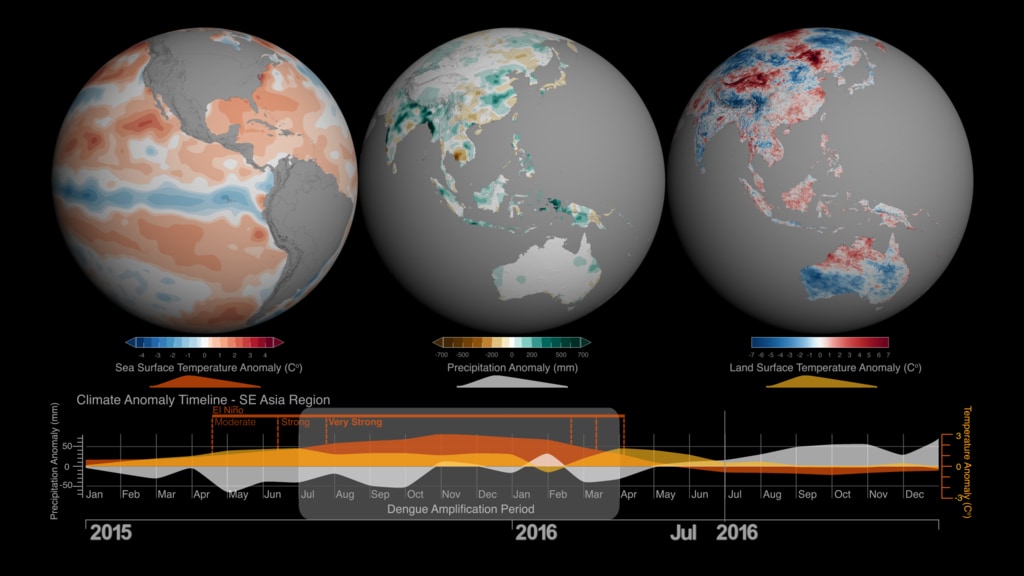
On the top part we can see three separate representations of Earth (spheres) with three distinct datasets. On the left sphere Sea Surface Temperature (SST) anomaly data are mapped over water and our planet is rotated so that we can observe changes of temperature (increase/red hues, decrease/blue hues) over the equatorial Pacific Ocean. The strong ENSO (El Niño) event during May 2015-May 2016 is manifested in the visualization as increased temperature over water (red hues) in the equatorial Pacific Ocean, where the Nino 3.4 Index SST region (5N-5S, 120W-170W) is located. In the middle sphere, our planet is rotated so that we can see Precipitation anomaly data (dry/brown to wet/teal) over land in the South East Asia region. On the right sphere, Land Surface Temperature (LST) anomaly data (low/blue to high/red) are mapped on land.
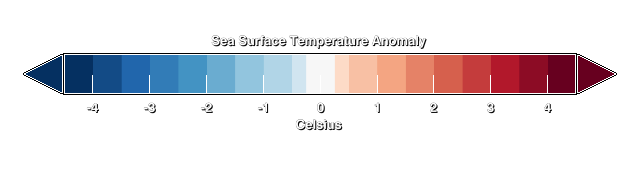
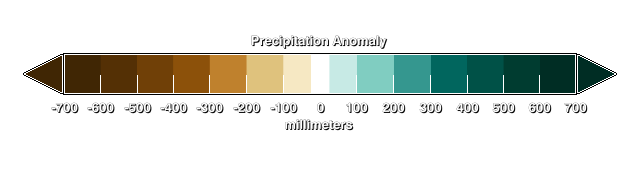
The three distinct representations of each dataset are accompanied right below each sphere with the corresponding colorbar information (for example, Sea Surface Temperature colorbar, Precipitation Anomaly colorbar and Land Surface Temperature Anomaly colorbar)
Bottom:
On the bottom, a synchronized multiplot of Precipitation Anomaly (mm) and Temperature Anomaly (Co ) for the same period, tracks and visualizes indicators from three sources represented in the top part of the visualization. The three indicators are:
The multiplot references both temperature-related anomaly datasets: Sea Surface Temperature (SST) Anomaly and Land Surface Temperature (LST) Anomaly data to the right axis of the multiplot. Temperature Anomaly values are referenced to the left axis of the multiplot. The overall design of this data visualization was chosen in an effort to make visible the relationships between the three datasets and their indicators concurrently. As time progresses, labels and visual cues in the multiplot guide the viewer about the occurrence and duration of the El Niño event, its different phases (Moderate, Strong, Very Strong) and the Dengue Amplification Period.
To explain a bit further the weather patterns and teleconnections, lets take a closer look at the sequence of events and their timelines. The El Niño event (May 2015-May 2016) is manifested over the equatorial Pacific Ocean, as increased temperature (left sphere, red hues) on the top part of the visualization and with the orange area graph on the bottom. During the same period, the South East Asia region receives below than normal precipitation (middle sphere, brown hues) resulting in drier than usual conditions, which in turn caused an anomalous increase in land surface temperature (left sphere, red hues). The dry and hot conditions in the South East Asia region were conducive for the upsurge in populations of mosquito vectors in urban areas, where there are open water storage containers providing ideal habitats for mosquito production. In addition, the higher than normal temperature on land shortens the maturation time of larvae to adult mosquitos and induces frequent blood feeding/biting of humans by mosquito vectors, resulting in the Dengue Amplification Period (July 2015-March 2016) over the South East Asia region. Dengue fever is a painful, debilitating disease and is transmitted between people by mosquito vectors. It is a predominantly tropical disease affecting approximately 400 million people annually in many areas of the global tropics including South America and South East Asia. Dengue epidemics worldwide occur in urban areas where there is a coincidence of large numbers of dengue vectors (Aedes aegypti) and people with no immunity to one of the virus types.
The impact of precipitation and land surface temperature anomalies on the dengue outbreaks over the South East Asia region have been visualized with data on the following two web entries:
The strong relationship between ENSO events and disease outbreaks underscores the importance of seasonal forecasts. Since disease outbreaks typically manifest 2-3 months after the start of El Niño and La Nina events, early and regular climate monitoring, paired with the use of monthly and seasonal climate forecasts become significant tools for disease control and prevention. Findings of the scientific study by Dr. Assaf Anyamba and colleagues, suggests that by monitoring monthly climate datasets, country public health agencies such as CDC and international organizations such as the United Nations' World Health Organization and Food and Agriculture Organizations, can utilize early warning forecasts to undertake preventive measures to minimize the spread of ecologically coupled diseases.
Data Sources
Supported with funding from the Defense Threat Reduction Agency's (DTRA) Joint Science and Technology Office for Chemical and Biological Defense (JSTO-CBD) Biosurveillance Ecosystem (BSVE) Program (HDTRA1-16-C-0045) and the Defense Health Agency-Armed Forces Health Surveillance Branch (AFHSB) Global Emerging Infections Surveillance and Response System (GEIS) under Project # P0072_19_NS.
The rest of this webpage offers additional versions, frames, layers and colorbar information associated with the development of this data-driven visualization.


ENSO teleconnections in South East Asia for the period of 2015-2016
During the last 20 years NASA scientist Dr. Assaf Anyamba and colleagues have been tracking ENSO events (please see: Niño 3.4 Index and Sea Surface Temperature Anomaly Timeline: 1982-2017) and studying associated teleconnections by monitoring various climate datasets, among them Sea Surface Temperature, Precipitation and Land Surface Anomaly datasets from NASA and National Oceanic and Atmospheric Administration (NOAA). At the same time, the science team has been collecting, cataloguing and analyzing patterns and sources of infectious disease outbreaks worldwide.
Dr. Anyamba and colleagues conducted a scientific study - the first one to comprehensively assess the public health impacts of the major climate event on a global scale - that was open access published in the journal Nature Scientific Reports, with the title Global Disease Outbreaks Associated with the 2015-2016 El Niño event. According to the study, the 2015-2016 El Niño event brought weather conditions that triggered infectious disease outbreaks in ENSO teleconnected regions around the world, such as plague and hantavirus in Colorado and New Mexico (in 2015), cholera in East Africa’s Tanzania (during 2015- 2016), and dengue fever in Brazil and Southeast Asia (during 2015) among others. These outbreaks have been visualized with data in web entry: Sea Surface Temperature anomalies and patterns of Global Disease Outbreaks: 2009-2018 (4K version)).
The data visualization featured on this page with corresponding multiplot graph illustrates the relationship between the 2015-2016 El Niño event and the amplification of dengue outbreaks over the region of South East Asia for the same period. The visualization comprises of two parts:
Top:
On the top part we can see three separate representations of Earth (spheres) with three distinct datasets. On the left sphere Sea Surface Temperature (SST) anomaly data are mapped over water and our planet is rotated so that we can observe changes of temperature (increase/red hues, decrease/blue hues) over the equatorial Pacific Ocean. The strong ENSO (El Niño) event during May 2015-May 2016 is manifested in the visualization as increased temperature over water (red hues) in the equatorial Pacific Ocean, where the Nino 3.4 Index SST region (5N-5S, 120W-170W) is located. In the middle sphere, our planet is rotated so that we can see Precipitation anomaly data (dry/brown to wet/teal) over land in the South East Asia region. On the right sphere, Land Surface Temperature (LST) anomaly data (low/blue to high/red) are mapped on land.
The three distinct representations of each dataset are accompanied right below each sphere with the corresponding colorbar information (for example, Sea Surface Temperature colorbar, Precipitation Anomaly colorbar and Land Surface Temperature Anomaly colorbar)
Bottom:
On the bottom, a synchronized multiplot of Precipitation Anomaly (mm) and Temperature Anomaly (Co ) for the same period, tracks and visualizes indicators from three sources represented in the top part of the visualization. The three indicators are:
- Monthly Sea Surface Temperature (SST) Anomaly data (°C) for the Niño 3.4 Index region over the equatorial Pacific with extents (5N-5S, 120W-170W). Represented in the multiplot as the orange area graph.
- Monthly Precipitation Anomaly data (mm) for the South East (SE) Asia Region (Myanmar, Vietnam, Laos, Thailand, Cambodia, Malaysia, Singapore, Indonesia). Represented in the multiplot as the grey area graph.
- Monthly Land Surface Temperature (LST) Anomaly data (°C) for the South East (SE) Asia Region (Myanmar, Vietnam, Laos, Thailand, Cambodia, Malaysia, Singapore, Indonesia). Represented in the multiplot as the yellow area graph.
The multiplot references both temperature-related anomaly datasets: Sea Surface Temperature (SST) Anomaly and Land Surface Temperature (LST) Anomaly data to the right axis of the multiplot. Temperature Anomaly values are referenced to the left axis of the multiplot. The overall design of this data visualization was chosen in an effort to make visible the relationships between the three datasets and their indicators concurrently. As time progresses, labels and visual cues in the multiplot guide the viewer about the occurrence and duration of the El Niño event, its different phases (Moderate, Strong, Very Strong) and the Dengue Amplification Period.
To explain a bit further the weather patterns and teleconnections, lets take a closer look at the sequence of events and their timelines. The El Niño event (May 2015-May 2016) is manifested over the equatorial Pacific Ocean, as increased temperature (left sphere, red hues) on the top part of the visualization and with the orange area graph on the bottom. During the same period, the South East Asia region receives below than normal precipitation (middle sphere, brown hues) resulting in drier than usual conditions, which in turn caused an anomalous increase in land surface temperature (left sphere, red hues). The dry and hot conditions in the South East Asia region were conducive for the upsurge in populations of mosquito vectors in urban areas, where there are open water storage containers providing ideal habitats for mosquito production. In addition, the higher than normal temperature on land shortens the maturation time of larvae to adult mosquitos and induces frequent blood feeding/biting of humans by mosquito vectors, resulting in the Dengue Amplification Period (July 2015-March 2016) over the South East Asia region. Dengue fever is a painful, debilitating disease and is transmitted between people by mosquito vectors. It is a predominantly tropical disease affecting approximately 400 million people annually in many areas of the global tropics including South America and South East Asia. Dengue epidemics worldwide occur in urban areas where there is a coincidence of large numbers of dengue vectors (Aedes aegypti) and people with no immunity to one of the virus types.
The impact of precipitation and land surface temperature anomalies on the dengue outbreaks over the South East Asia region have been visualized with data on the following two web entries:
- Precipitation Anomaly and Dengue Outbreaks in South East Asia: 2015-2016
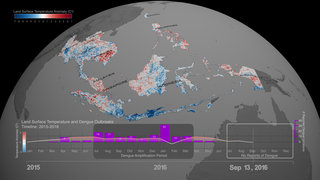
- Land Surface Temperature Anomaly and Dengue Outbreaks in South East Asia Region: 2015-2016
The strong relationship between ENSO events and disease outbreaks underscores the importance of seasonal forecasts. Since disease outbreaks typically manifest 2-3 months after the start of El Niño and La Nina events, early and regular climate monitoring, paired with the use of monthly and seasonal climate forecasts become significant tools for disease control and prevention. Findings of the scientific study by Dr. Assaf Anyamba and colleagues, suggests that by monitoring monthly climate datasets, country public health agencies such as CDC and international organizations such as the United Nations' World Health Organization and Food and Agriculture Organizations, can utilize early warning forecasts to undertake preventive measures to minimize the spread of ecologically coupled diseases.
Data Sources
- Sea Surface Temperature Anomaly (global, monthly time series: 1982-2017)
Global monthly SST data known as Optimum Interpolation (OI) SST version 2 dataset produced by NOAA can be accessed from: https://www.ncdc.noaa.gov/oisst - Precipitation Anomaly data (global and subset of SE Asia region, monthly time series: 2002-2017) Global Precipitation Climatology Project (GPCP) Global 1° Monitoring Product, available at
ftp://ftp-anon.dwd.de/pub/data/gpcc/html/monitoring_ download.html - Land Surface Temperature (LST) Anomaly data (global, monthly time series: 2002-2017) Global monthly 0.05° LST MOD11C3 data is available at: https://lpdaac.usgs.gov/dataset_discovery/modis/modis_products_table/mod11c3
- Dengue outbreak data are georeferenced as sourced from global disease occurrences at the Program for Monitoring Emerging Diseases (ProMED). Dengue outbreak reports defined the Dengue Amplification Period.
- Niño 3.4 Sea Surface Temperature (SST) ENSO index for the period 2015-2016 is obtained from the NOAA National Center for Climate Prediction online archives.The warm (El Niño) and cold (La Niña) periods of ENSO events were determined using the Oceanic Niño Index (ONI) threshold of +/- 0.5Co based on centered 30-year base periods updated every 5 years. The ONI is a 3-month running mean of Extended Reconstructed Sea Surface Temperature (ERSST) Version 4 (v4) SST anomalies in the Niño 3.4 region (5 N-5 S, 120W-170W).
Supported with funding from the Defense Threat Reduction Agency's (DTRA) Joint Science and Technology Office for Chemical and Biological Defense (JSTO-CBD) Biosurveillance Ecosystem (BSVE) Program (HDTRA1-16-C-0045) and the Defense Health Agency-Armed Forces Health Surveillance Branch (AFHSB) Global Emerging Infections Surveillance and Response System (GEIS) under Project # P0072_19_NS.
The rest of this webpage offers additional versions, frames, layers and colorbar information associated with the development of this data-driven visualization.
Used Elsewhere In

Related


Visualization Credits
Lead Visualizer:
Helen-Nicole Kostis (USRA)
Lead Scientists:
Assaf Anyamba (USRA)
Radina Soebiyanto (USRA)
Science Support:
Jennifer Small (SSAI)
Lead Producers:
Matthew R. Radcliff (USRA)
Helen-Nicole Kostis (USRA)
Lead Writer:
Samson K. Reiny (Wyle Information Systems)
Technical Support:
Laurence Schuler (ADNET Systems, Inc.)
Ian Jones (ADNET Systems, Inc.)
Project Support:
Joycelyn Thomson Jones (NASA/GSFC)
Leann Johnson (Global Science and Technology, Inc.)
Eric Sokolowsky (Global Science and Technology, Inc.)
Helen-Nicole Kostis (USRA)
Lead Scientists:
Assaf Anyamba (USRA)
Radina Soebiyanto (USRA)
Science Support:
Jennifer Small (SSAI)
Lead Producers:
Matthew R. Radcliff (USRA)
Helen-Nicole Kostis (USRA)
Lead Writer:
Samson K. Reiny (Wyle Information Systems)
Technical Support:
Laurence Schuler (ADNET Systems, Inc.)
Ian Jones (ADNET Systems, Inc.)
Project Support:
Joycelyn Thomson Jones (NASA/GSFC)
Leann Johnson (Global Science and Technology, Inc.)
Eric Sokolowsky (Global Science and Technology, Inc.)
Please give credit for this item to:
NASA's Scientific Visualization Studio
NASA's Scientific Visualization Studio
Science Paper:
Assaf Anyamba, Jean-Paul Chretien, Seth C. Britch, Radina P. Soebiyanto, Jennifer L. Small, Rikke Jepsen, Brett M. Forshey, Jose L. Sanchez, Ryan D. Smith, Ryan Harris, Compton J. Tucker, William B. Karesh & Kenneth J. Linthicum, "Global Disease Outbreaks Associated with the 2015–2016 El Niño Event", Scientific Reports, Volume 9, Article number: 1930 (2019). The paper is freely available online at: www.nature.com/articles/s41598-018-38034-z
Short URL to share this page:
https://svs.gsfc.nasa.gov/4697
Data Used:
Note: While we identify the data sets used in these visualizations, we do not store any further details nor the data sets themselves on our site.
Keywords:
DLESE >> Climatology
SVS >> El Nino
DLESE >> Environmental science
DLESE >> Human geography
SVS >> SST Anomaly
GCMD >> Earth Science >> Climate Indicators >> Drought Indices
GCMD >> Earth Science >> Climate Indicators >> Precipitation Indices
GCMD >> Earth Science >> Climate Indicators >> Teleconnections >> El Nino Southern Oscillation
GCMD >> Earth Science >> Human Dimensions >> Human Health >> Diseases/Epidemics
GCMD >> Earth Science >> Human Dimensions >> Human Health >> Public Health
SVS >> Hyperwall
NASA Science >> Earth
GCMD >> Earth Science >> Human Dimensions >> Public Health >> Diseases/epidemics
SVS >> Diseases
SVS >> Land Surface Temperature Anomaly
GCMD keywords can be found on the Internet with the following citation: Olsen, L.M., G. Major, K. Shein, J. Scialdone, S. Ritz, T. Stevens, M. Morahan, A. Aleman, R. Vogel, S. Leicester, H. Weir, M. Meaux, S. Grebas, C.Solomon, M. Holland, T. Northcutt, R. A. Restrepo, R. Bilodeau, 2013. NASA/Global Change Master Directory (GCMD) Earth Science Keywords. Version 8.0.0.0.0
Places you might have seen this:
"Clouds". Connected - The Hidden Science of Everything, Season 1, Episode 5, 2 Aug. 2020, Netflix
Assaf Anyamba, Jean-Paul Chretien, Seth C. Britch, Radina P. Soebiyanto, Jennifer L. Small, Rikke Jepsen, Brett M. Forshey, Jose L. Sanchez, Ryan D. Smith, Ryan Harris, Compton J. Tucker, William B. Karesh & Kenneth J. Linthicum, "Global Disease Outbreaks Associated with the 2015–2016 El Niño Event", Scientific Reports, Volume 9, Article number: 1930 (2019). The paper is freely available online at: www.nature.com/articles/s41598-018-38034-z
Short URL to share this page:
https://svs.gsfc.nasa.gov/4697
Data Used:
N/A/Gauge-based/CPC UNI (Climate Prediction Center (CPC) Global Unified) Precipitation also referred to as: CPC UNI
NOAA
Climate Prediction Center (CPC) Global Unified Precipitation
Multiple/Multisensors including buoys, passive microwave sensors/Oceanic Nino Index (3 month running means of Extended Reconstructed Sea Surface Temperature (ERSST) v5 anomalies also referred to as: Sea Surface Temperature Anomaly (SST)
NOAA
Oceanic Nino Index (3 month running means of Extended Reconstructed Sea Surface Temperature (ERSST) v5 anomalies
Terra/Moderate Resolution Imaging Spectroradiometer (MODIS)/MOD11C3 V006: MODIS/Terra Land Surface Temperature and Emissivity Monthly L3 Global 0.05Deg CMG V006 also referred to as: Land Surface Tempearature Anomaly
NASA
Land Surface Temperature Anomaly MOD11C3 V006: MODIS/Terra Land Surface Temperature and Emissivity Monthly L3 Global 0.05Deg CMG V006
Keywords:
DLESE >> Climatology
SVS >> El Nino
DLESE >> Environmental science
DLESE >> Human geography
SVS >> SST Anomaly
GCMD >> Earth Science >> Climate Indicators >> Drought Indices
GCMD >> Earth Science >> Climate Indicators >> Precipitation Indices
GCMD >> Earth Science >> Climate Indicators >> Teleconnections >> El Nino Southern Oscillation
GCMD >> Earth Science >> Human Dimensions >> Human Health >> Diseases/Epidemics
GCMD >> Earth Science >> Human Dimensions >> Human Health >> Public Health
SVS >> Hyperwall
NASA Science >> Earth
GCMD >> Earth Science >> Human Dimensions >> Public Health >> Diseases/epidemics
SVS >> Diseases
SVS >> Land Surface Temperature Anomaly
GCMD keywords can be found on the Internet with the following citation: Olsen, L.M., G. Major, K. Shein, J. Scialdone, S. Ritz, T. Stevens, M. Morahan, A. Aleman, R. Vogel, S. Leicester, H. Weir, M. Meaux, S. Grebas, C.Solomon, M. Holland, T. Northcutt, R. A. Restrepo, R. Bilodeau, 2013. NASA/Global Change Master Directory (GCMD) Earth Science Keywords. Version 8.0.0.0.0
Places you might have seen this:
"Clouds". Connected - The Hidden Science of Everything, Season 1, Episode 5, 2 Aug. 2020, Netflix


