Earth
ID: 4695
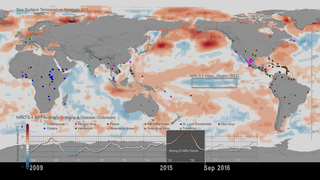
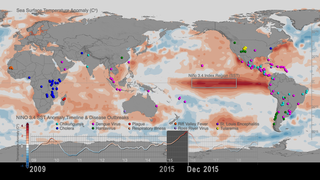
El Niño-Southern Oscillation (ENSO) phenomenon is an irregularly recurring climate pattern characterized by warmer (El Niño) and colder (La Niña) than usual ocean temperatures in the equatorial Pacific Ocean from about the International Date Line to the coast of South America. ENSO (El Niño, La Niña) events create a ripple effect of anticipated weather changes in far-spread regions on Earth. Weather changes associated with the ENSO phenomenon result in rainfall, temperature, vegetation and environmental anomaly conditions worldwide that directly favor outbreaks of infectious diseases of public health concern typically 2-3 months after.
During the last 20 years NASA scientist Dr. Assaf Anyamba and colleagues have been studying interannual climate variability patterns associated with ENSO events by monitoring the Niño 3.4 Index region over the Pacific Ocean (5N-5S, 120W-170W), along with rainfall, land surface temperature and vegetation anomaly data from NASA and NOAA.
Dr. Anyamba and colleagues conducted a scientific study - the first one to comprehensively assess the public health impacts of the major climate event on a global scale - that was open access published in the journal Nature Scientific Reports, with the title Global Disease Outbreaks Associated with the 2015-2016 El Niño event. According to the study, the 2015-2016 El Niño event brought weather conditions that triggered infectious disease outbreaks in teleconnected regions around the world. For example, plague and hantavirus in Colorado and New Mexico (in 2015), cholera in East Africa’s Tanzania (during 2015 and 2016), and dengue fever in Brazil and Southeast Asia (during 2015) among others.
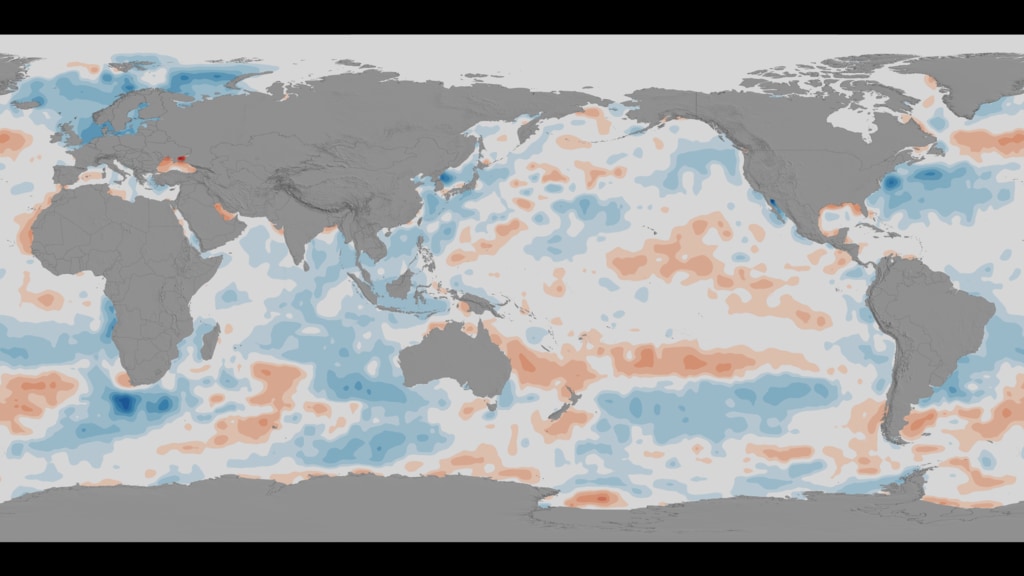
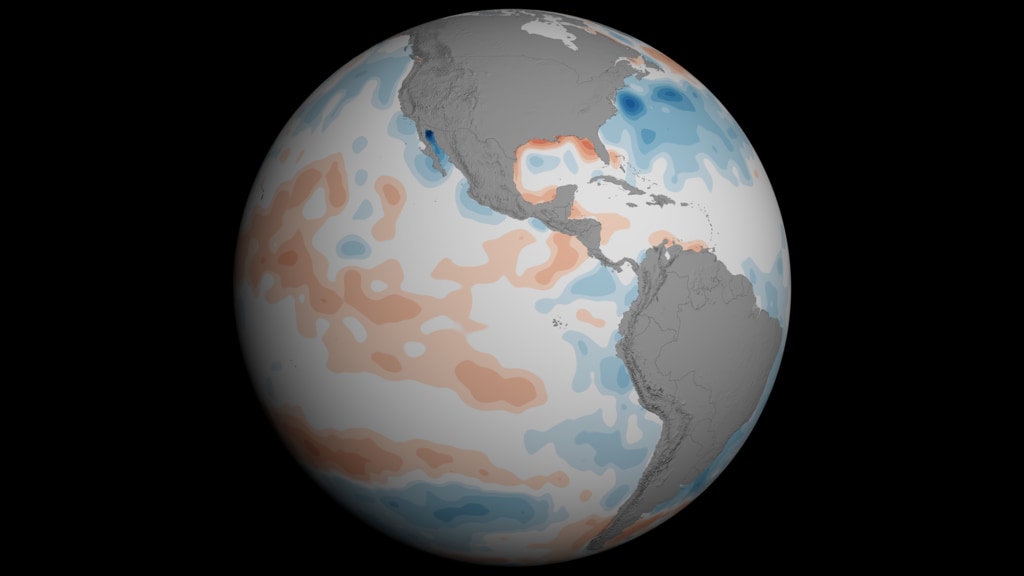
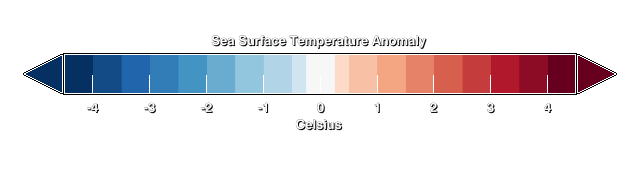
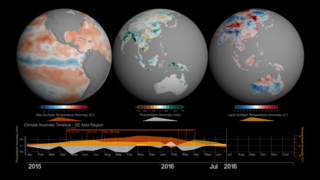
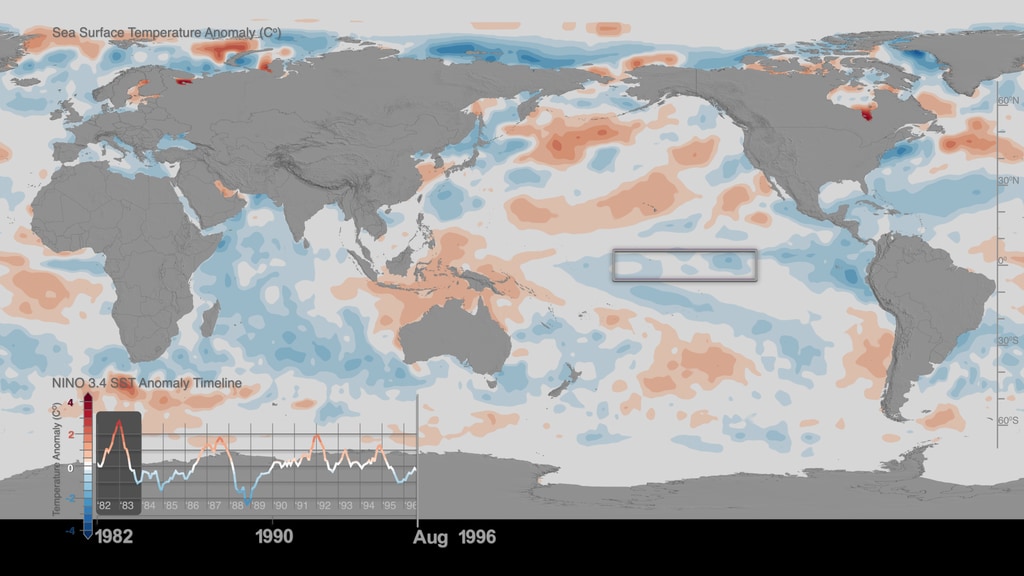
The data visualization featured on this page provides a historical timeline of El Niño events for the period of 1982-2017 and illustrates the relationship between ENSO events (El Niño, La Niña) and the increase (red hues)/decrease (blue hues) of average Sea Surface Temperature (SST) Anomaly data over the Niño 3.4 Index region. The visualization showcases a global flat map with monthly Sea Surface Temperature (SST) anomaly data over water, along with a timeline plot of the ENSO Index (Niño 3.4 Index region SST anomaly) for the same period. The Nino 3.4 Index region SST with extents (5N-5S, 120W-170W) is the box region highlighted over the Pacific Ocean. Highlighted in the timeline are the strong El Niño years, in which Sea Surface Temperature (SST) anomalies peaked: 1982-1983, 1997-1998, and 2015-2016.
To learn more about the relationship between ENSO events and infectious disease outbreaks, please see the following data visualizations:
The strong relationship between ENSO events and disease outbreaks underscores the importance of seasonal forecasts. Since disease outbreaks typically manifest 2-3 months after the start of El Niño and La Niña events, early and regular climate monitoring, paired with the use of monthly and seasonal climate forecasts become significant tools for disease control and prevention. Findings of the scientific study by Dr. Assaf Anyamba and colleagues, suggests that by monitoring monthly climate datasets, country public health agencies and organizations such as the United Nations' World Health Organization and Food and Agriculture Organizations, can utilize early warning forecasts to undertake preventive measures to minimize the spread of ecologically coupled diseases.
Data Sources:
Supported with funding from the Defense Threat Reduction Agency's (DTRA) Joint Science and Technology Office for Chemical and Biological Defense (JSTO-CBD) Biosurveillance Ecosystem (BSVE) Program (HDTRA1-16-C-0045) and the Defense Health Agency-Armed Forces Health Surveillance Branch (AFHSB) Global Emerging Infections Surveillance and Response System (GEIS) under Project # P0072_19_NS.
The rest of this webpage offers frames, layers and colorbar information associated with the development of this data-driven visualization.


Niño 3.4 Index and Sea Surface Temperature Anomaly Timeline: 1982-2017
During the last 20 years NASA scientist Dr. Assaf Anyamba and colleagues have been studying interannual climate variability patterns associated with ENSO events by monitoring the Niño 3.4 Index region over the Pacific Ocean (5N-5S, 120W-170W), along with rainfall, land surface temperature and vegetation anomaly data from NASA and NOAA.
Dr. Anyamba and colleagues conducted a scientific study - the first one to comprehensively assess the public health impacts of the major climate event on a global scale - that was open access published in the journal Nature Scientific Reports, with the title Global Disease Outbreaks Associated with the 2015-2016 El Niño event. According to the study, the 2015-2016 El Niño event brought weather conditions that triggered infectious disease outbreaks in teleconnected regions around the world. For example, plague and hantavirus in Colorado and New Mexico (in 2015), cholera in East Africa’s Tanzania (during 2015 and 2016), and dengue fever in Brazil and Southeast Asia (during 2015) among others.
The data visualization featured on this page provides a historical timeline of El Niño events for the period of 1982-2017 and illustrates the relationship between ENSO events (El Niño, La Niña) and the increase (red hues)/decrease (blue hues) of average Sea Surface Temperature (SST) Anomaly data over the Niño 3.4 Index region. The visualization showcases a global flat map with monthly Sea Surface Temperature (SST) anomaly data over water, along with a timeline plot of the ENSO Index (Niño 3.4 Index region SST anomaly) for the same period. The Nino 3.4 Index region SST with extents (5N-5S, 120W-170W) is the box region highlighted over the Pacific Ocean. Highlighted in the timeline are the strong El Niño years, in which Sea Surface Temperature (SST) anomalies peaked: 1982-1983, 1997-1998, and 2015-2016.
To learn more about the relationship between ENSO events and infectious disease outbreaks, please see the following data visualizations:
- Sea Surface Temperature anomalies and patterns of Global Disease Outbreaks: 2009-2018 (4K version)
- Teleconnections in South East Asia for the period of 2015-2016
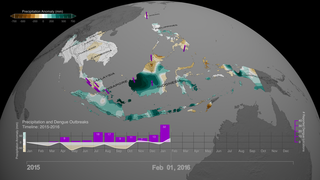
- Precipitation Anomaly and Dengue Outbreaks in South East Asia: 2015-2016
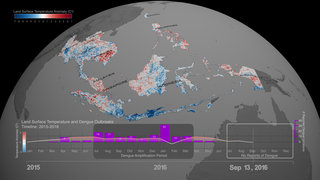
- Land Surface Temperature Anomaly and Dengue Outbreaks in South East Asia Region: 2015-2016
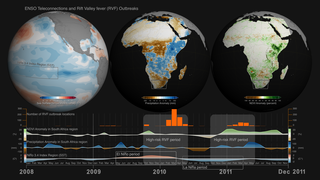
- ENSO Teleconnections and Rift Valley fever (RVF) Outbreaks
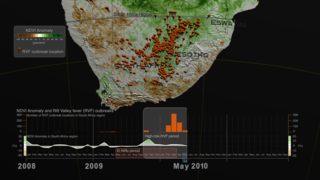
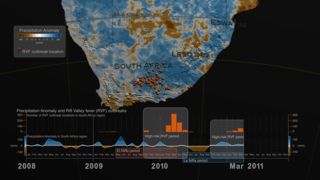
- Precipitation Anomaly and Rift Valley fever (RVF) outbreaks in South Africa: 2008-2011
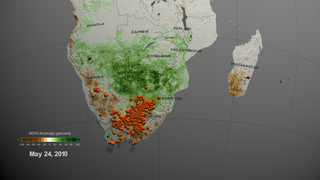
- Vegetation Index Anomalies and Rift Valley fever (RVF) outbreaks in South Africa region: 2008-2011
The strong relationship between ENSO events and disease outbreaks underscores the importance of seasonal forecasts. Since disease outbreaks typically manifest 2-3 months after the start of El Niño and La Niña events, early and regular climate monitoring, paired with the use of monthly and seasonal climate forecasts become significant tools for disease control and prevention. Findings of the scientific study by Dr. Assaf Anyamba and colleagues, suggests that by monitoring monthly climate datasets, country public health agencies and organizations such as the United Nations' World Health Organization and Food and Agriculture Organizations, can utilize early warning forecasts to undertake preventive measures to minimize the spread of ecologically coupled diseases.
Data Sources:
- Sea Surface Temperature Anomaly data (global, monthly time series: 1982-2017)
Global monthly SST data known as Optimum Interpolation (OI) SST version 2 dataset produced by NOAA can be accessed from https://www.ncdc.noaa.gov/oisst - Niño 3.4 Sea Surface Temperature (SST) ENSO index (monthly time series: 1982-2017) is obtained from the NOAA National Center for Climate Prediction online archives. The warm (El Niño) and cold (La Niña) periods of ENSO events were determined using the Oceanic Niño Index (ONI) threshold of +/- 0.5°C based on centered 30-year base periods updated every 5 years. The ONI is a 3-month running mean of Extended Reconstructed Sea Surface Temperature (ERSST) Version 4 (v4) SST anomalies in the Niño 3.4 region (5N-5S, 120W-170W).
Supported with funding from the Defense Threat Reduction Agency's (DTRA) Joint Science and Technology Office for Chemical and Biological Defense (JSTO-CBD) Biosurveillance Ecosystem (BSVE) Program (HDTRA1-16-C-0045) and the Defense Health Agency-Armed Forces Health Surveillance Branch (AFHSB) Global Emerging Infections Surveillance and Response System (GEIS) under Project # P0072_19_NS.
The rest of this webpage offers frames, layers and colorbar information associated with the development of this data-driven visualization.
Used Elsewhere In
Related


Visualization Credits
Lead Visualizer:
Helen-Nicole Kostis (USRA)
Lead Scientists:
Assaf Anyamba (USRA)
Radina Soebiyanto (USRA)
Science Support:
Jennifer Small (SSAI)
Lead Producers:
Matthew R. Radcliff (USRA)
Helen-Nicole Kostis (USRA)
Lead Writer:
Samson K. Reiny (Wyle Information Systems)
Technical Support:
Laurence Schuler (ADNET Systems, Inc.)
Ian Jones (ADNET Systems, Inc.)
Project Support:
Joycelyn Thomson Jones (NASA/GSFC)
Eric Sokolowsky (Global Science and Technology, Inc.)
Leann Johnson (Global Science and Technology, Inc.)
Helen-Nicole Kostis (USRA)
Lead Scientists:
Assaf Anyamba (USRA)
Radina Soebiyanto (USRA)
Science Support:
Jennifer Small (SSAI)
Lead Producers:
Matthew R. Radcliff (USRA)
Helen-Nicole Kostis (USRA)
Lead Writer:
Samson K. Reiny (Wyle Information Systems)
Technical Support:
Laurence Schuler (ADNET Systems, Inc.)
Ian Jones (ADNET Systems, Inc.)
Project Support:
Joycelyn Thomson Jones (NASA/GSFC)
Eric Sokolowsky (Global Science and Technology, Inc.)
Leann Johnson (Global Science and Technology, Inc.)
Please give credit for this item to:
NASA's Scientific Visualization Studio
NASA's Scientific Visualization Studio
Science Paper:
Assaf Anyamba, Jean-Paul Chretien, Seth C. Britch, Radina P. Soebiyanto, Jennifer L. Small, Rikke Jepsen, Brett M. Forshey, Jose L. Sanchez, Ryan D. Smith, Ryan Harris, Compton J. Tucker, William B. Karesh & Kenneth J. Linthicum, "Global Disease Outbreaks Associated with the 2015–2016 El Niño Event", Scientific Reports, Volume 9, Article number: 1930 (2019). The paper is freely available online at: www.nature.com/articles/s41598-018-38034-z
Short URL to share this page:
https://svs.gsfc.nasa.gov/4695
Data Used:
Note: While we identify the data sets used in these visualizations, we do not store any further details nor the data sets themselves on our site.
Keywords:
DLESE >> Climatology
SVS >> El Nino
DLESE >> Environmental science
DLESE >> Human geography
SVS >> SST Anomaly
GCMD >> Earth Science >> Climate Indicators >> Drought Indices
GCMD >> Earth Science >> Climate Indicators >> Precipitation Indices
GCMD >> Earth Science >> Climate Indicators >> Teleconnections >> El Nino Southern Oscillation
GCMD >> Earth Science >> Human Dimensions >> Human Health >> Diseases/Epidemics
GCMD >> Earth Science >> Human Dimensions >> Human Health >> Public Health
SVS >> Hyperwall
NASA Science >> Earth
GCMD >> Earth Science >> Human Dimensions >> Public Health >> Diseases/epidemics
SVS >> Diseases
NASA Earth Science Focus Areas >> Climate Variability and Change
GCMD keywords can be found on the Internet with the following citation: Olsen, L.M., G. Major, K. Shein, J. Scialdone, S. Ritz, T. Stevens, M. Morahan, A. Aleman, R. Vogel, S. Leicester, H. Weir, M. Meaux, S. Grebas, C.Solomon, M. Holland, T. Northcutt, R. A. Restrepo, R. Bilodeau, 2013. NASA/Global Change Master Directory (GCMD) Earth Science Keywords. Version 8.0.0.0.0
Assaf Anyamba, Jean-Paul Chretien, Seth C. Britch, Radina P. Soebiyanto, Jennifer L. Small, Rikke Jepsen, Brett M. Forshey, Jose L. Sanchez, Ryan D. Smith, Ryan Harris, Compton J. Tucker, William B. Karesh & Kenneth J. Linthicum, "Global Disease Outbreaks Associated with the 2015–2016 El Niño Event", Scientific Reports, Volume 9, Article number: 1930 (2019). The paper is freely available online at: www.nature.com/articles/s41598-018-38034-z
Short URL to share this page:
https://svs.gsfc.nasa.gov/4695
Data Used:
Multiple/Multisensors including buoys, passive microwave sensors/Oceanic Nino Index (3 month running means of Extended Reconstructed Sea Surface Temperature (ERSST) v5 anomalies also referred to as: Sea Surface Temperature Anomaly (SST)
NOAA
Oceanic Nino Index (3 month running means of Extended Reconstructed Sea Surface Temperature (ERSST) v5 anomalies
Keywords:
DLESE >> Climatology
SVS >> El Nino
DLESE >> Environmental science
DLESE >> Human geography
SVS >> SST Anomaly
GCMD >> Earth Science >> Climate Indicators >> Drought Indices
GCMD >> Earth Science >> Climate Indicators >> Precipitation Indices
GCMD >> Earth Science >> Climate Indicators >> Teleconnections >> El Nino Southern Oscillation
GCMD >> Earth Science >> Human Dimensions >> Human Health >> Diseases/Epidemics
GCMD >> Earth Science >> Human Dimensions >> Human Health >> Public Health
SVS >> Hyperwall
NASA Science >> Earth
GCMD >> Earth Science >> Human Dimensions >> Public Health >> Diseases/epidemics
SVS >> Diseases
NASA Earth Science Focus Areas >> Climate Variability and Change
GCMD keywords can be found on the Internet with the following citation: Olsen, L.M., G. Major, K. Shein, J. Scialdone, S. Ritz, T. Stevens, M. Morahan, A. Aleman, R. Vogel, S. Leicester, H. Weir, M. Meaux, S. Grebas, C.Solomon, M. Holland, T. Northcutt, R. A. Restrepo, R. Bilodeau, 2013. NASA/Global Change Master Directory (GCMD) Earth Science Keywords. Version 8.0.0.0.0


