Earth
ID: 4609
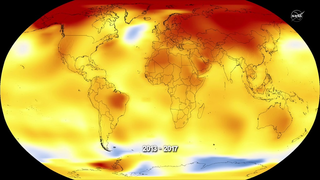
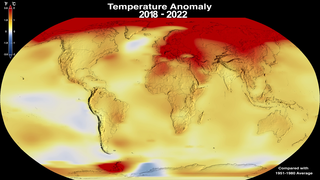
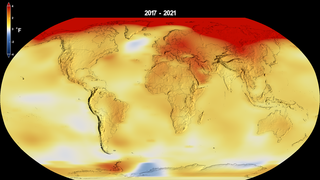
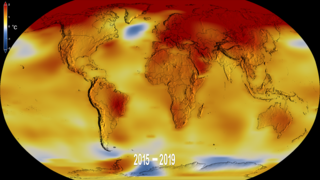
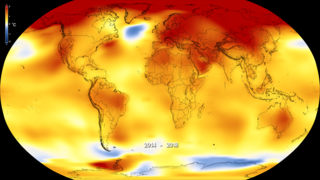
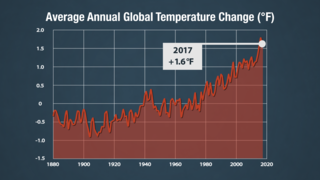
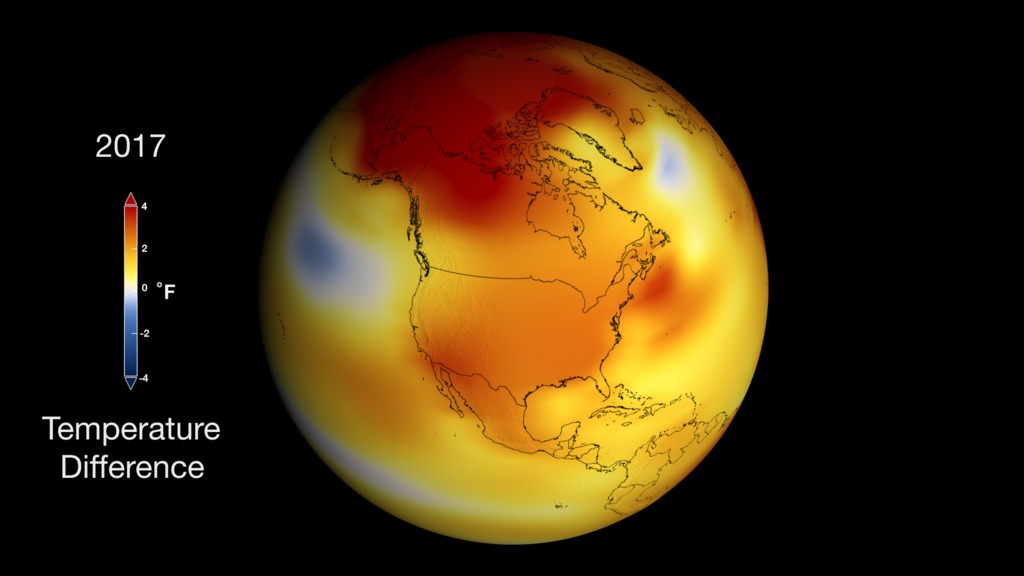
Earth’s global surface temperatures in 2017 were the second warmest since modern recordkeeping began in 1880, according to an analysis by NASA.
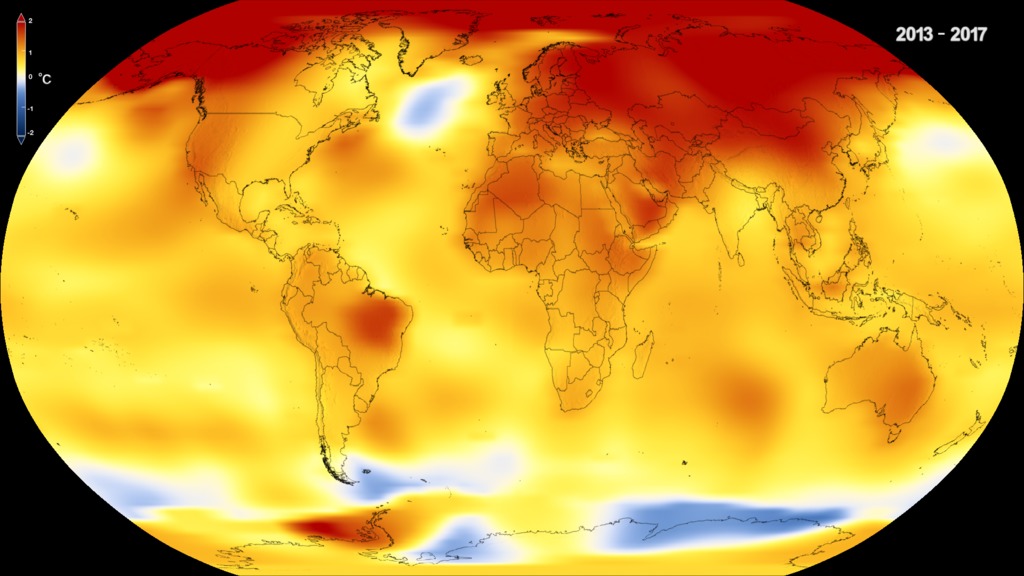
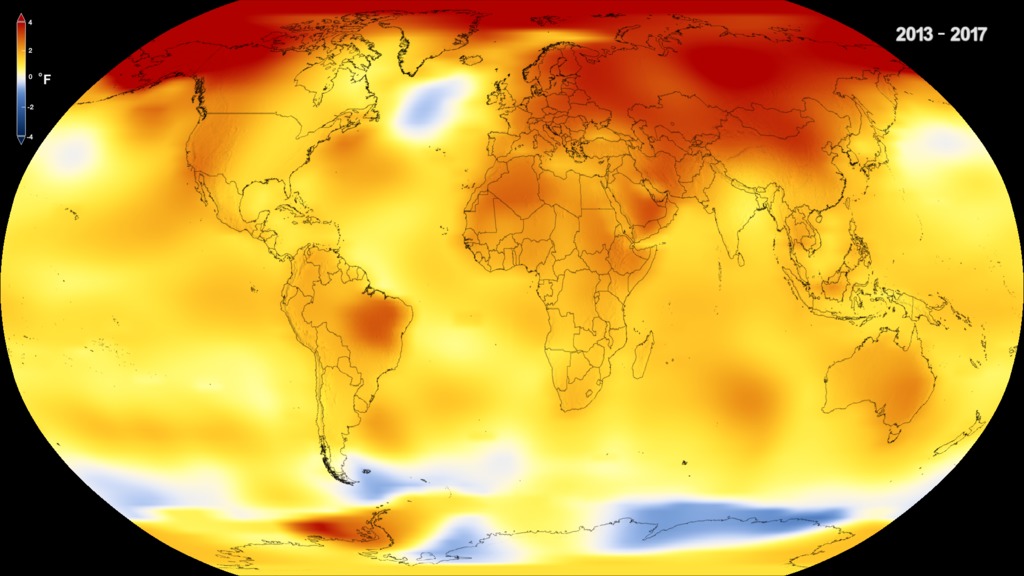
Continuing the planet’s long-term warming trend, globally averaged temperatures in 2017 were 1.62 degrees Fahrenheit (0.90 degrees Celsius) warmer than the 1951 to 1980 mean, according to scientists at NASA’s Goddard Institute for Space Studies (GISS) in New York. That is second only to global temperatures in 2016. Last year was the third consecutive year in which temperatures were more than 1.8 degrees Fahrenheit (1 degree Celsius) above late nineteenth-century levels.
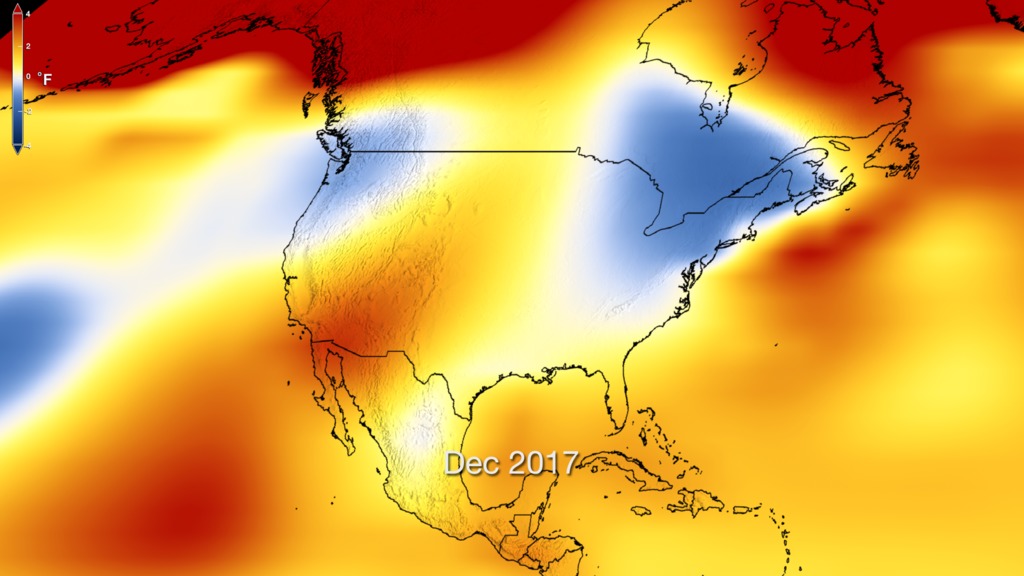
NASA’s temperature analyses incorporate surface temperature measurements from 6,300 weather stations, ship- and buoy-based observations of sea surface temperatures, and temperature measurements from Antarctic research stations.
These raw measurements are analyzed using an algorithm that considers the varied spacing of temperature stations around the globe and urban heating effects that could skew the conclusions. These calculations produce the global average temperature deviations from the baseline period of 1951 to 1980.
The full 2017 surface temperature data set and the complete methodology used to make the temperature calculation are available at:http://data.giss.nasa.gov/gistemp/
GISS is a laboratory within the Earth Sciences Division of NASA’s Goddard Space Flight Center in Greenbelt, Maryland. The laboratory is affiliated with Columbia University’s Earth Institute and School of Engineering and Applied Science in New York.
NASA uses the unique vantage point of space to better understand Earth as an interconnected system. The agency also uses airborne and ground-based monitoring, and develops new ways to observe and study Earth with long-term data records and computer analysis tools to better see how our planet is changing. NASA shares this knowledge with the global community and works with institutions in the United States and around the world that contribute to understanding and protecting our home planet.


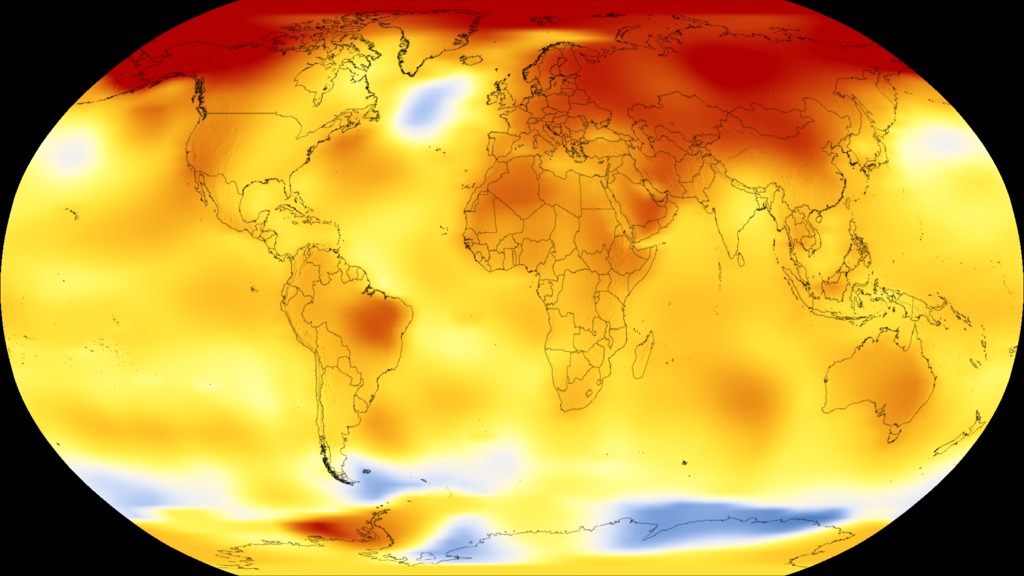
Global Temperature Anomalies from 1880 to 2017
There is a newer version of this story located here: https://svs.gsfc.nasa.gov/5060
Continuing the planet’s long-term warming trend, globally averaged temperatures in 2017 were 1.62 degrees Fahrenheit (0.90 degrees Celsius) warmer than the 1951 to 1980 mean, according to scientists at NASA’s Goddard Institute for Space Studies (GISS) in New York. That is second only to global temperatures in 2016. Last year was the third consecutive year in which temperatures were more than 1.8 degrees Fahrenheit (1 degree Celsius) above late nineteenth-century levels.
NASA’s temperature analyses incorporate surface temperature measurements from 6,300 weather stations, ship- and buoy-based observations of sea surface temperatures, and temperature measurements from Antarctic research stations.
These raw measurements are analyzed using an algorithm that considers the varied spacing of temperature stations around the globe and urban heating effects that could skew the conclusions. These calculations produce the global average temperature deviations from the baseline period of 1951 to 1980.
The full 2017 surface temperature data set and the complete methodology used to make the temperature calculation are available at:http://data.giss.nasa.gov/gistemp/
GISS is a laboratory within the Earth Sciences Division of NASA’s Goddard Space Flight Center in Greenbelt, Maryland. The laboratory is affiliated with Columbia University’s Earth Institute and School of Engineering and Applied Science in New York.
NASA uses the unique vantage point of space to better understand Earth as an interconnected system. The agency also uses airborne and ground-based monitoring, and develops new ways to observe and study Earth with long-term data records and computer analysis tools to better see how our planet is changing. NASA shares this knowledge with the global community and works with institutions in the United States and around the world that contribute to understanding and protecting our home planet.
Used Elsewhere In
Newer Versions

Related
Visualization Credits
Kel Elkins (USRA): Lead Visualizer
Lori Perkins (NASA/GSFC): Visualizer
Gavin A. Schmidt (NASA/GSFC GISS): Lead Scientist
Robert B Schmunk Ph.D. (SIGMA Space Partners, LLC.): Scientist
Reto A. Ruedy Ph.D. (SIGMA Space Partners, LLC.): Scientist
Matthew R. Radcliff (USRA): Producer
Patrick Lynch (NASA/GSFC): Producer
Kathryn Mersmann (USRA): Producer
Please give credit for this item to:
NASA's Scientific Visualization Studio
Data provided by Robert B. Schmunk (NASA/GSFC GISS)
NASA's Scientific Visualization Studio
Data provided by Robert B. Schmunk (NASA/GSFC GISS)
Short URL to share this page:
https://svs.gsfc.nasa.gov/4609
Data Used:
Note: While we identify the data sets used in these visualizations, we do not store any further details nor the data sets themselves on our site.
Keywords:
SVS >> Climate
SVS >> Global Warming
SVS >> HDTV
DLESE >> Physical oceanography
GCMD >> Earth Science >> Oceans >> Coastal Processes >> Sea Level Rise
SVS >> Model Data
SVS >> Hyperwall
NASA Science >> Earth
NASA Earth Science Focus Areas >> Climate Variability and Change
GCMD keywords can be found on the Internet with the following citation: Olsen, L.M., G. Major, K. Shein, J. Scialdone, S. Ritz, T. Stevens, M. Morahan, A. Aleman, R. Vogel, S. Leicester, H. Weir, M. Meaux, S. Grebas, C.Solomon, M. Holland, T. Northcutt, R. A. Restrepo, R. Bilodeau, 2013. NASA/Global Change Master Directory (GCMD) Earth Science Keywords. Version 8.0.0.0.0
https://svs.gsfc.nasa.gov/4609
Data Used:
GISS Surface Temperature Analysis (GISTEMP)/GISTEMP
Model - NASA/GISSKeywords:
SVS >> Climate
SVS >> Global Warming
SVS >> HDTV
DLESE >> Physical oceanography
GCMD >> Earth Science >> Oceans >> Coastal Processes >> Sea Level Rise
SVS >> Model Data
SVS >> Hyperwall
NASA Science >> Earth
NASA Earth Science Focus Areas >> Climate Variability and Change
GCMD keywords can be found on the Internet with the following citation: Olsen, L.M., G. Major, K. Shein, J. Scialdone, S. Ritz, T. Stevens, M. Morahan, A. Aleman, R. Vogel, S. Leicester, H. Weir, M. Meaux, S. Grebas, C.Solomon, M. Holland, T. Northcutt, R. A. Restrepo, R. Bilodeau, 2013. NASA/Global Change Master Directory (GCMD) Earth Science Keywords. Version 8.0.0.0.0


