Earth
ID: 4361
This gallery was created for Earth Science Week 2015 and beyond. It includes a quick start guide for educators and first-hand stories (blogs) for learners of all ages by NASA visualizers, scientists and educators. We hope that your understanding and use of NASA's visualizations will only increase as your appreciation grows for the beauty of the science they portray, and the communicative power they hold. Read all the blogs and find educational resources for all ages at: the Earth Science Week 2015 page.
It all began with my fourth grade teacher, Mrs. Benner. Back then my school had a weather station and one day she had asked me to collect wind speed and temperature data. I soon found myself in charge of the morning weather forecast and soon this was my favorite part of the day. Little did I know that in the years that would follow, I’d pursue my passion for clouds and meteorology to become a research scientist at NASA. Working at NASA is every bit as cool as it sounds! Everyday is different and I always find myself working with new scientific tools to uncover mysteries about our planet Earth. Lately I’ve been studying the cryosphere, or the world’s frozen places, where I’m using scientific visualizations to understand the impacts of climate change in the Arctic. In particular I’m focusing on melting sea ice to understand how it affects Arctic cloud formation. Arctic clouds are made up of tiny liquid droplets and ice particles that form from condensation and then freezing of water vapor. Water vapor is a necessary ingredient for Arctic cloud formation, and evaporation from the Arctic Ocean can serve as an important source of water vapor. But when sea ice sits on the Arctic Ocean it acts as a lid that prevents evaporation and may limit Arctic cloud formation. Over the past decade the amount of Arctic sea ice has declined dramatically and we think this trend may be influencing Arctic cloud formation. I created a visualization showing the hypothesized response of clouds to melting in sea ice (below). The difference between the left panel, "Current Conditions," and the right panel, "Future Conditions," is that less sea ice in the future leads to more evaporation, and more evaporation leads to more water vapor and increased cloudiness. This hypothesis is where I base my research, using state-of-the-art NASA satellite instruments including CALIPSO and CloudSAT.

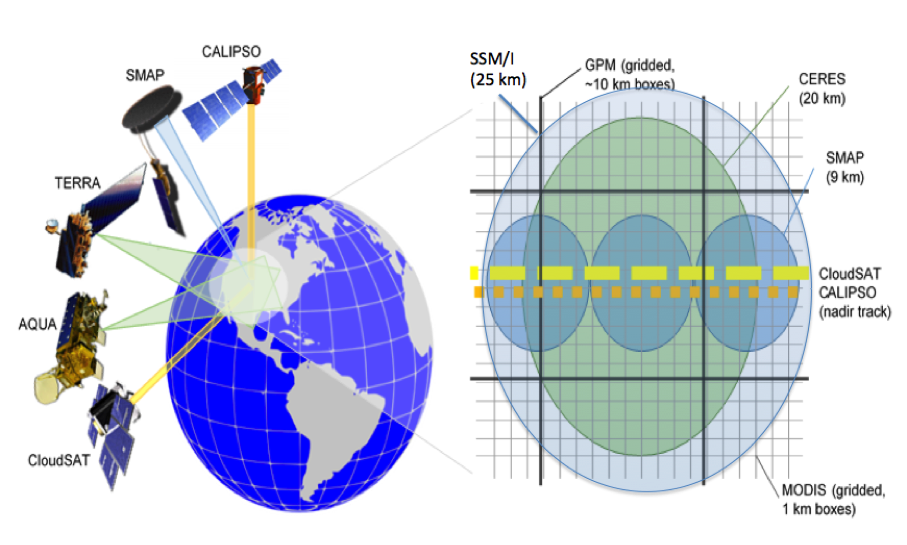
To begin my investigation, I combined data from many different NASA satellite instruments on various satellites. Each instrument measures unique information that I combine to see the full picture of the Arctic climate system. CloudSat, CALIPSO, and MODIS provide data about the clouds. SSM/I measures sea ice cover and CERES measures the amount of energy leaving the Earth. While the instruments are on different satellites, they observe the same location on the Earth within a few minutes of each other. This is because they are flying in a formation we call a "train constellation," which is similar to the way train carriages follow one another in a single path.
So why am I interested in sea ice and clouds? Sea ice and cloud coverage in the Arctic has a big effect on the surface temperature of the ocean. And as the global climate warms, the Arctic is expected to heat up twice as fast as the rest of the world because of a process known as ice albedo feedback. Ice is very bright and reflects a large amount of the Sun’s energy back to space. In contrast, the ocean is very dark and it efficiently absorbs the sun’s energy. Putting these concepts together, the ice albedo feedback results in a warmer surface temperature because when ice melts, energy that would have been reflected into space is instead absorbed by the ocean. But clouds, like ice, are also bright. So if clouds increase as sea ice melts, then the ice albedo feedback will decrease because clouds will reflect the solar energy in place of the ice that was there before. Exactly how much clouds influence this ice albedo feedback is the focus of my work. The visualization below demonstrates the ice albedo feedback process.
Understanding the Arctic climate system is critical because Arctic temperature and sea ice cover has a global effect on plants, animals, and humans. For example, experts are uncovering evidence that warmer Arctic temperatures may cause stronger winter storms in the United States. These changing weather patterns have an enormous influence on society, from our energy demand to our ability to grow food. Using scientific visualization tools not only helps me better understand these processes, but can help me better communicate my discoveries to others. Looking back, I’m not sure if my interest in weather was average or unusual for a fourth grade student. But I do know that if I didn’t embrace my passion, I’d be doing something very different today. I love my career at a NASA because it allows me to work on projects that impact the lives of everyday people - and that includes inspiring students just like you to embark on your own journey in Earth science.
-- Patrick Taylor, Research Scientist (NASA Langley Research Center)

Does What Happens in the Arctic Stay in the Arctic?
It all began with my fourth grade teacher, Mrs. Benner. Back then my school had a weather station and one day she had asked me to collect wind speed and temperature data. I soon found myself in charge of the morning weather forecast and soon this was my favorite part of the day. Little did I know that in the years that would follow, I’d pursue my passion for clouds and meteorology to become a research scientist at NASA. Working at NASA is every bit as cool as it sounds! Everyday is different and I always find myself working with new scientific tools to uncover mysteries about our planet Earth. Lately I’ve been studying the cryosphere, or the world’s frozen places, where I’m using scientific visualizations to understand the impacts of climate change in the Arctic. In particular I’m focusing on melting sea ice to understand how it affects Arctic cloud formation. Arctic clouds are made up of tiny liquid droplets and ice particles that form from condensation and then freezing of water vapor. Water vapor is a necessary ingredient for Arctic cloud formation, and evaporation from the Arctic Ocean can serve as an important source of water vapor. But when sea ice sits on the Arctic Ocean it acts as a lid that prevents evaporation and may limit Arctic cloud formation. Over the past decade the amount of Arctic sea ice has declined dramatically and we think this trend may be influencing Arctic cloud formation. I created a visualization showing the hypothesized response of clouds to melting in sea ice (below). The difference between the left panel, "Current Conditions," and the right panel, "Future Conditions," is that less sea ice in the future leads to more evaporation, and more evaporation leads to more water vapor and increased cloudiness. This hypothesis is where I base my research, using state-of-the-art NASA satellite instruments including CALIPSO and CloudSAT.
To begin my investigation, I combined data from many different NASA satellite instruments on various satellites. Each instrument measures unique information that I combine to see the full picture of the Arctic climate system. CloudSat, CALIPSO, and MODIS provide data about the clouds. SSM/I measures sea ice cover and CERES measures the amount of energy leaving the Earth. While the instruments are on different satellites, they observe the same location on the Earth within a few minutes of each other. This is because they are flying in a formation we call a "train constellation," which is similar to the way train carriages follow one another in a single path.
So why am I interested in sea ice and clouds? Sea ice and cloud coverage in the Arctic has a big effect on the surface temperature of the ocean. And as the global climate warms, the Arctic is expected to heat up twice as fast as the rest of the world because of a process known as ice albedo feedback. Ice is very bright and reflects a large amount of the Sun’s energy back to space. In contrast, the ocean is very dark and it efficiently absorbs the sun’s energy. Putting these concepts together, the ice albedo feedback results in a warmer surface temperature because when ice melts, energy that would have been reflected into space is instead absorbed by the ocean. But clouds, like ice, are also bright. So if clouds increase as sea ice melts, then the ice albedo feedback will decrease because clouds will reflect the solar energy in place of the ice that was there before. Exactly how much clouds influence this ice albedo feedback is the focus of my work. The visualization below demonstrates the ice albedo feedback process.
Understanding the Arctic climate system is critical because Arctic temperature and sea ice cover has a global effect on plants, animals, and humans. For example, experts are uncovering evidence that warmer Arctic temperatures may cause stronger winter storms in the United States. These changing weather patterns have an enormous influence on society, from our energy demand to our ability to grow food. Using scientific visualization tools not only helps me better understand these processes, but can help me better communicate my discoveries to others. Looking back, I’m not sure if my interest in weather was average or unusual for a fourth grade student. But I do know that if I didn’t embrace my passion, I’d be doing something very different today. I love my career at a NASA because it allows me to work on projects that impact the lives of everyday people - and that includes inspiring students just like you to embark on your own journey in Earth science.
-- Patrick Taylor, Research Scientist (NASA Langley Research Center)
Related
For More Information
Visualization Credits
Patrick C. Taylor (NASA/LaRC):
Author
Leann Johnson (Global Science and Technology, Inc.):
Project Support
Author
Leann Johnson (Global Science and Technology, Inc.):
Project Support
Please give credit for this item to:
NASA's Scientific Visualization Studio
NASA's Scientific Visualization Studio


