Earth
ID: 4345
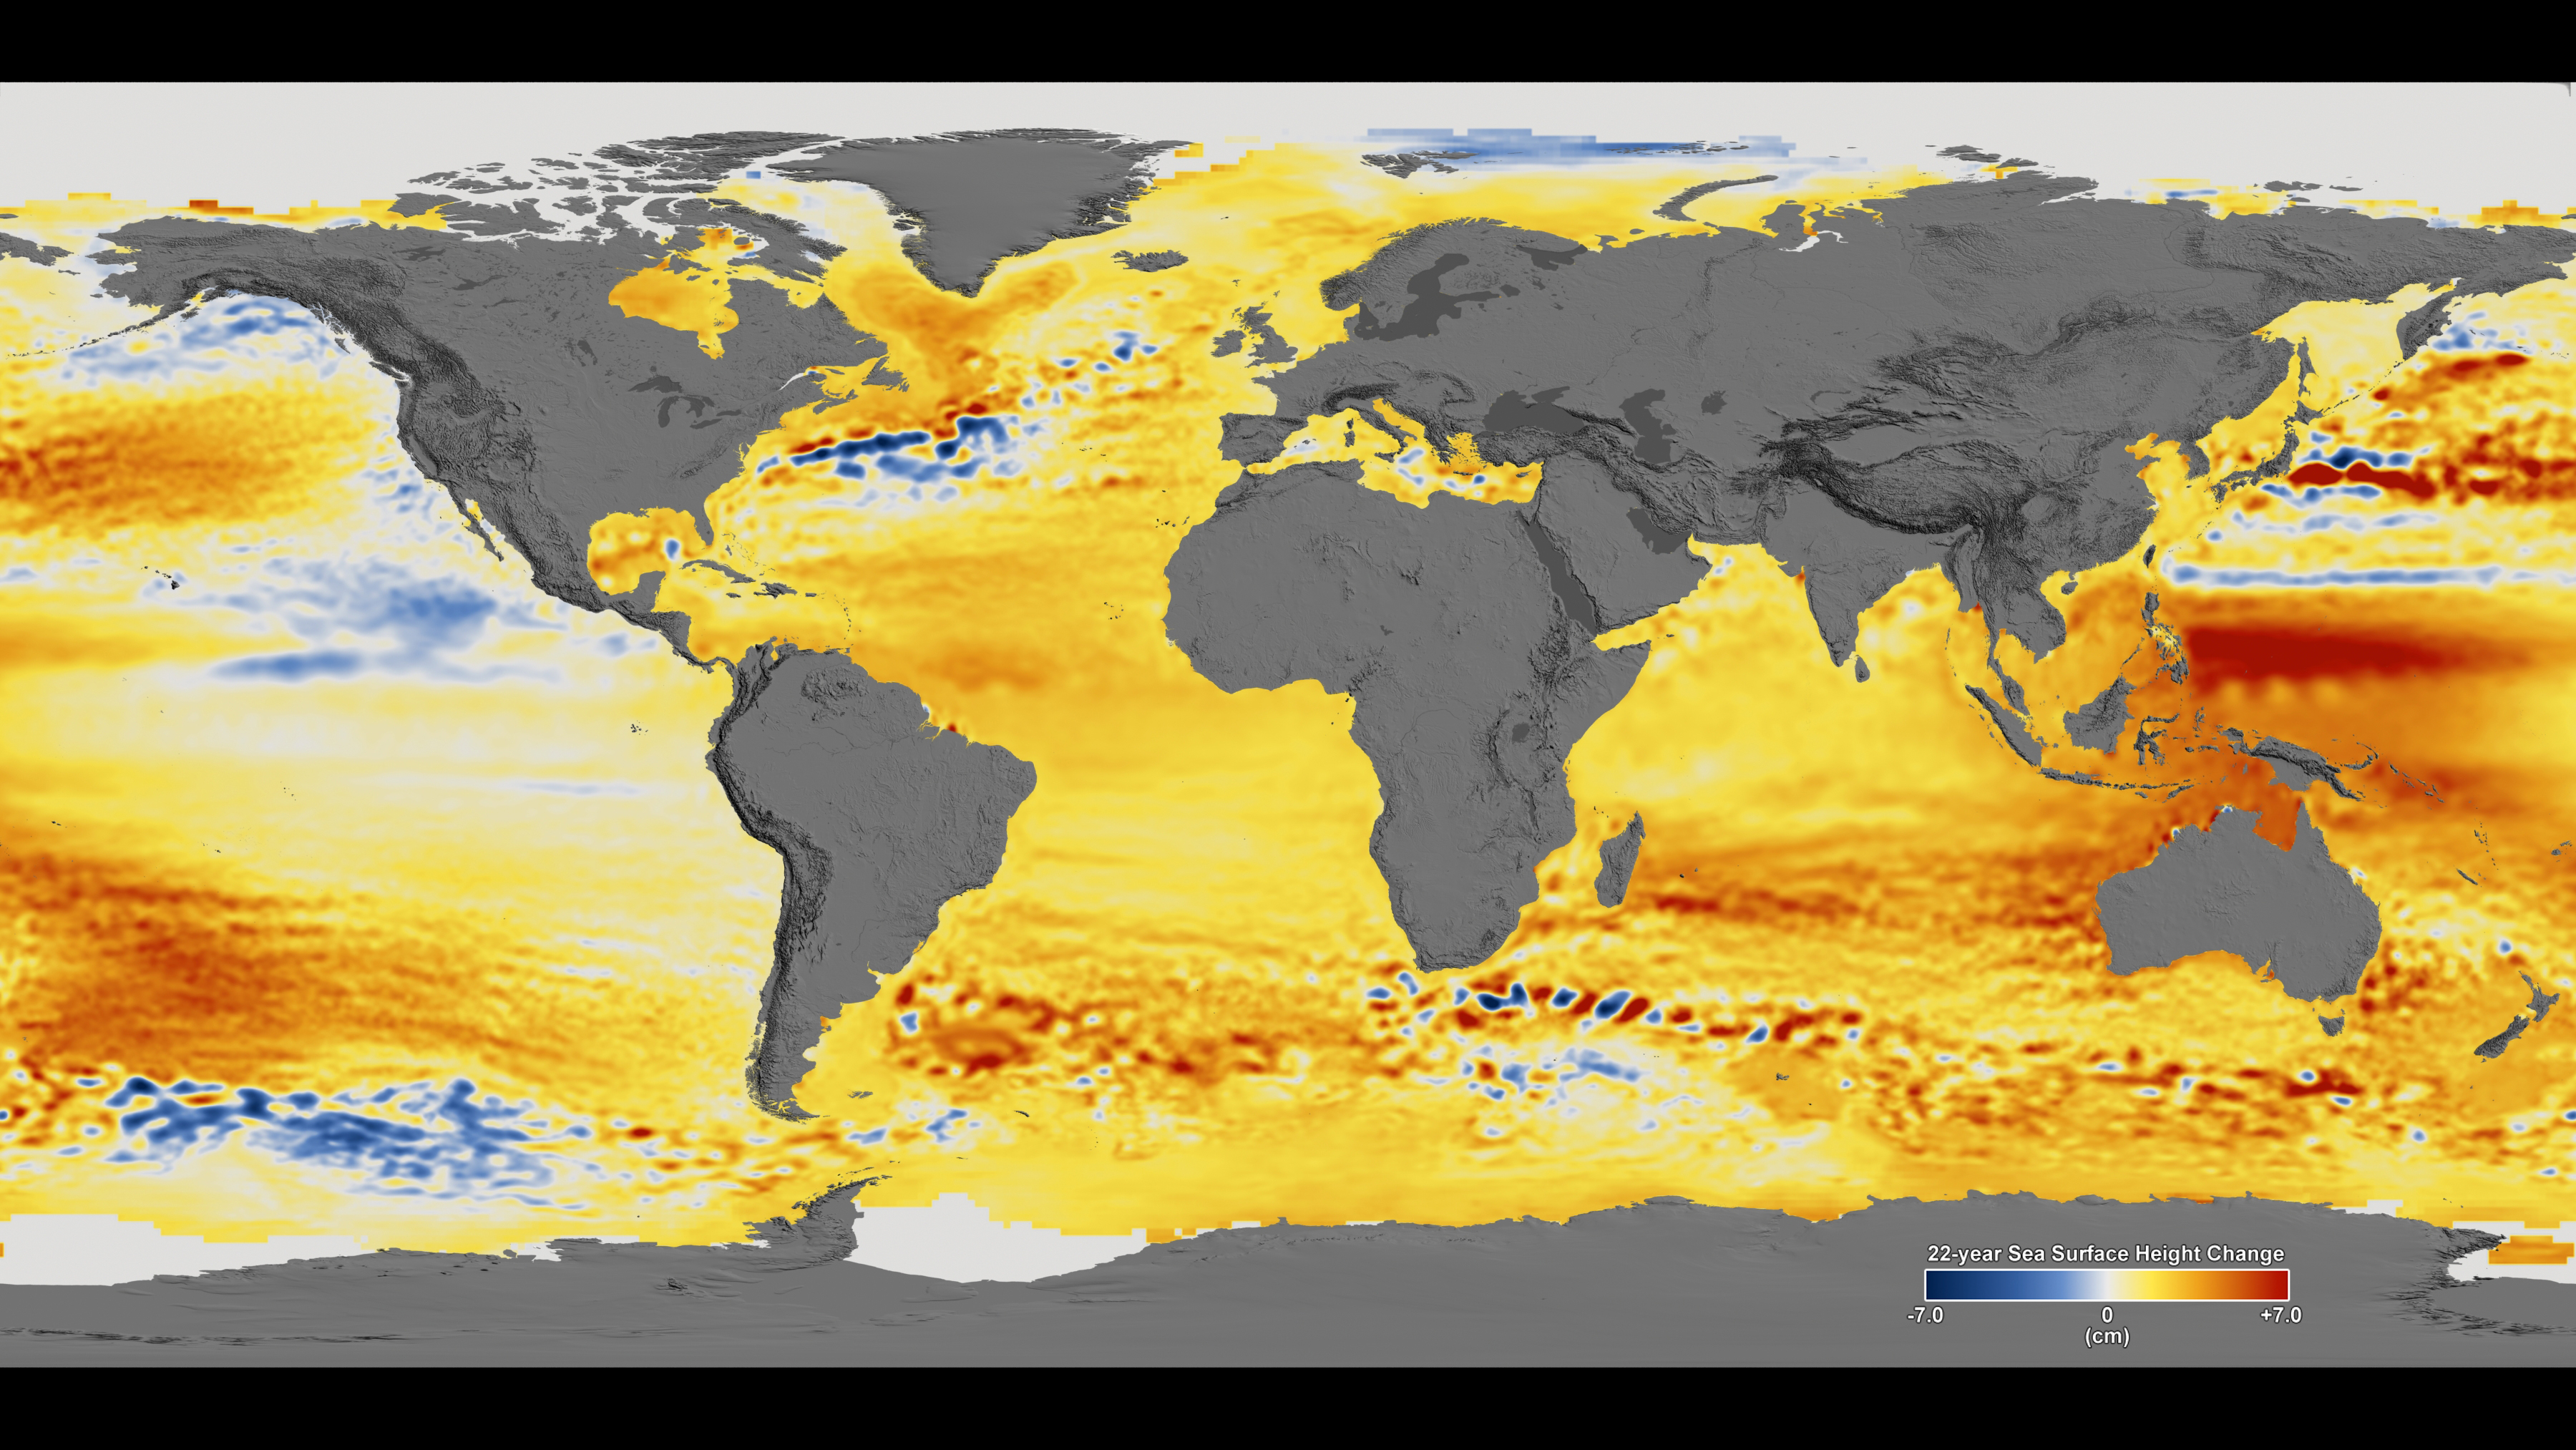
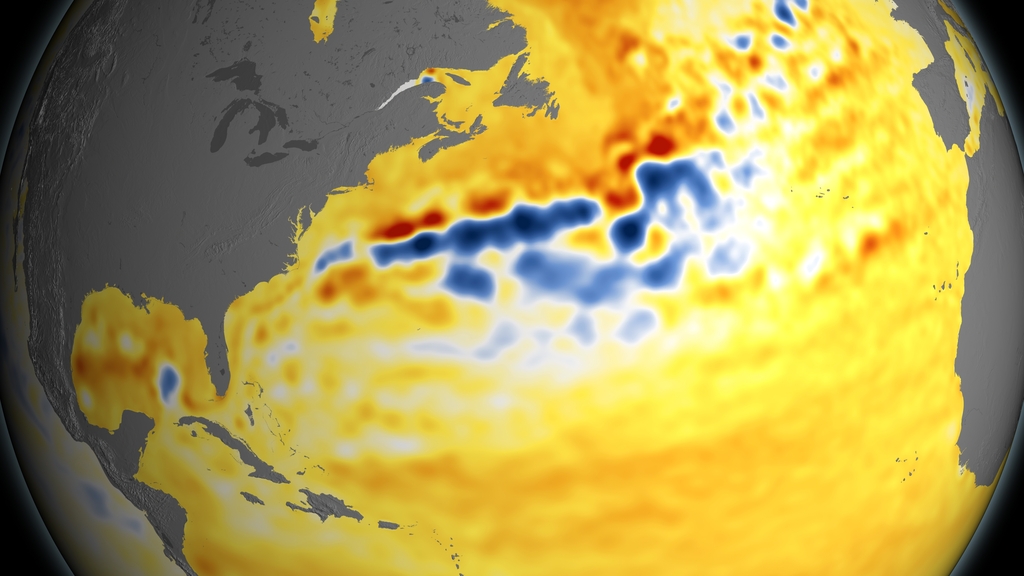
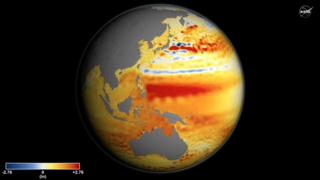
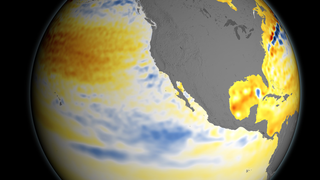
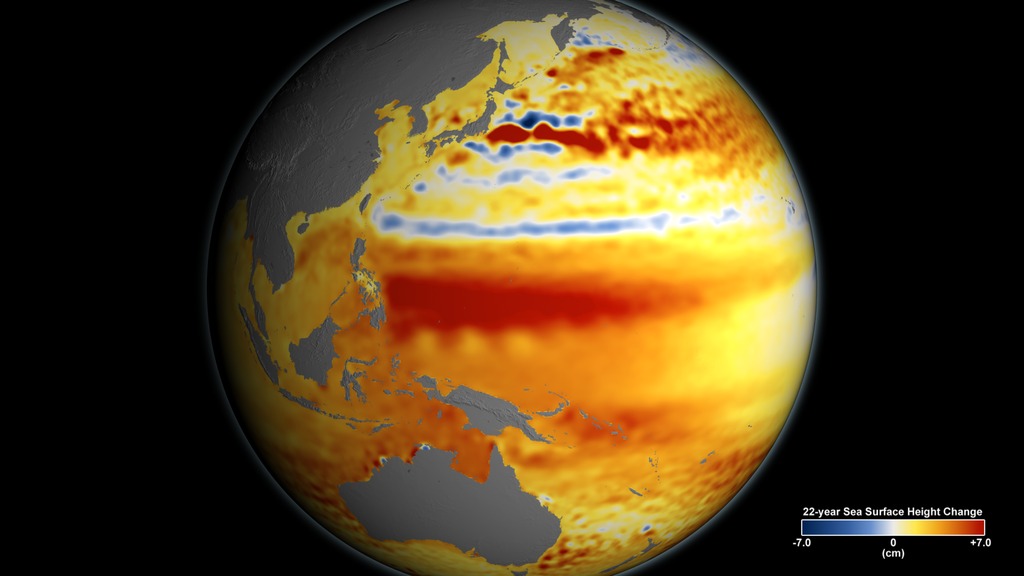
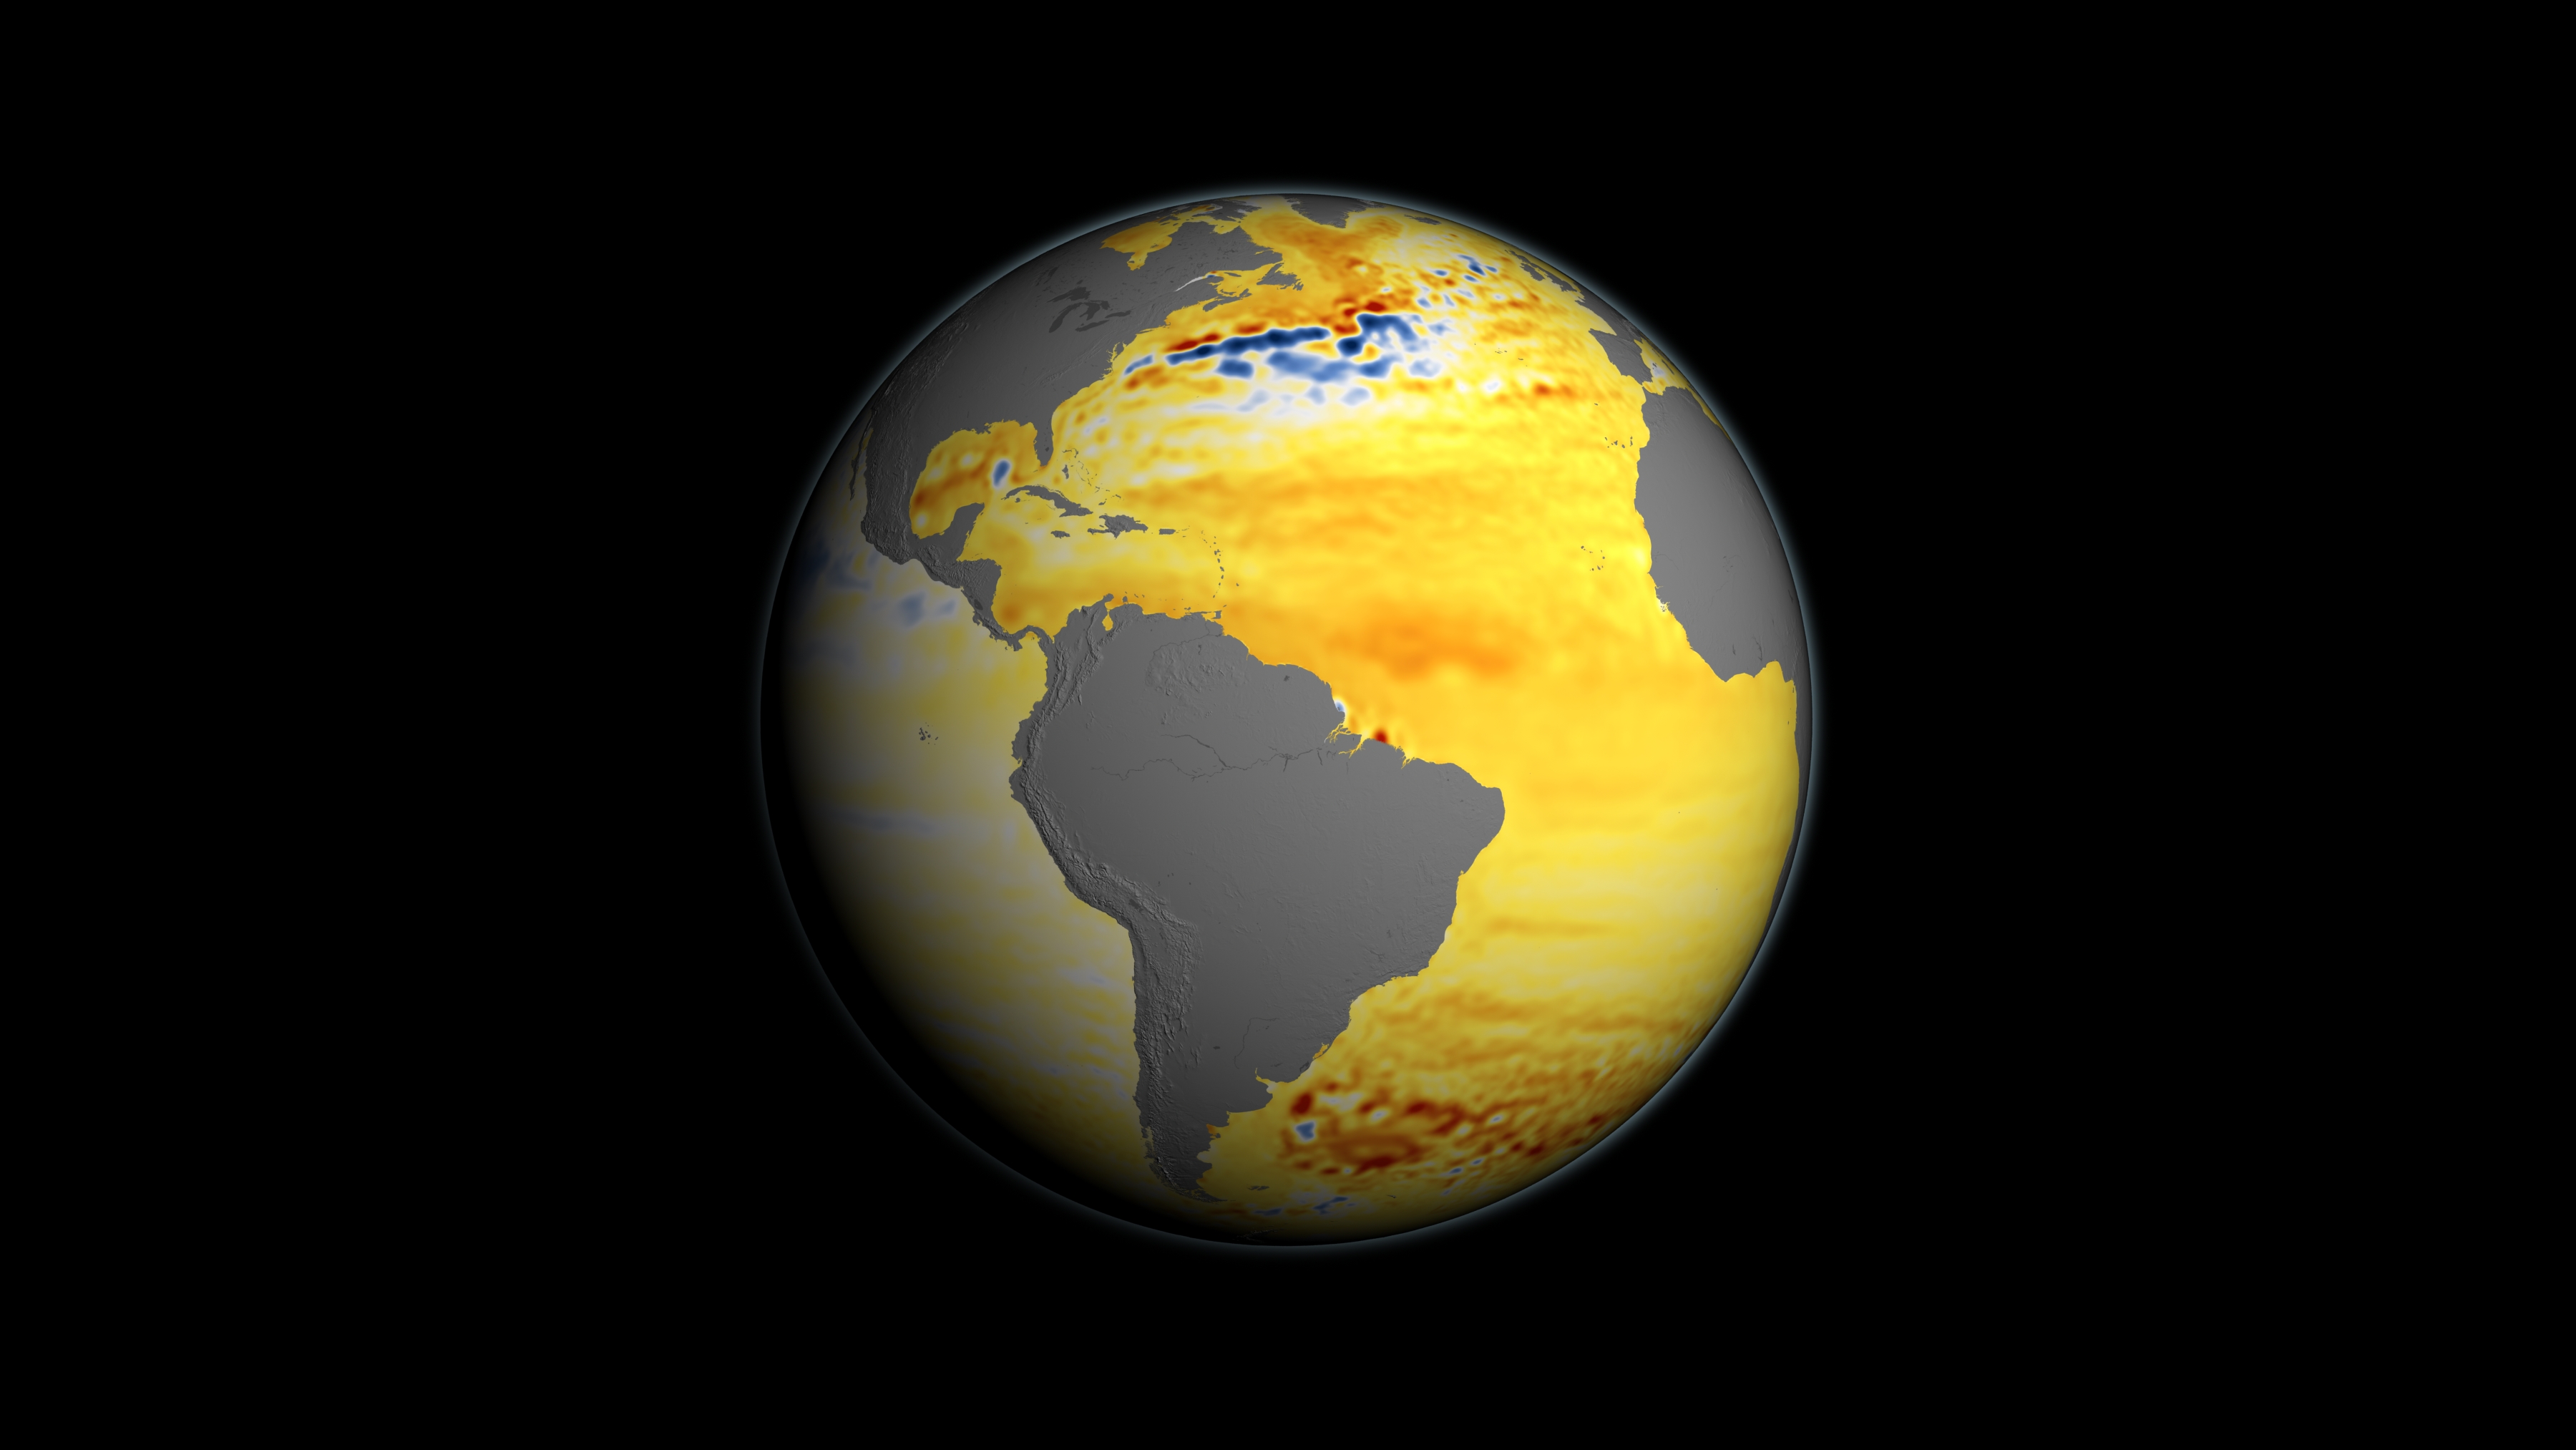
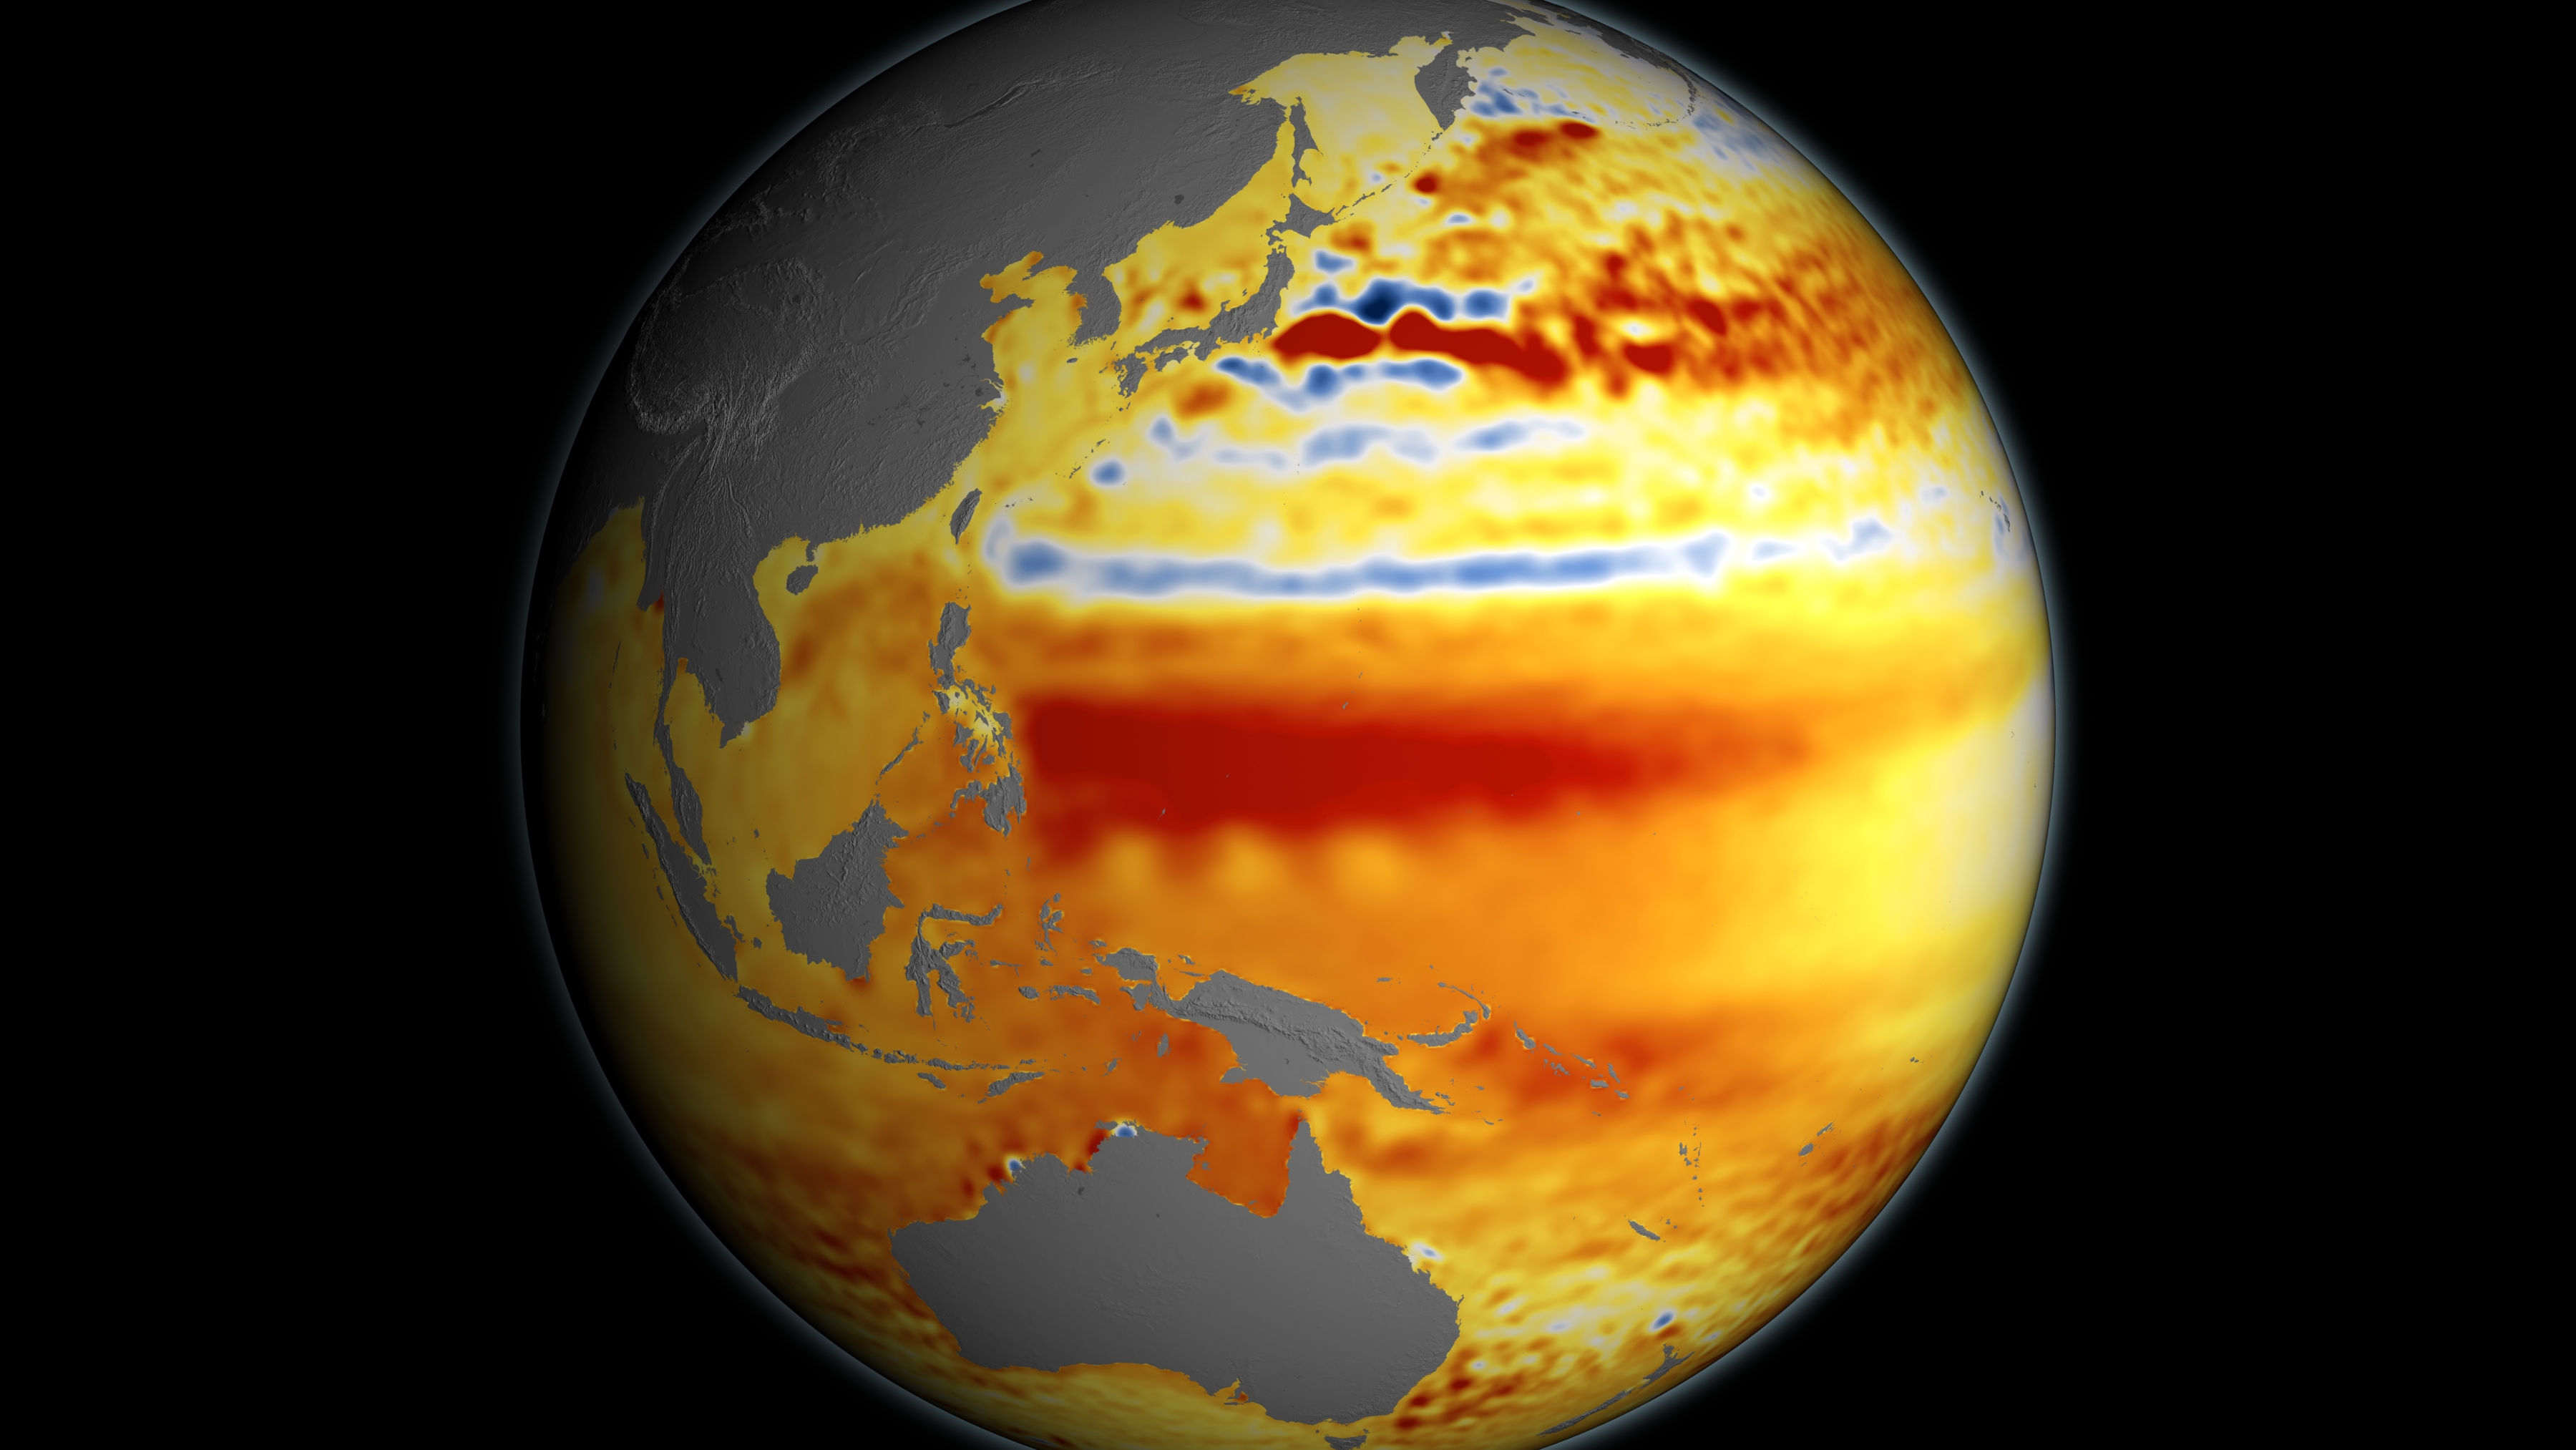
This visualization shows total sea level change between 1992 and 2014, based on data collected from the TOPEX/Poseidon, Jason-1, and Jason-2 satellites. Blue regions are where sea level has gone down, and orange/red regions are where sea level has gone up. Since 1992, seas around the world have risen an average of nearly 3 inches.
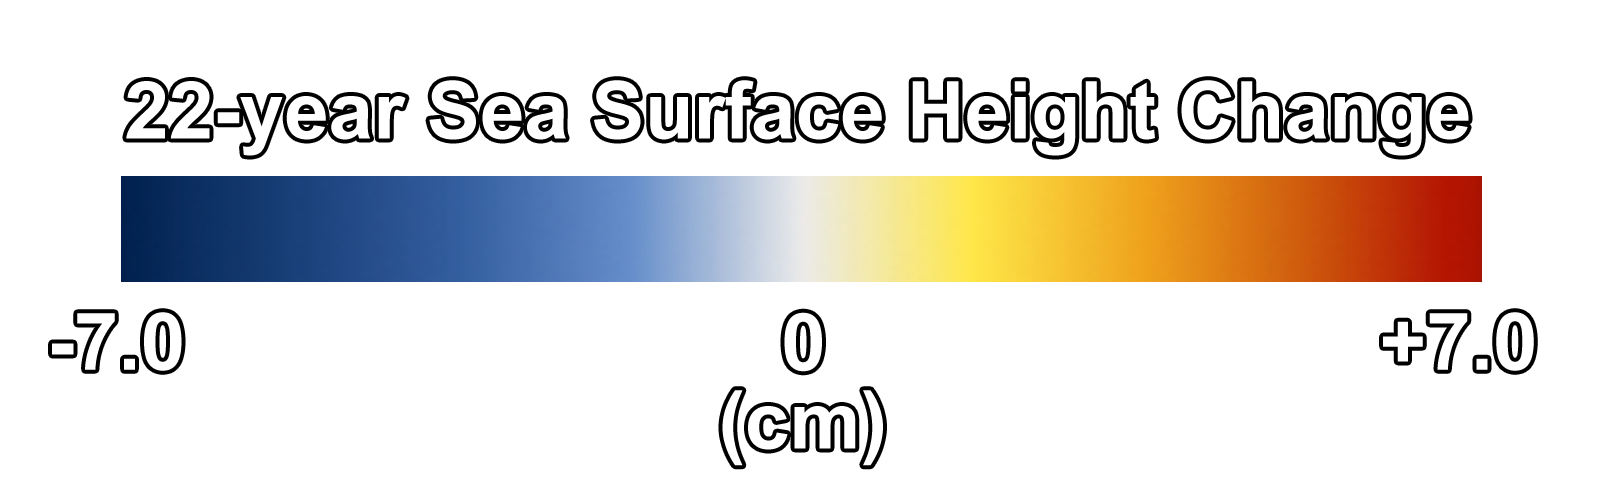
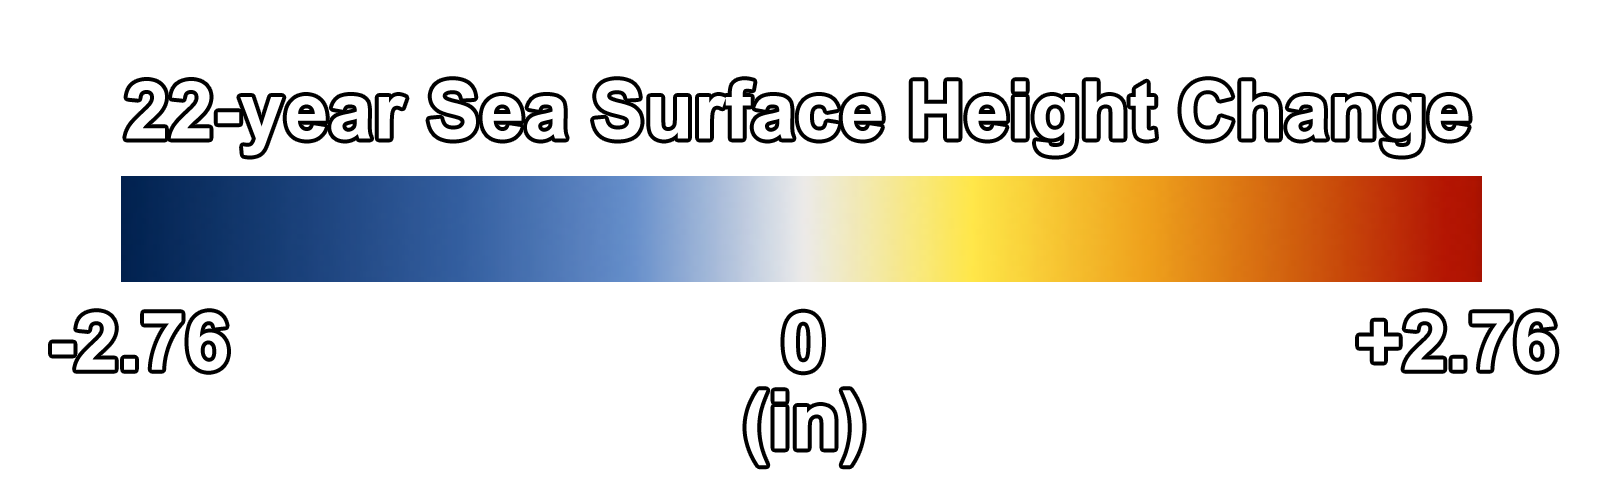
The color range for this visualization is -7 cm to +7 cm (-2.76 inches to +2.76 inches), though measured data extends above and below 7cm(2.76 inches). This particular range was chosen to highlight variations in sea level change.


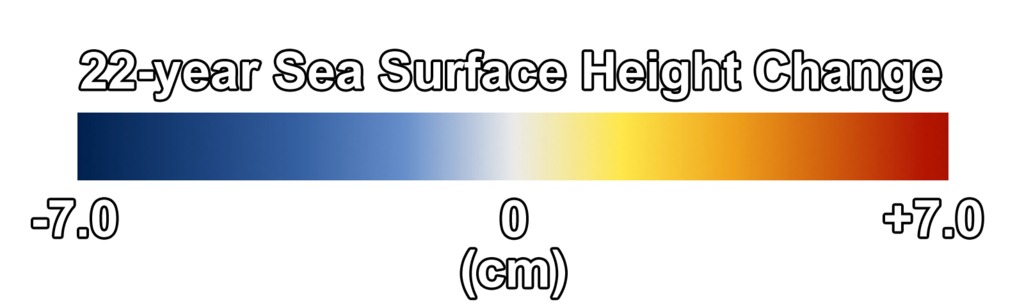

22-year Sea Level Rise - TOPEX/JASON
The color range for this visualization is -7 cm to +7 cm (-2.76 inches to +2.76 inches), though measured data extends above and below 7cm(2.76 inches). This particular range was chosen to highlight variations in sea level change.
Used Elsewhere In
Related

Visualization Credits
Kel Elkins (USRA): Lead Visualizer
Patrick Lynch (Wyle Information Systems): Lead Producer
Josh Willis (JPL): Lead Scientist
Patrick Lynch (Wyle Information Systems): Lead Producer
Josh Willis (JPL): Lead Scientist
Please give credit for this item to:
NASA's Scientific Visualization Studio
NASA's Scientific Visualization Studio
Short URL to share this page:
https://svs.gsfc.nasa.gov/4345
Missions:
Jason
Ocean Surface Topography Mission/Jason 2
TOPEX/Poseidon
Data Used:
Note: While we identify the data sets used in these visualizations, we do not store any further details nor the data sets themselves on our site.
Keywords:
SVS >> HDTV
SVS >> Hyperwall
NASA Science >> Earth
SVS >> Presentation
https://svs.gsfc.nasa.gov/4345
Missions:
Jason
Ocean Surface Topography Mission/Jason 2
TOPEX/Poseidon
Data Used:
TOPEX/Poseidon
Jason-1/Altimeter/Sea Surface Height
Jason-2/CNES Poseidon-3 Altimeter/Sea Surface Height also referred to as: SSH
Keywords:
SVS >> HDTV
SVS >> Hyperwall
NASA Science >> Earth
SVS >> Presentation


