CMIP5: 21st Century Temperature and Precipitation Scenarios
The United Nations' Intergovernmental Panel on Climate Change publishes a report on the consensus view of climate change science about every five to seven years. The first findings of the IPCC's Fifth Assessment Report (AR5) were released on Sept. 27, 2013, in the form of the Summary for Policymakers report and a draft of IPCC Working Group 1's Physical Science Basis. The IPCC does not perform new science but instead authors a report that establishes the established understanding of the world's climate science community.
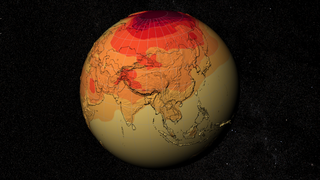
The report not only includes observations of the real world but also the results of climate model projections of how the Earth will respond as a system to rising greenhouse gas concentrations in the atmosphere. The IPCC's AR5 relies on the Coupled Model Intercomparison Project Phase 5 (CMIP5) effort, an international effort among the climate modeling community to coordinate climate change experiments.
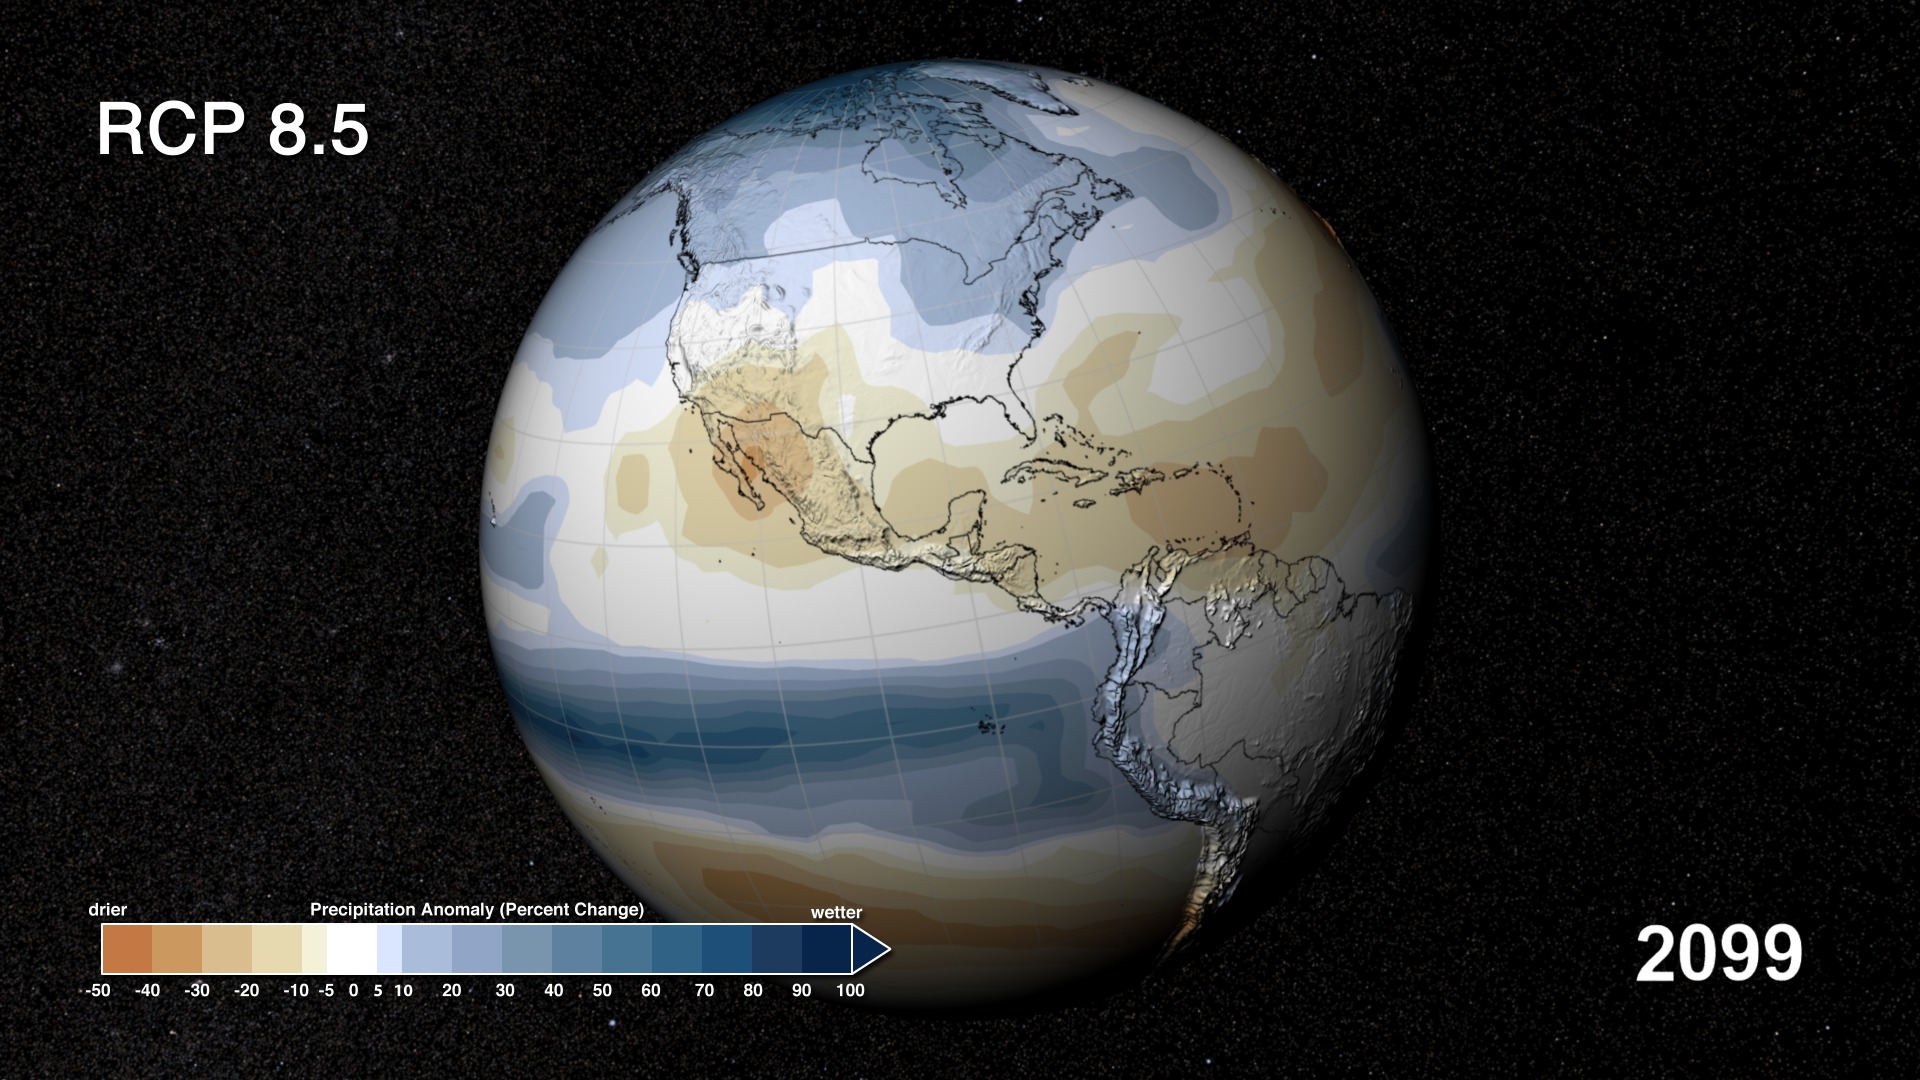
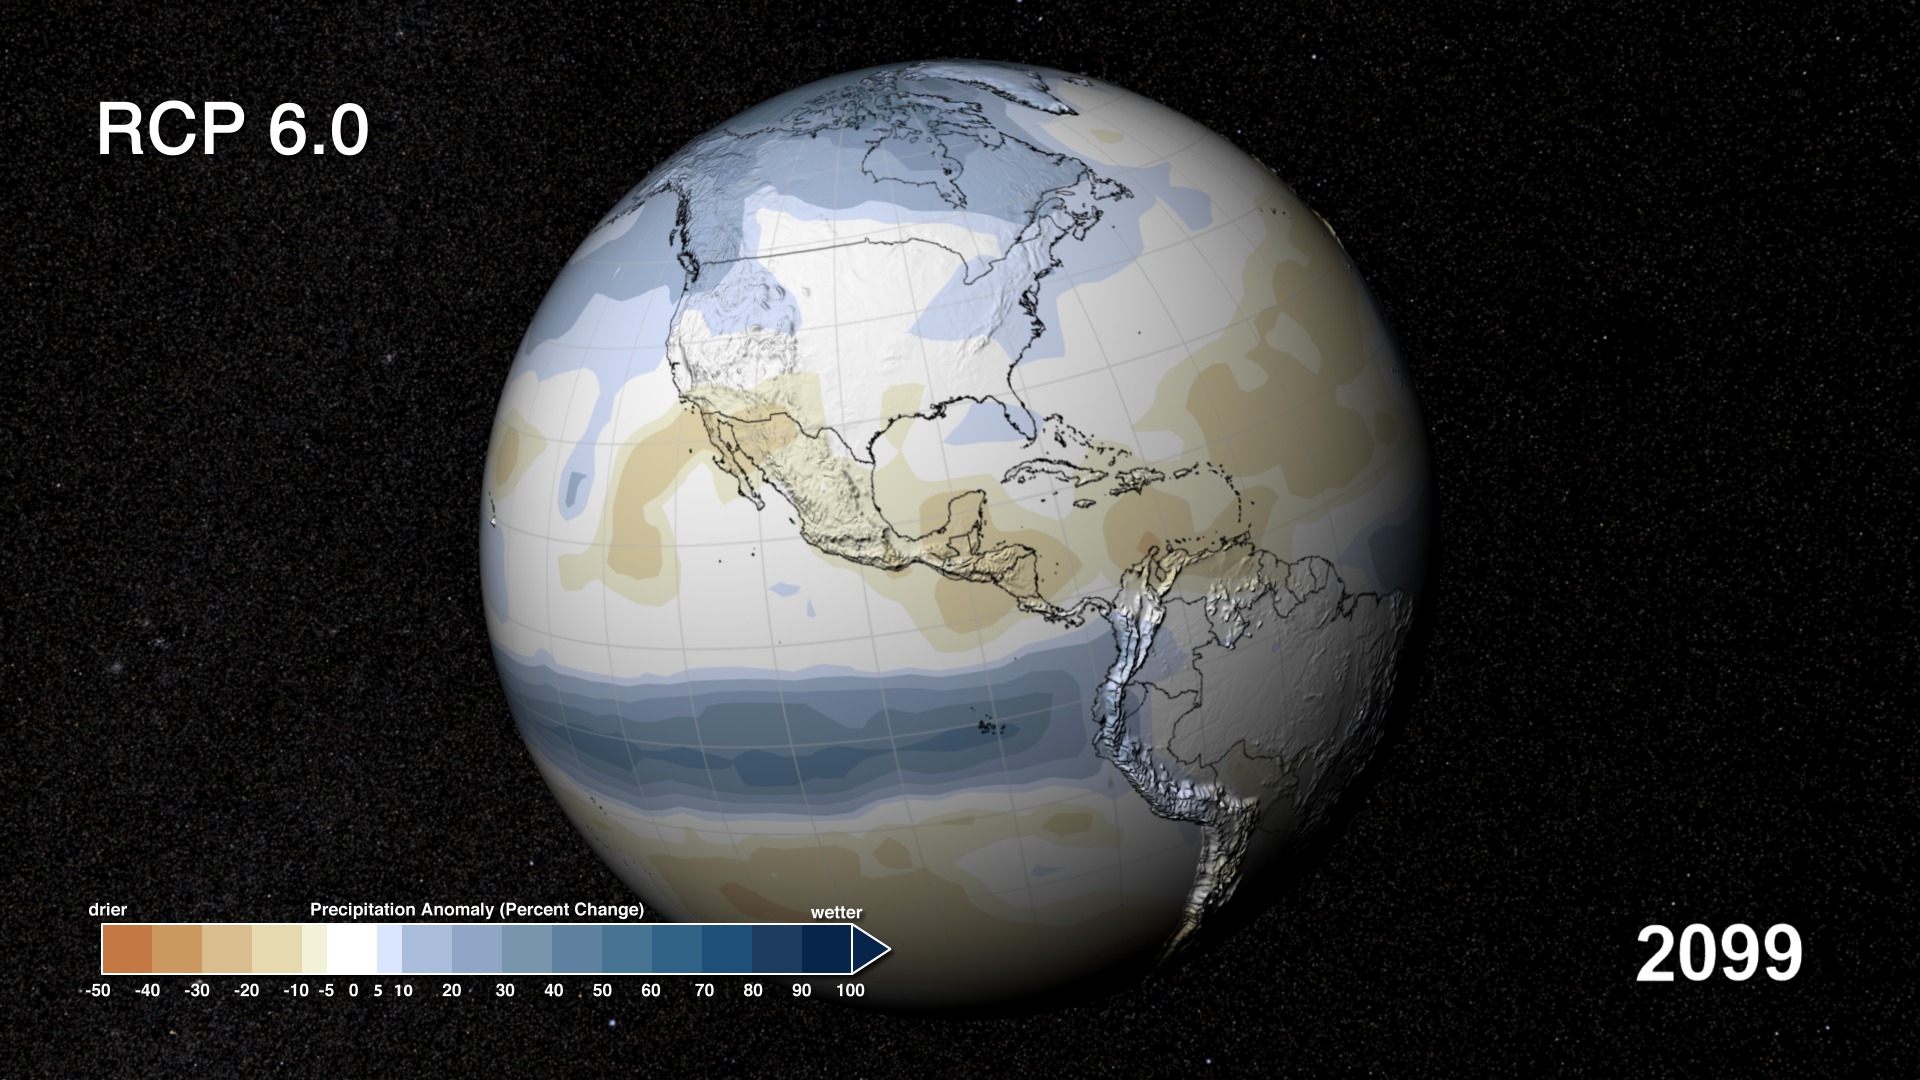
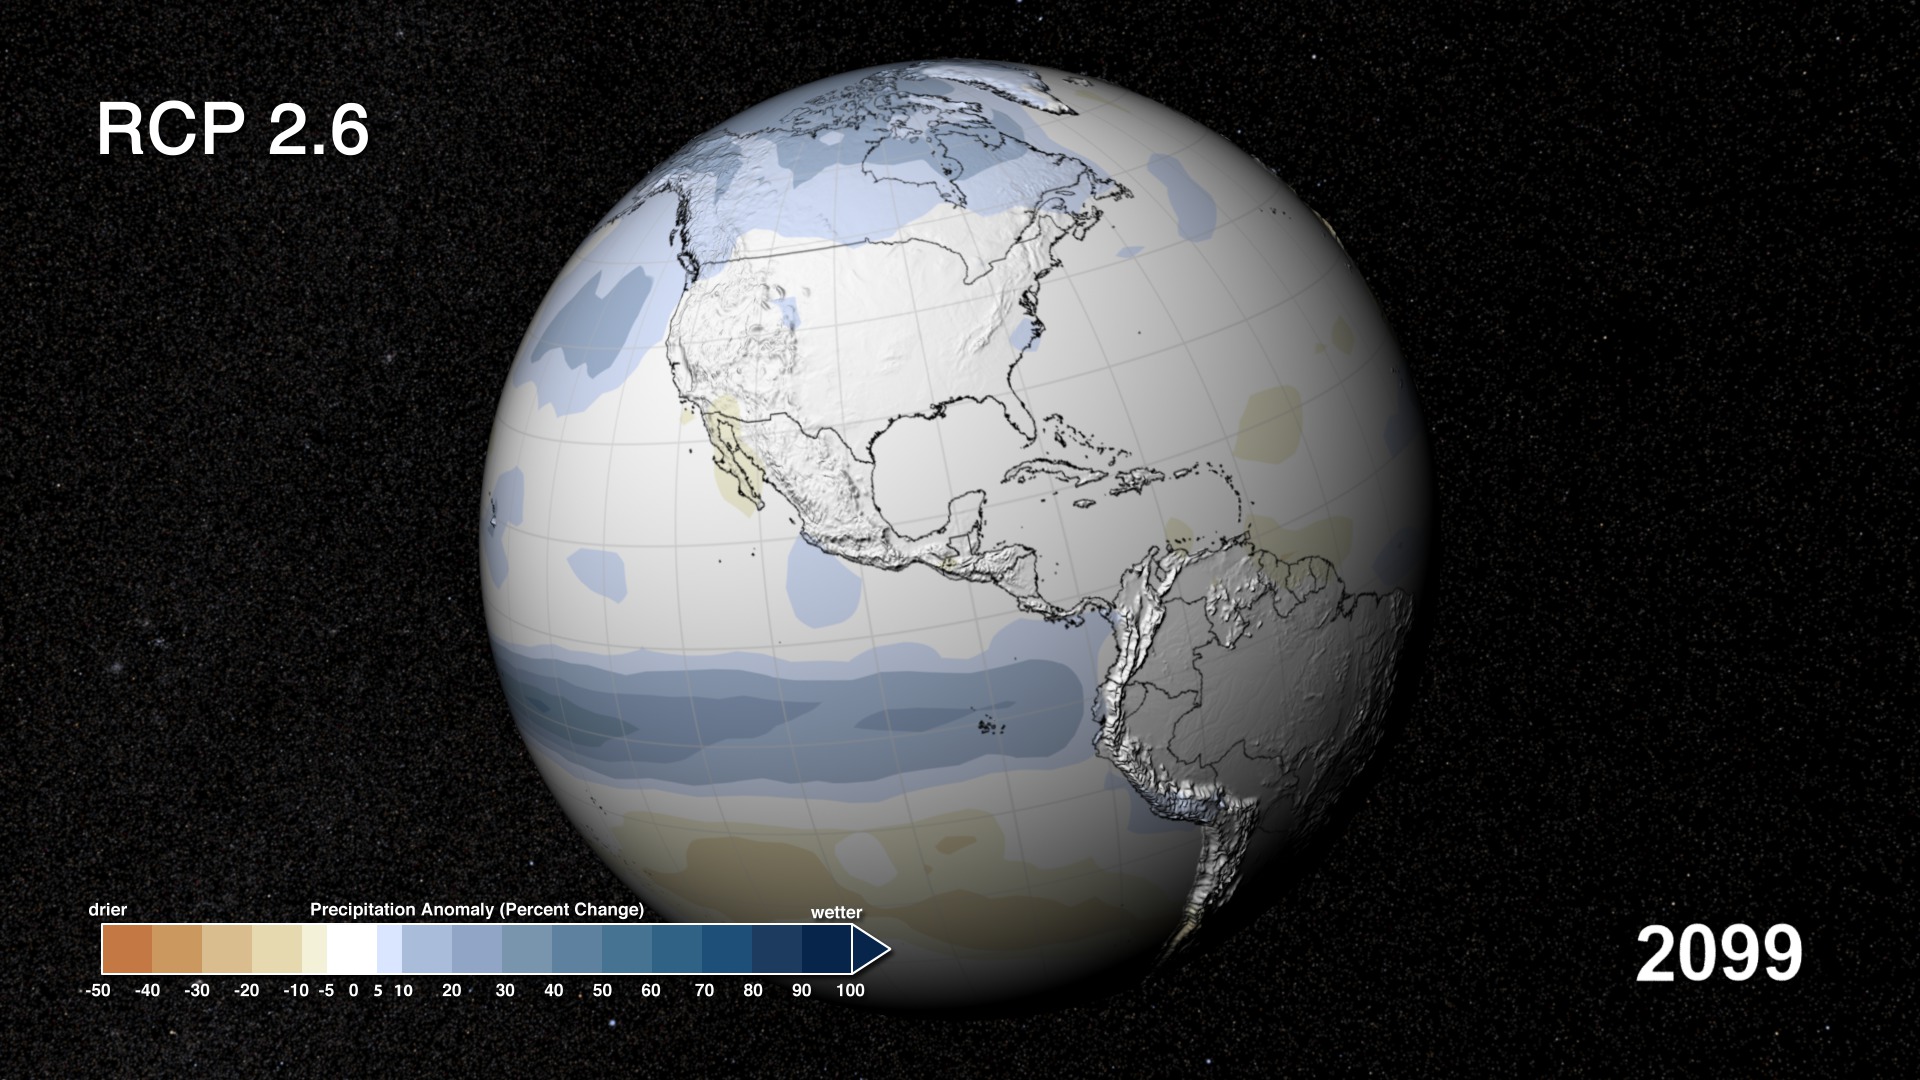
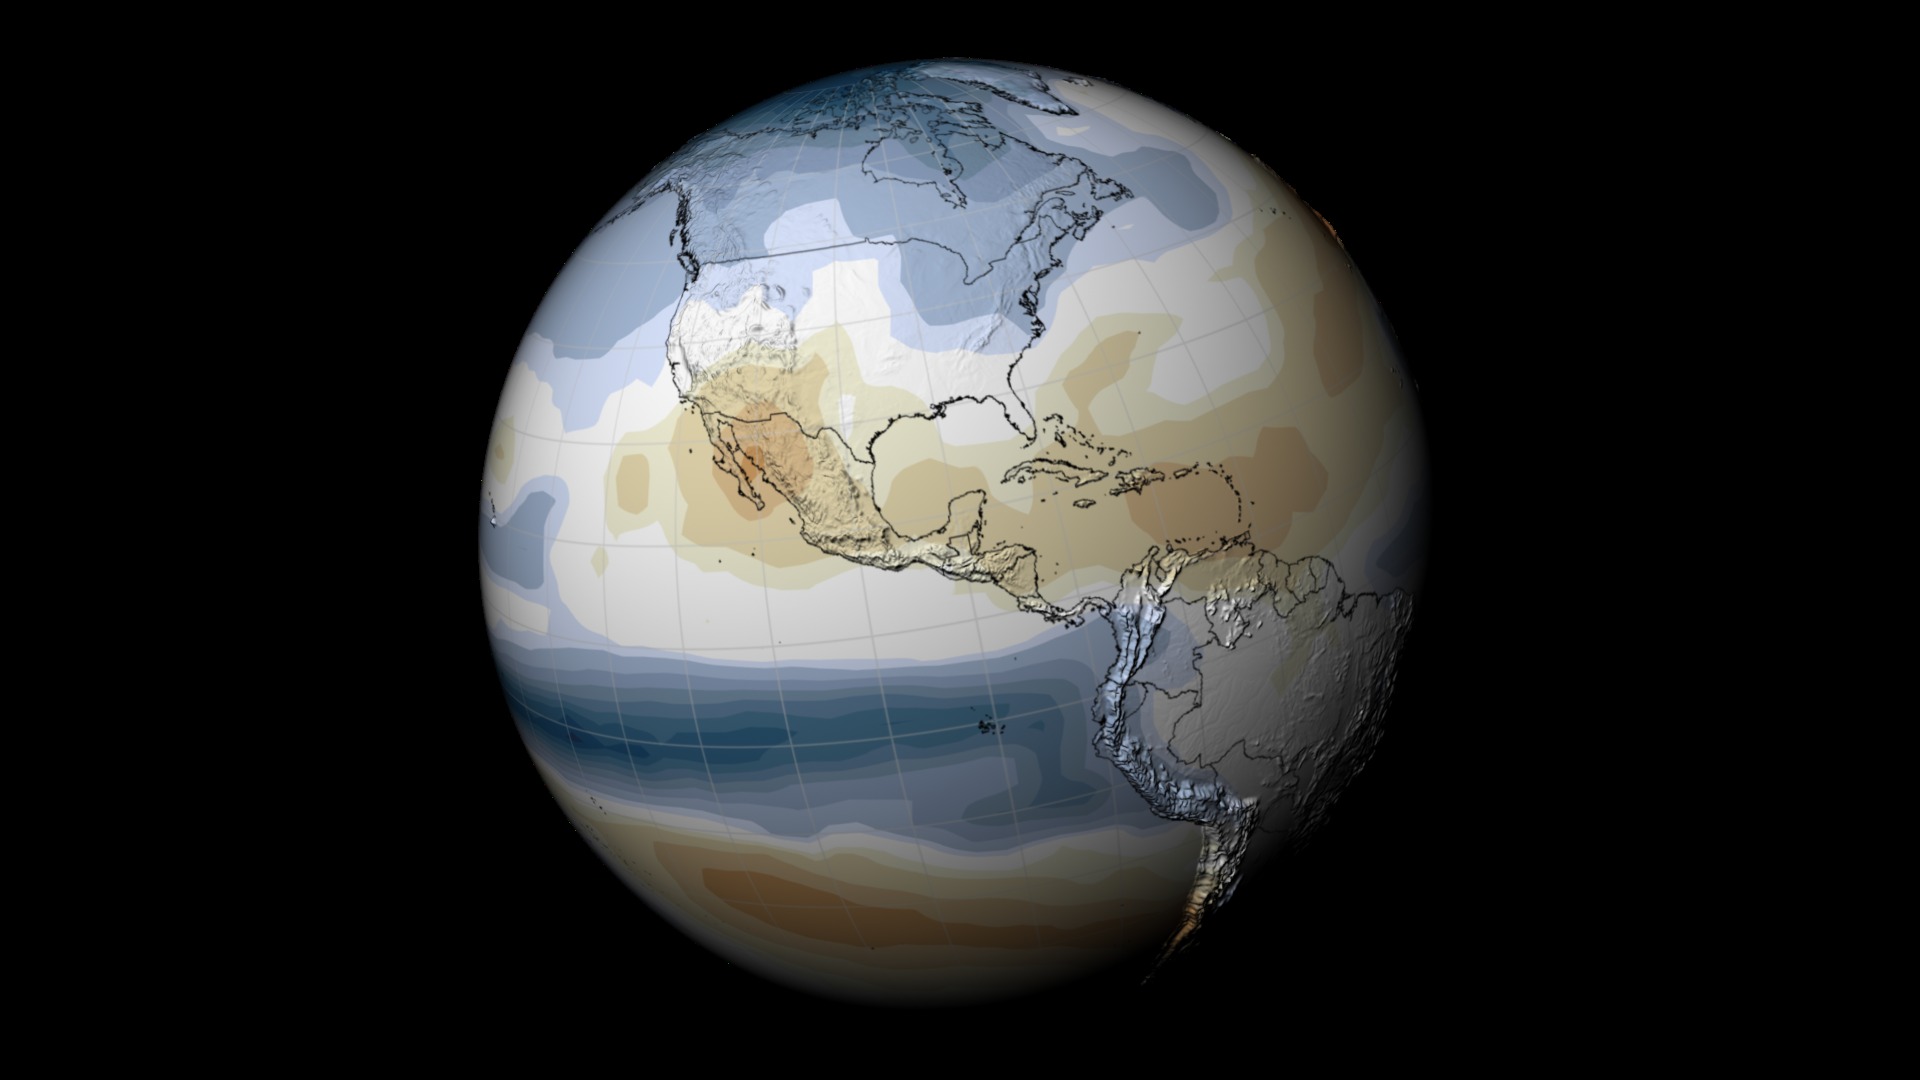
These visualizations represent the mean output of how certain groups of CMIP5 models responded to four different scenarios defined by the IPCC called Representative Concentration Pathways (RCPs). These four RCPs – 2.6, 4.5, 6 and 8.5 – represent a wide range of potential worldwide greenhouse gas emissions and sequestration scenarios for the coming century. The pathways are numbered based on the expected Watts per square meter – essentially a measure of how much heat energy is being trapped by the climate system – each scenario would produce. The pathways are partly based on the ultimate concentrations of carbon dioxide and other greenhouse gases. The current carbon dioxide concentration in the atmosphere is around 400 parts per million, up from less than 300 parts per million at the end of the 19th century.
The carbon dioxide concentrations in the year 2100 for each RCP are:
RCP 2.6: 421 ppm
RCP 4.5: 538 ppm
RCP 6: 670 ppm
RCP 8.5: 936 ppm
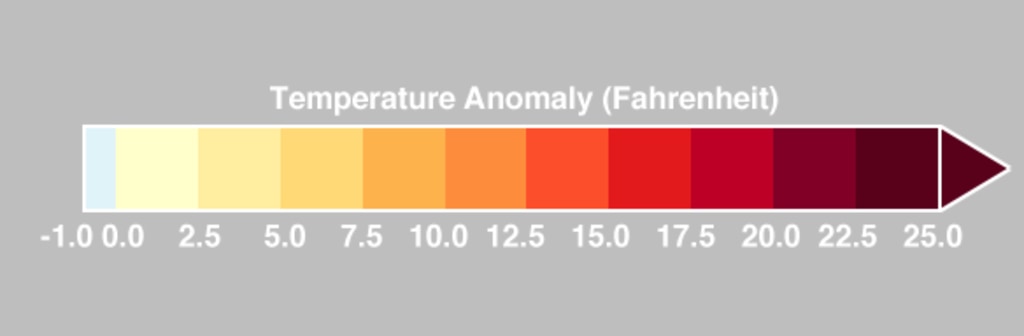
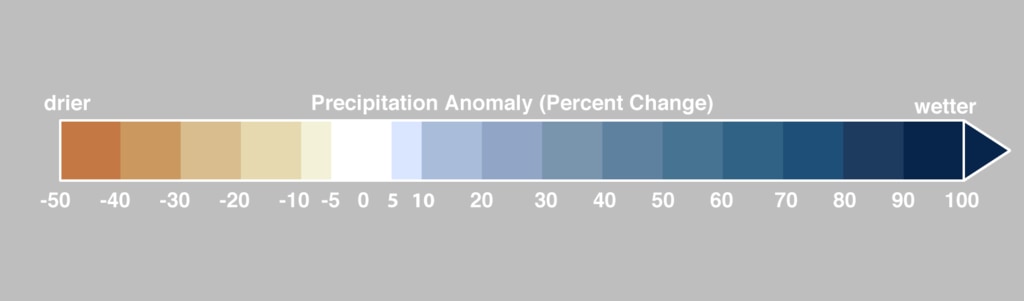
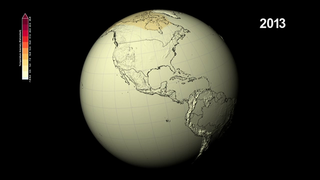
Each visualization represents the mean output of a different number of models for each RCP, because data from all models in the CMIP5 project was not available in the same format for visualization for each RCP. All of the models compare a projection of temperatures and precipitation from 2006-2099 to a baseline historical average from 1971-2000.
Thus, the values shown for each year represent the departure for that year compared to the observed average global surface temperature from 1971-2000. The IPCC report used 1986-2005 as a baseline period, making its reported anomalies slightly different from those shown in the visualizations.
Related
Visualization Credits
Greg Shirah (NASA/GSFC): Animator
Matthew R. Radcliff (USRA): Producer
Gerald Potter (USRA): Scientist
Laura Carriere (CSC): Scientist
Jay Alder (USGS): Scientist
Ellen Salmon (NASA/GSFC): Scientist
Michael Wehner (Lawrence Berkeley National Laboratory): Scientist
Dean Williams (Lawrence Livermore National Laboratory): Scientist
Jarrett Cohen (GST): Project Support
Patrick Lynch (Wyle Information Systems): Writer
NASA's Goddard Space Flight Center Scientific Visualization Studio
Additional credits should also go to the IPCC community, without whom these visualizations would not have been possible. Please click here for all the IPCC contributors.
https://svs.gsfc.nasa.gov/4110
Data Used:
Coupled Model Intercomparison Project Phase 5 also referred to as: CMIP5
Model - IPCC AR5Keywords:
DLESE >> Atmospheric science
SVS >> HDTV
GCMD >> Earth Science >> Atmosphere >> Atmospheric Temperature >> Temperature Anomalies
GCMD >> Earth Science >> Atmosphere >> Precipitation >> Precipitation Anomalies
SVS >> Hyperwall
NASA Science >> Earth
GCMD keywords can be found on the Internet with the following citation: Olsen, L.M., G. Major, K. Shein, J. Scialdone, S. Ritz, T. Stevens, M. Morahan, A. Aleman, R. Vogel, S. Leicester, H. Weir, M. Meaux, S. Grebas, C.Solomon, M. Holland, T. Northcutt, R. A. Restrepo, R. Bilodeau, 2013. NASA/Global Change Master Directory (GCMD) Earth Science Keywords. Version 8.0.0.0.0


