Life Histories from Landsat: 25 Years in the Pacific Northwest Forest
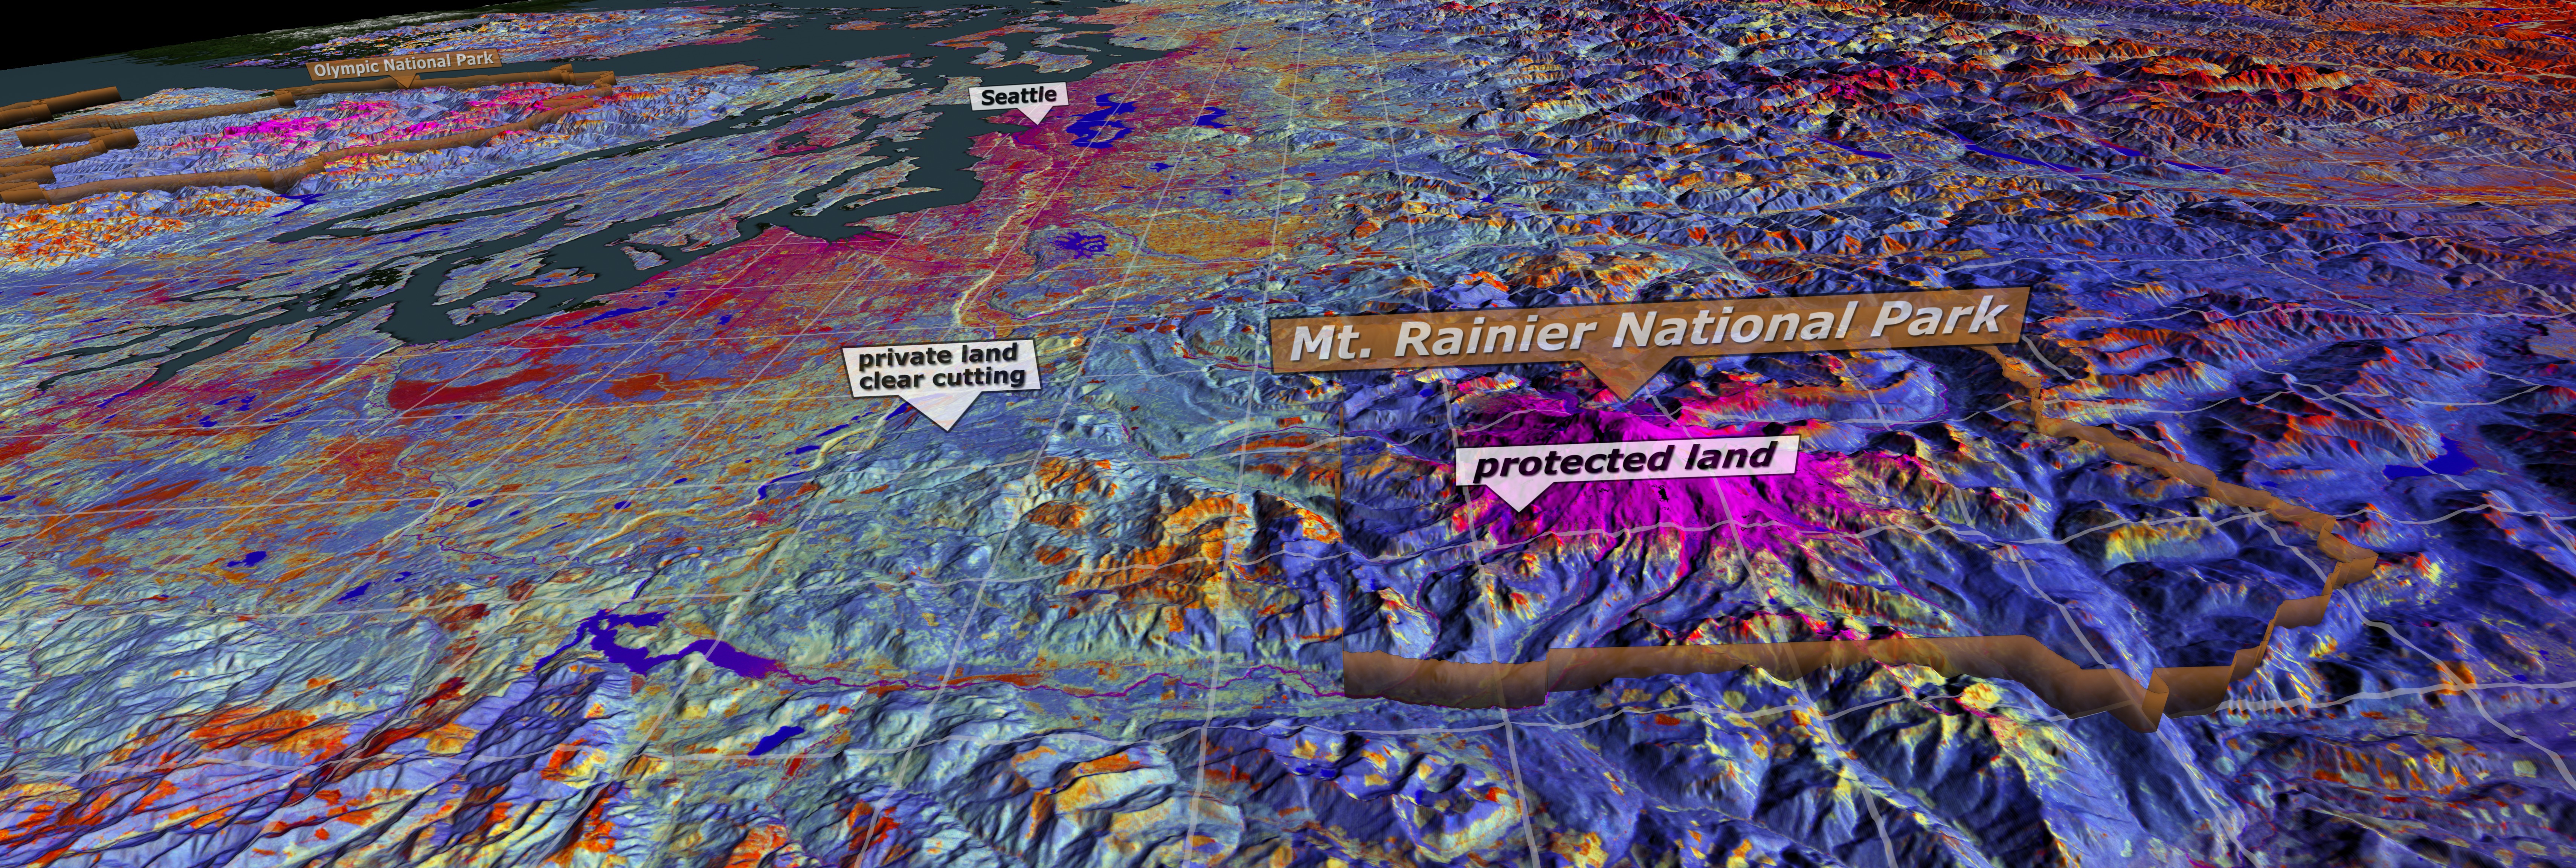
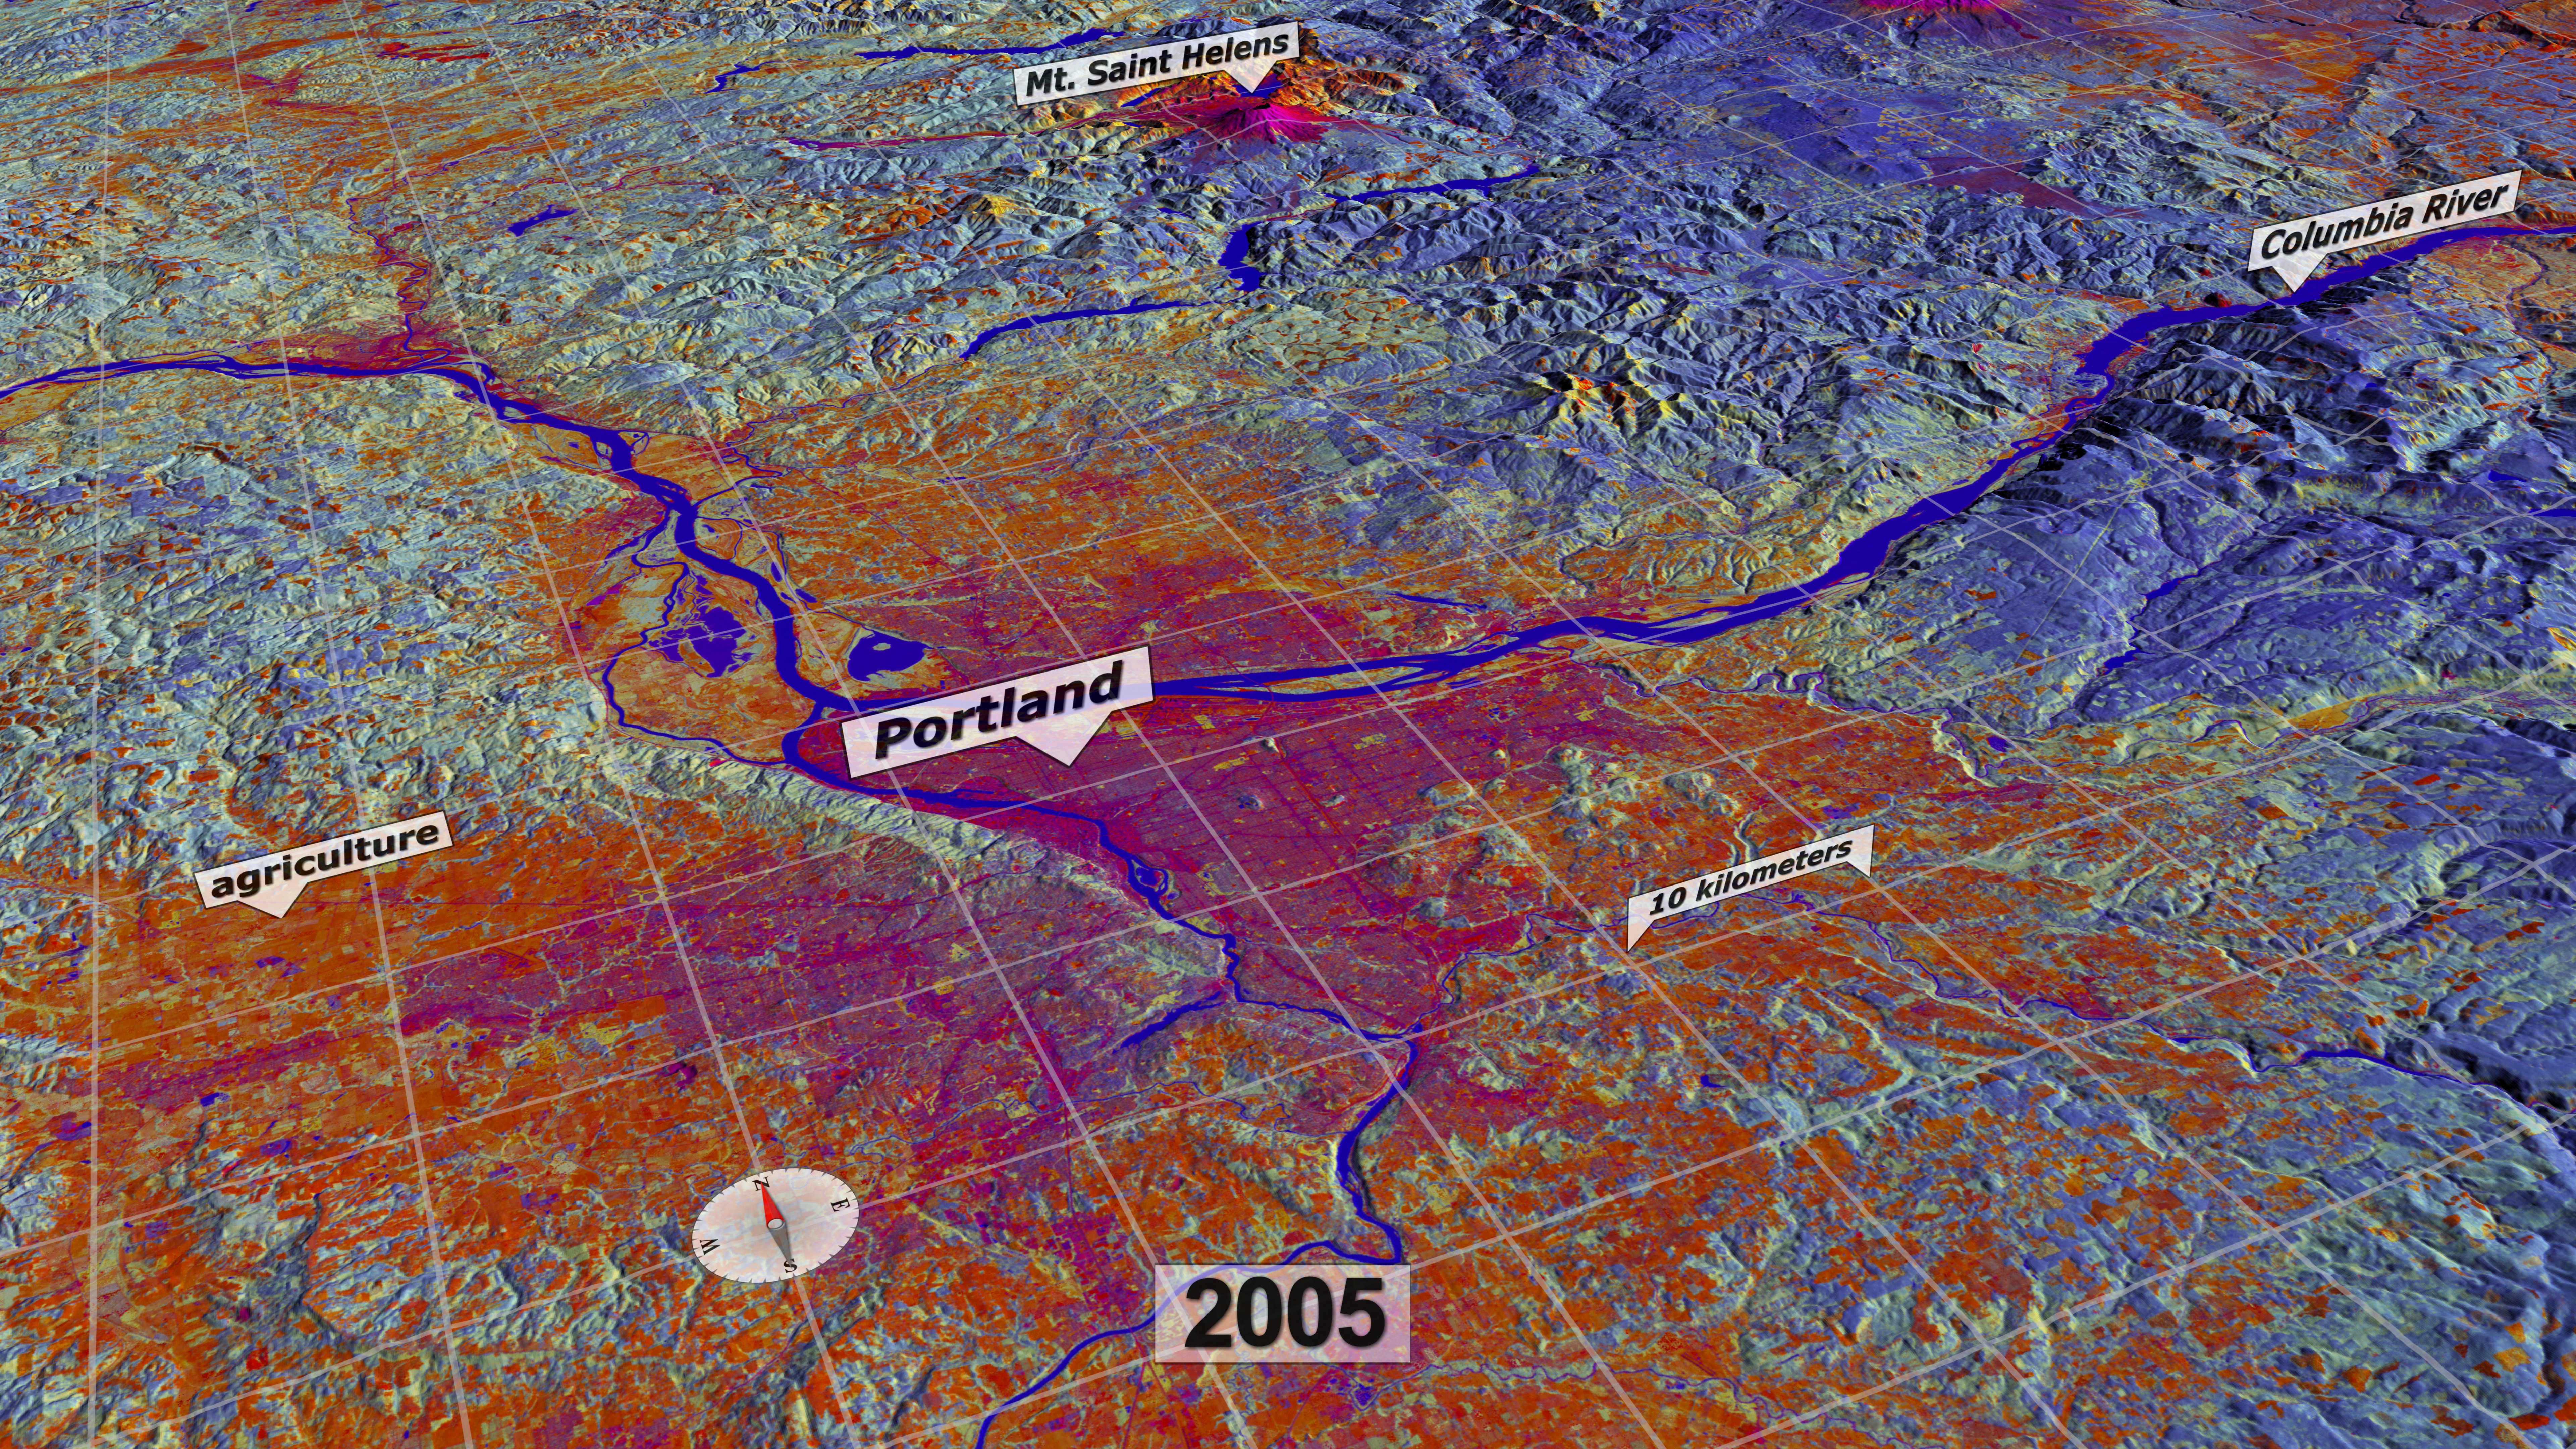
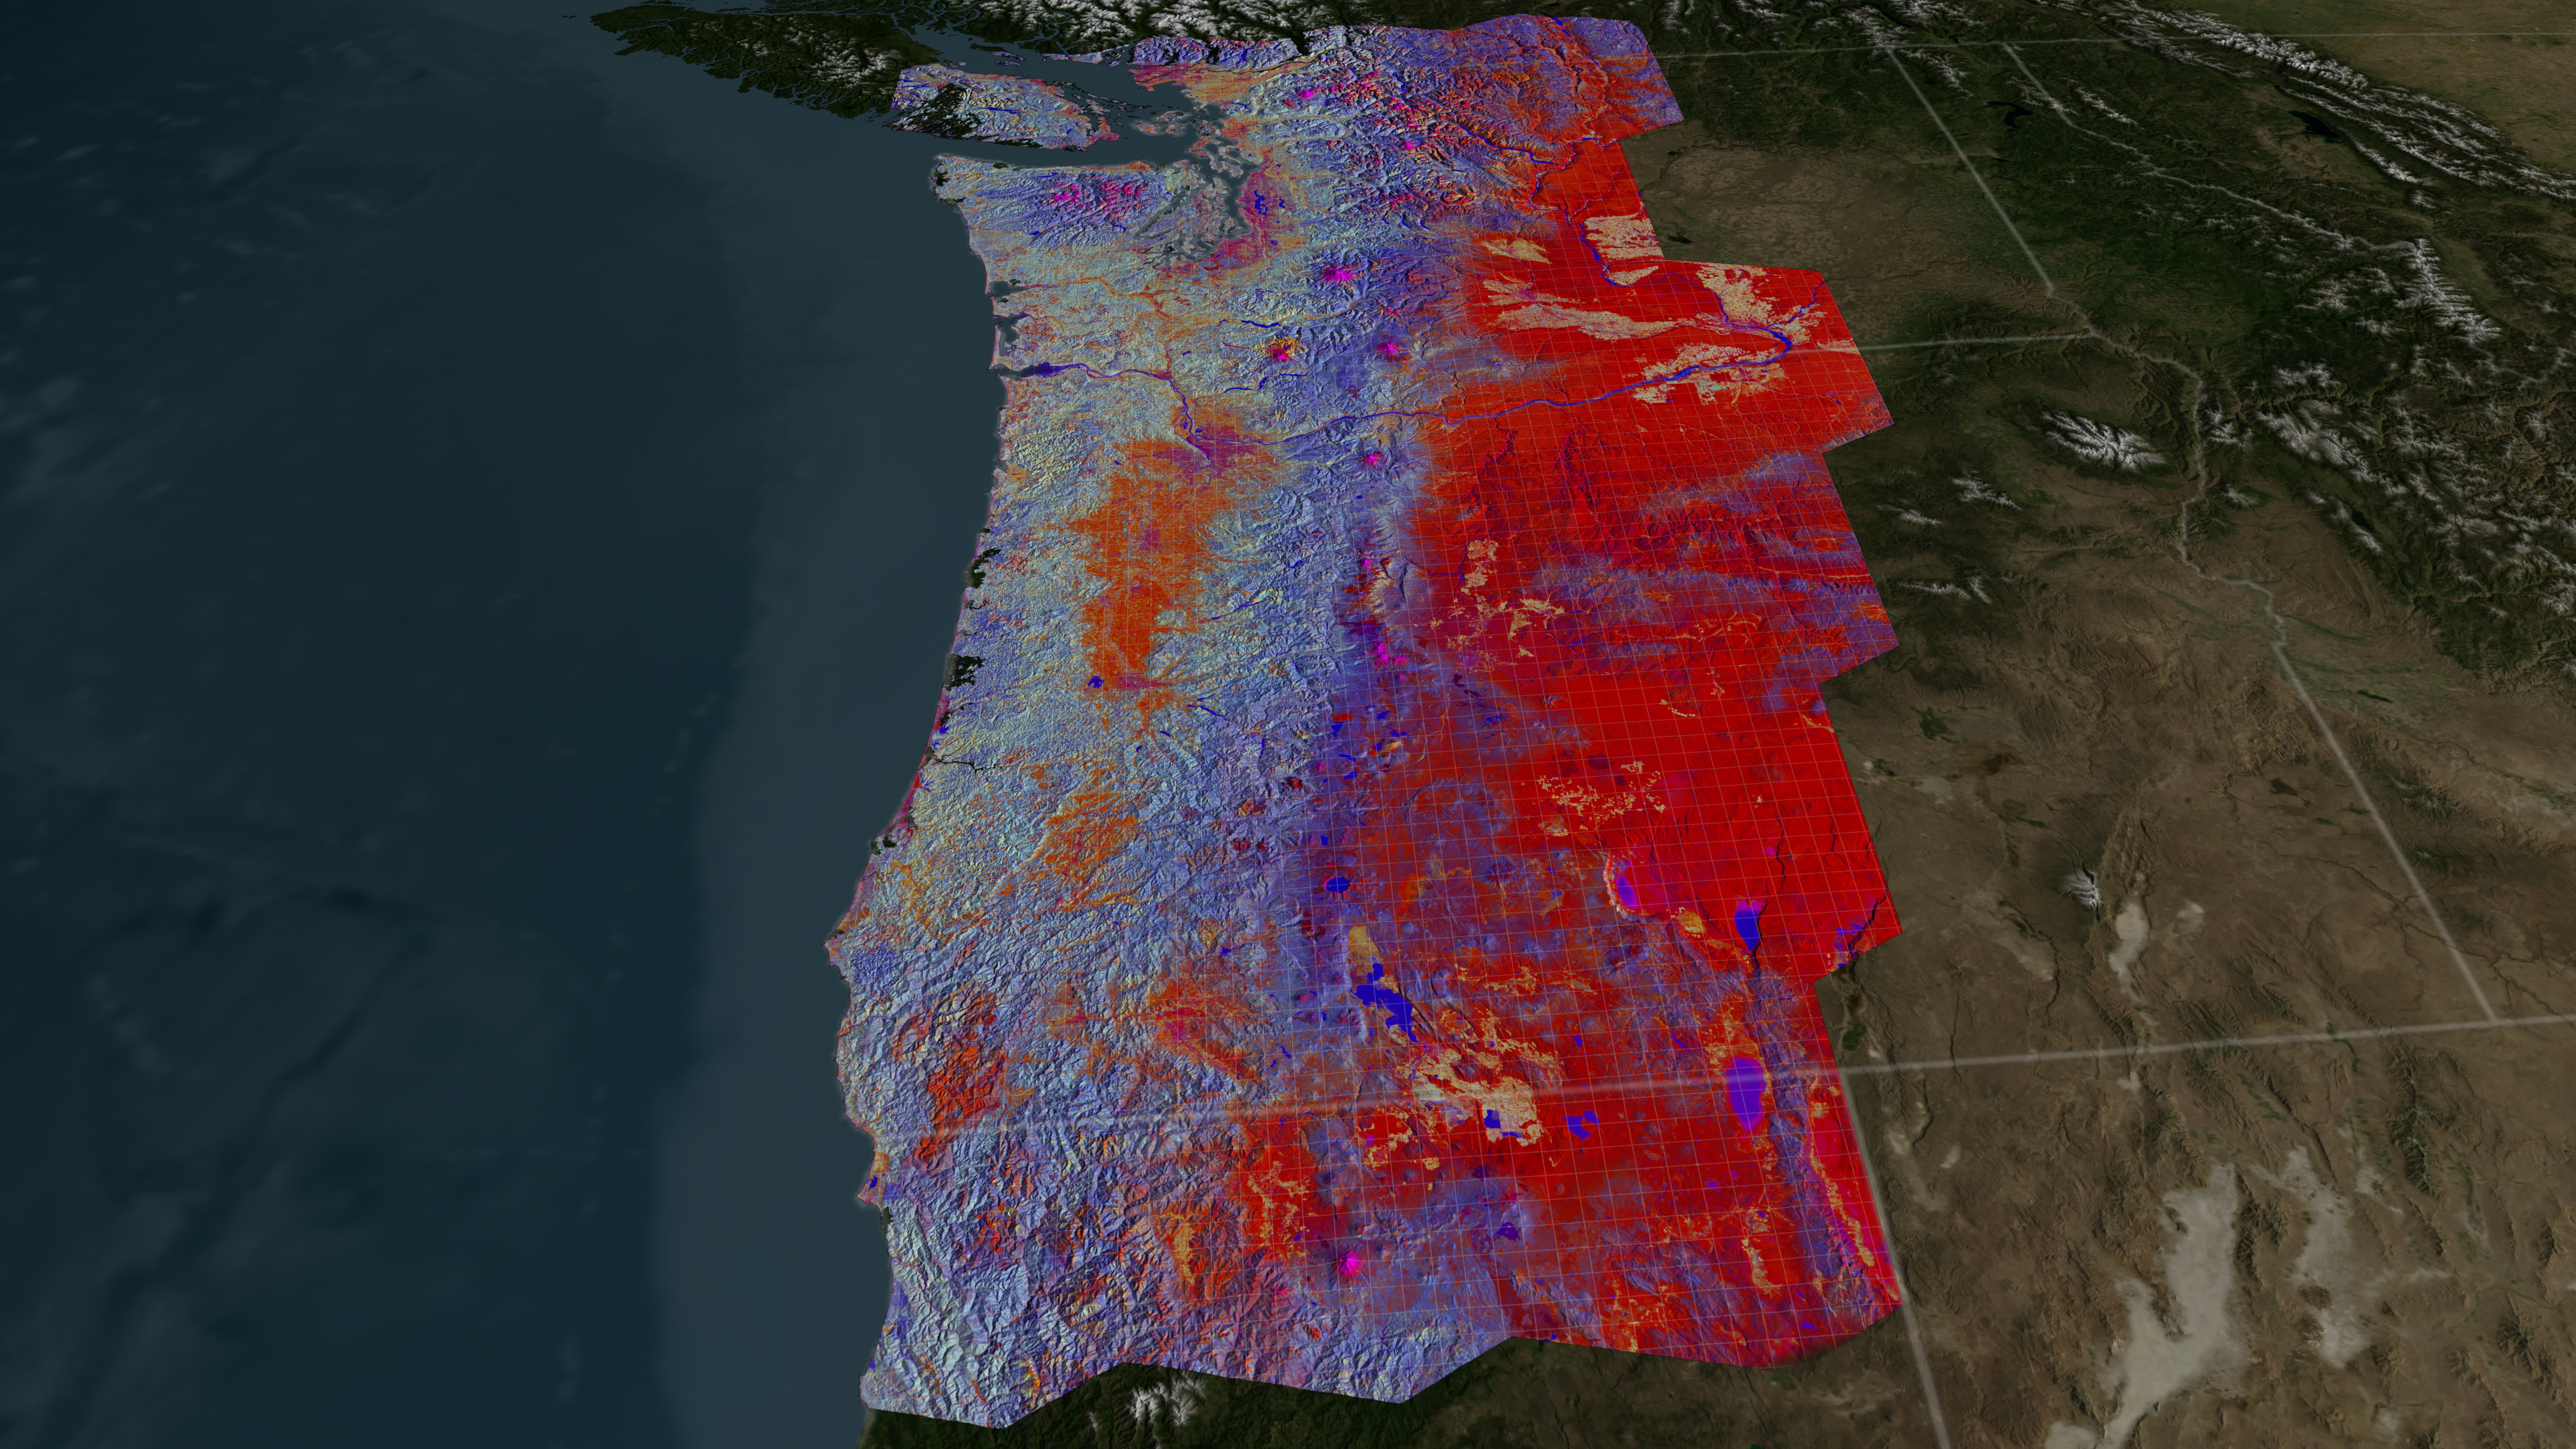
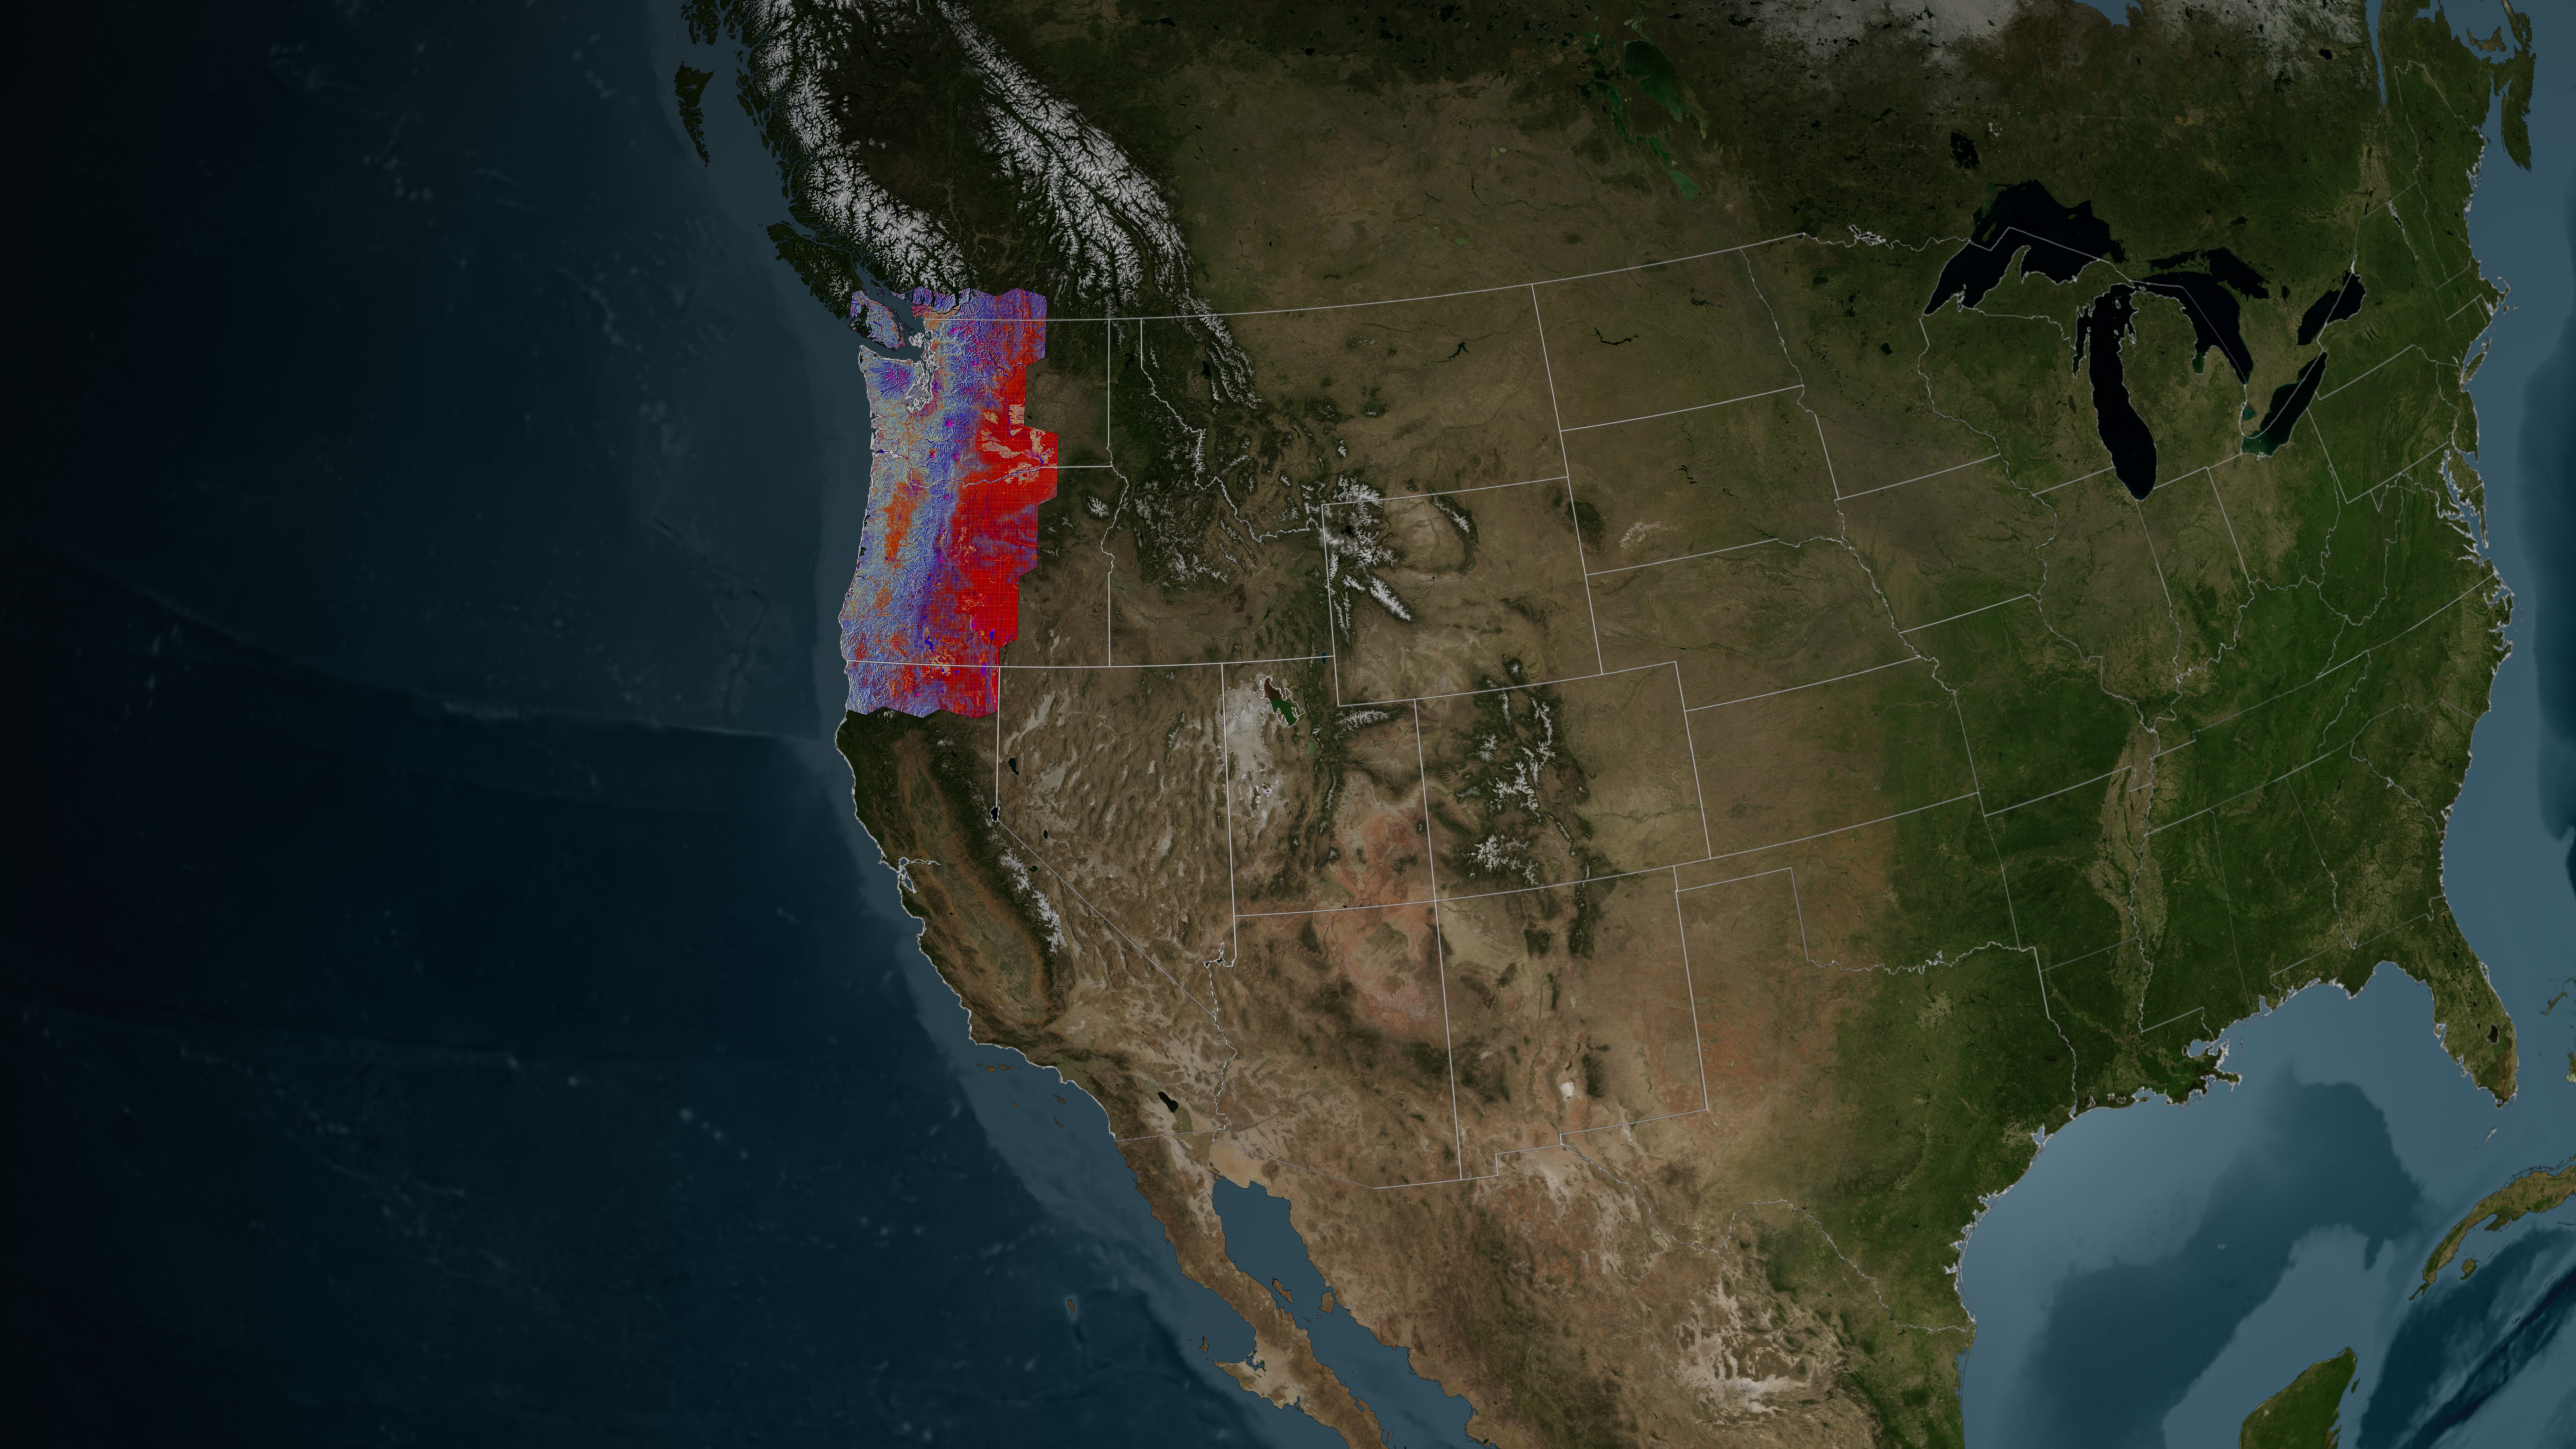
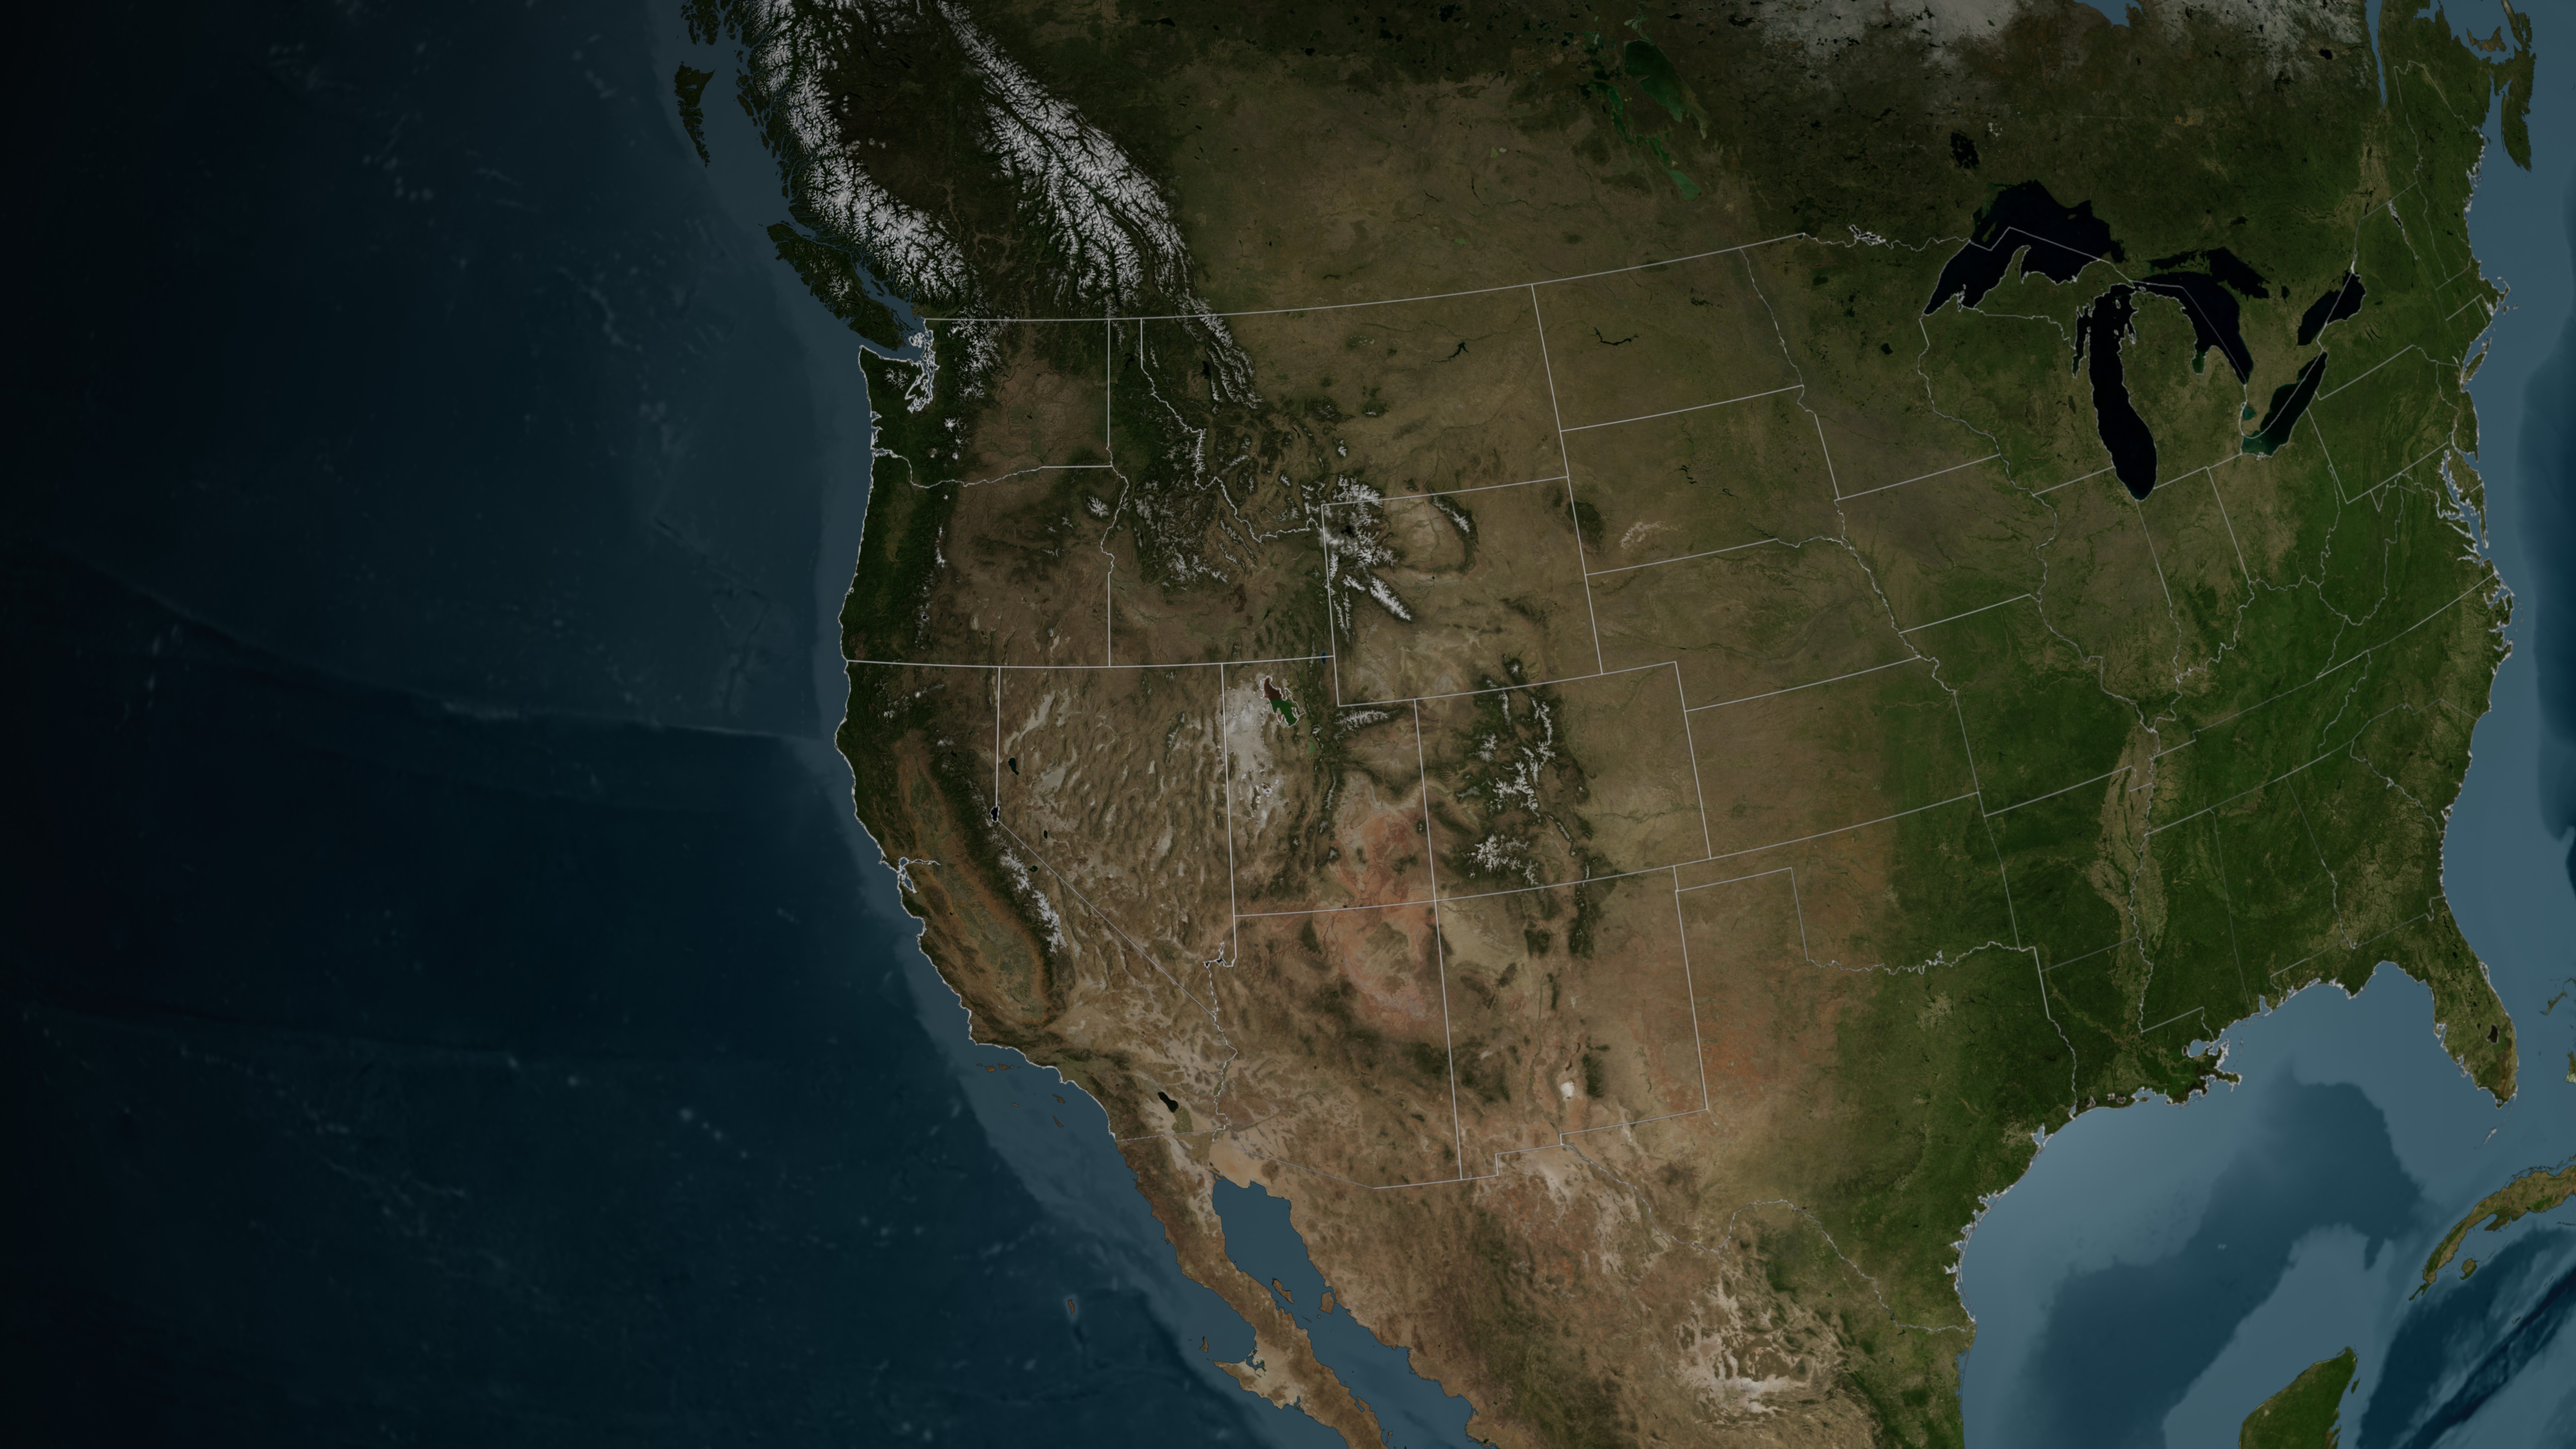
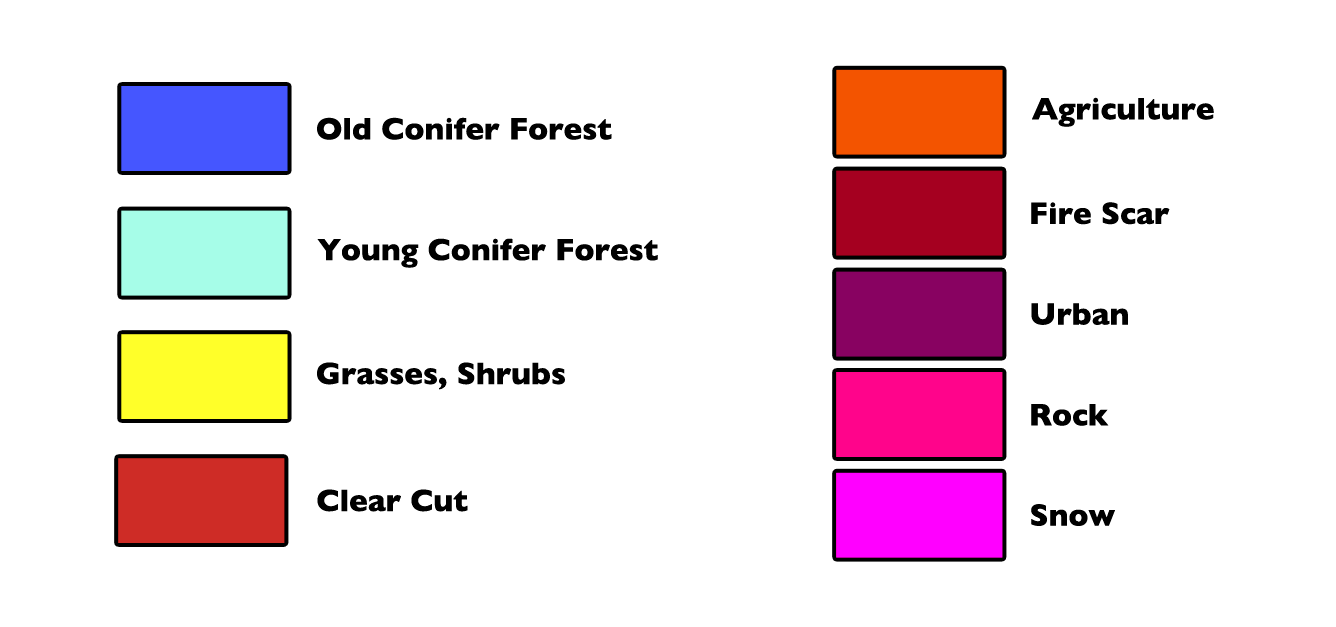
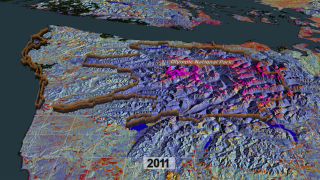
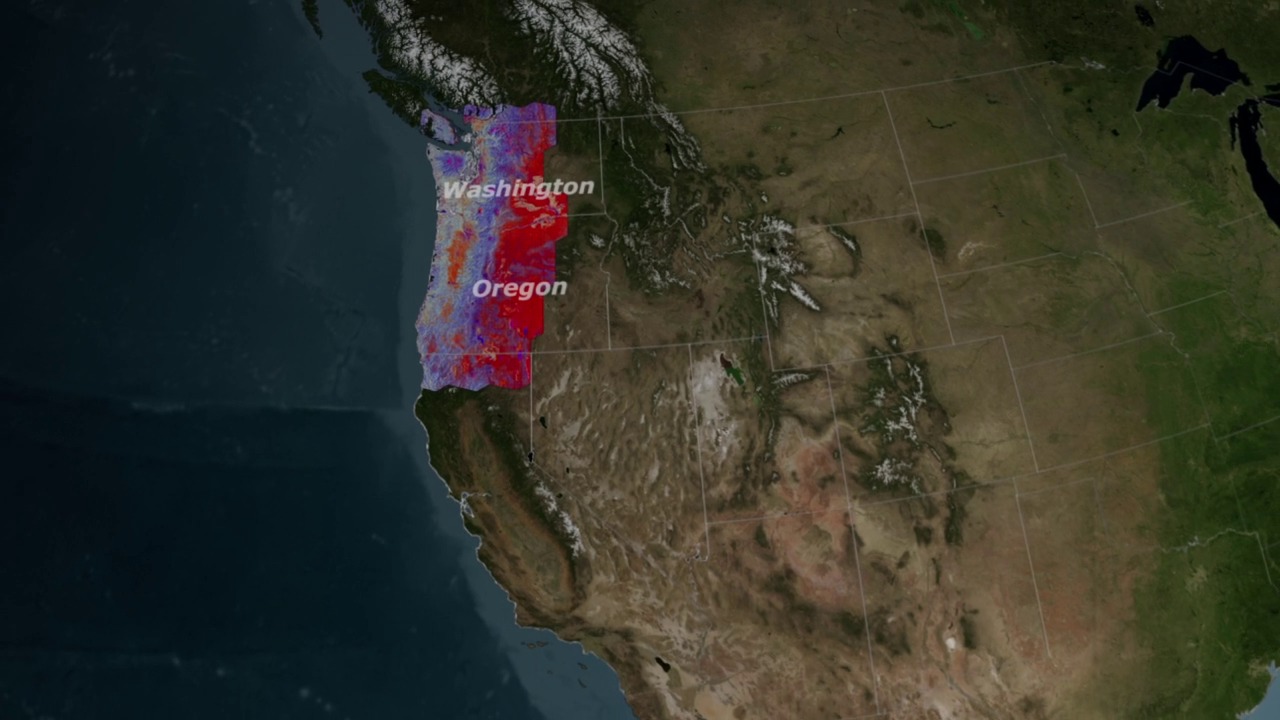
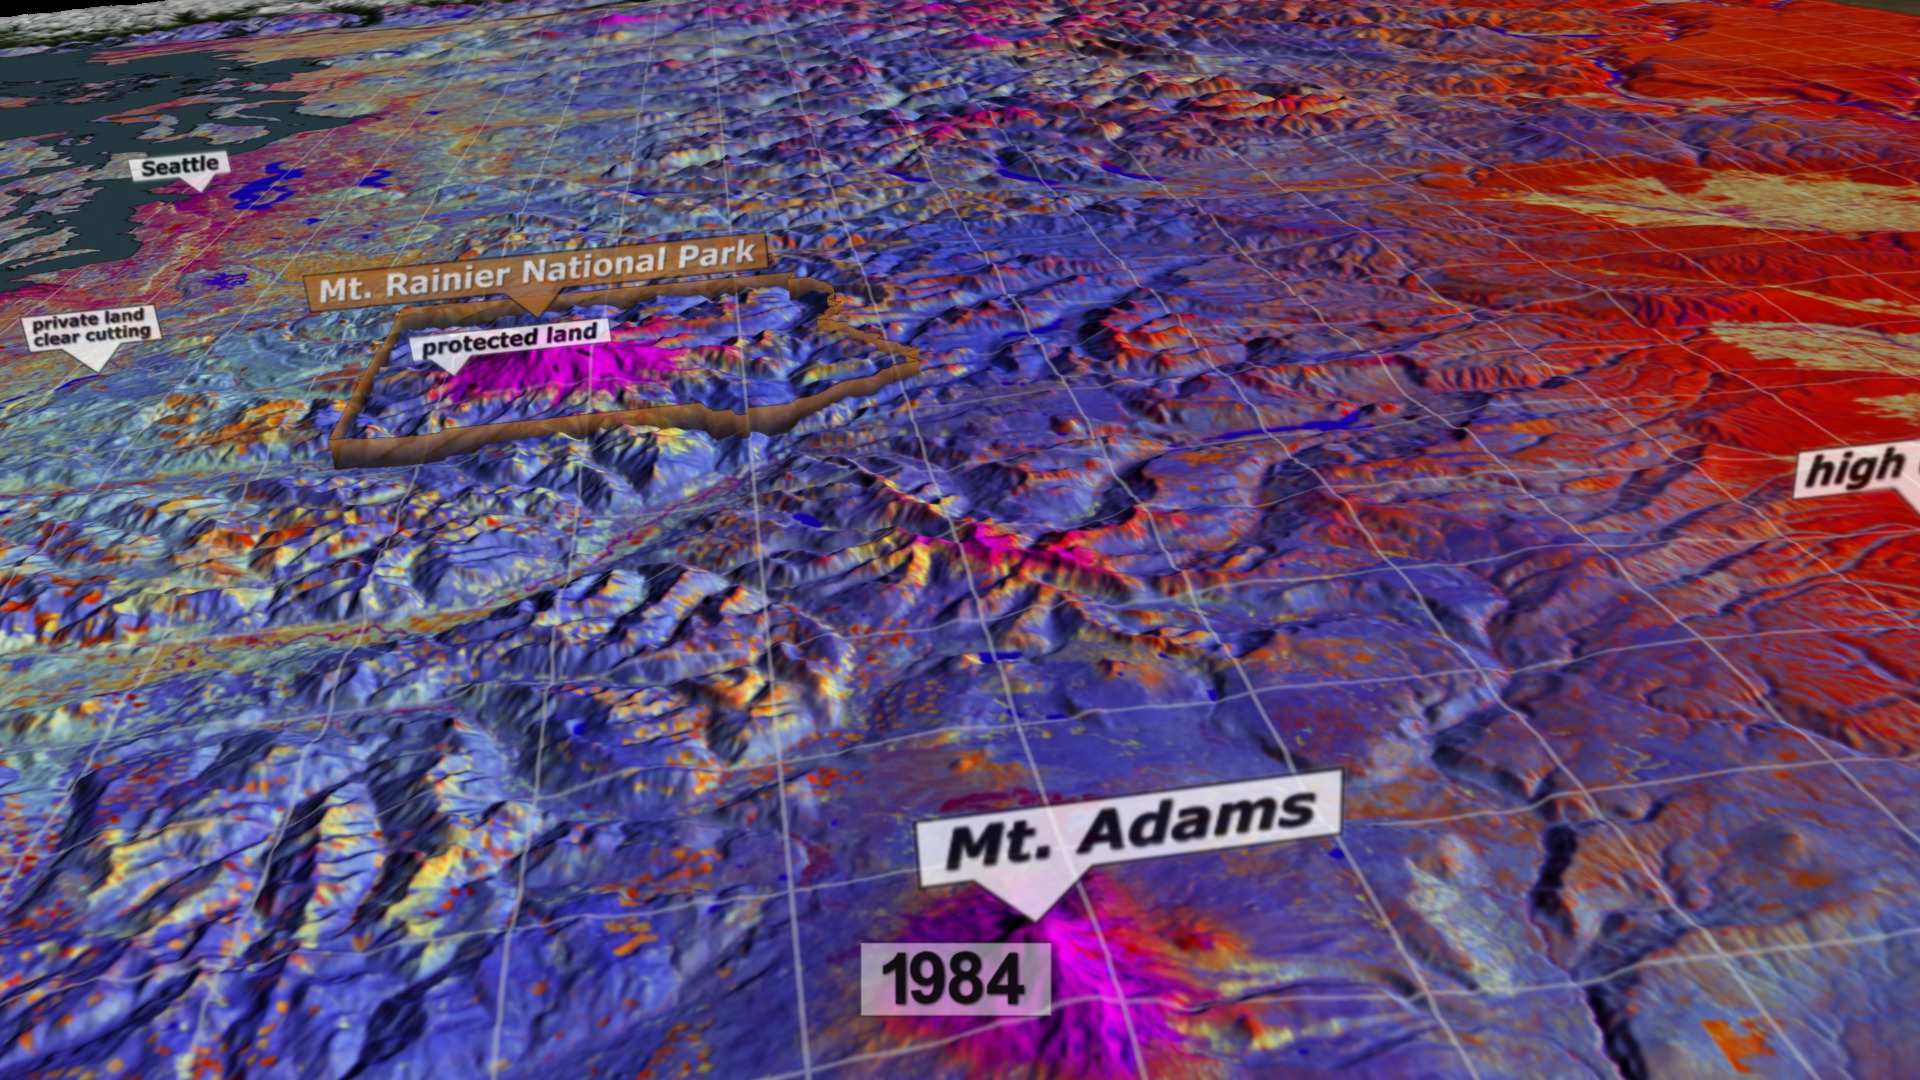
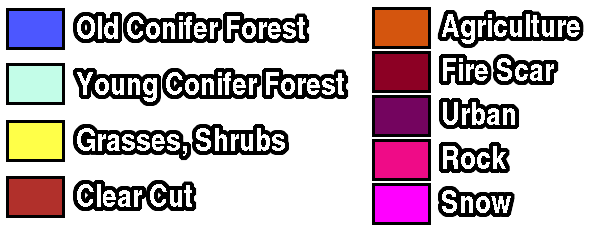
In these false color images, the colors represent types of land; for example, blue areas are forests; orange/yellow areas are agriculture; and, purple areas are urban. Each 'stack' is representative of a Landsat scene. There are 22 stacks stitched together to cover most of the U.S. Pacific Northwest. This processed data is used for science, natural resource management, and education.
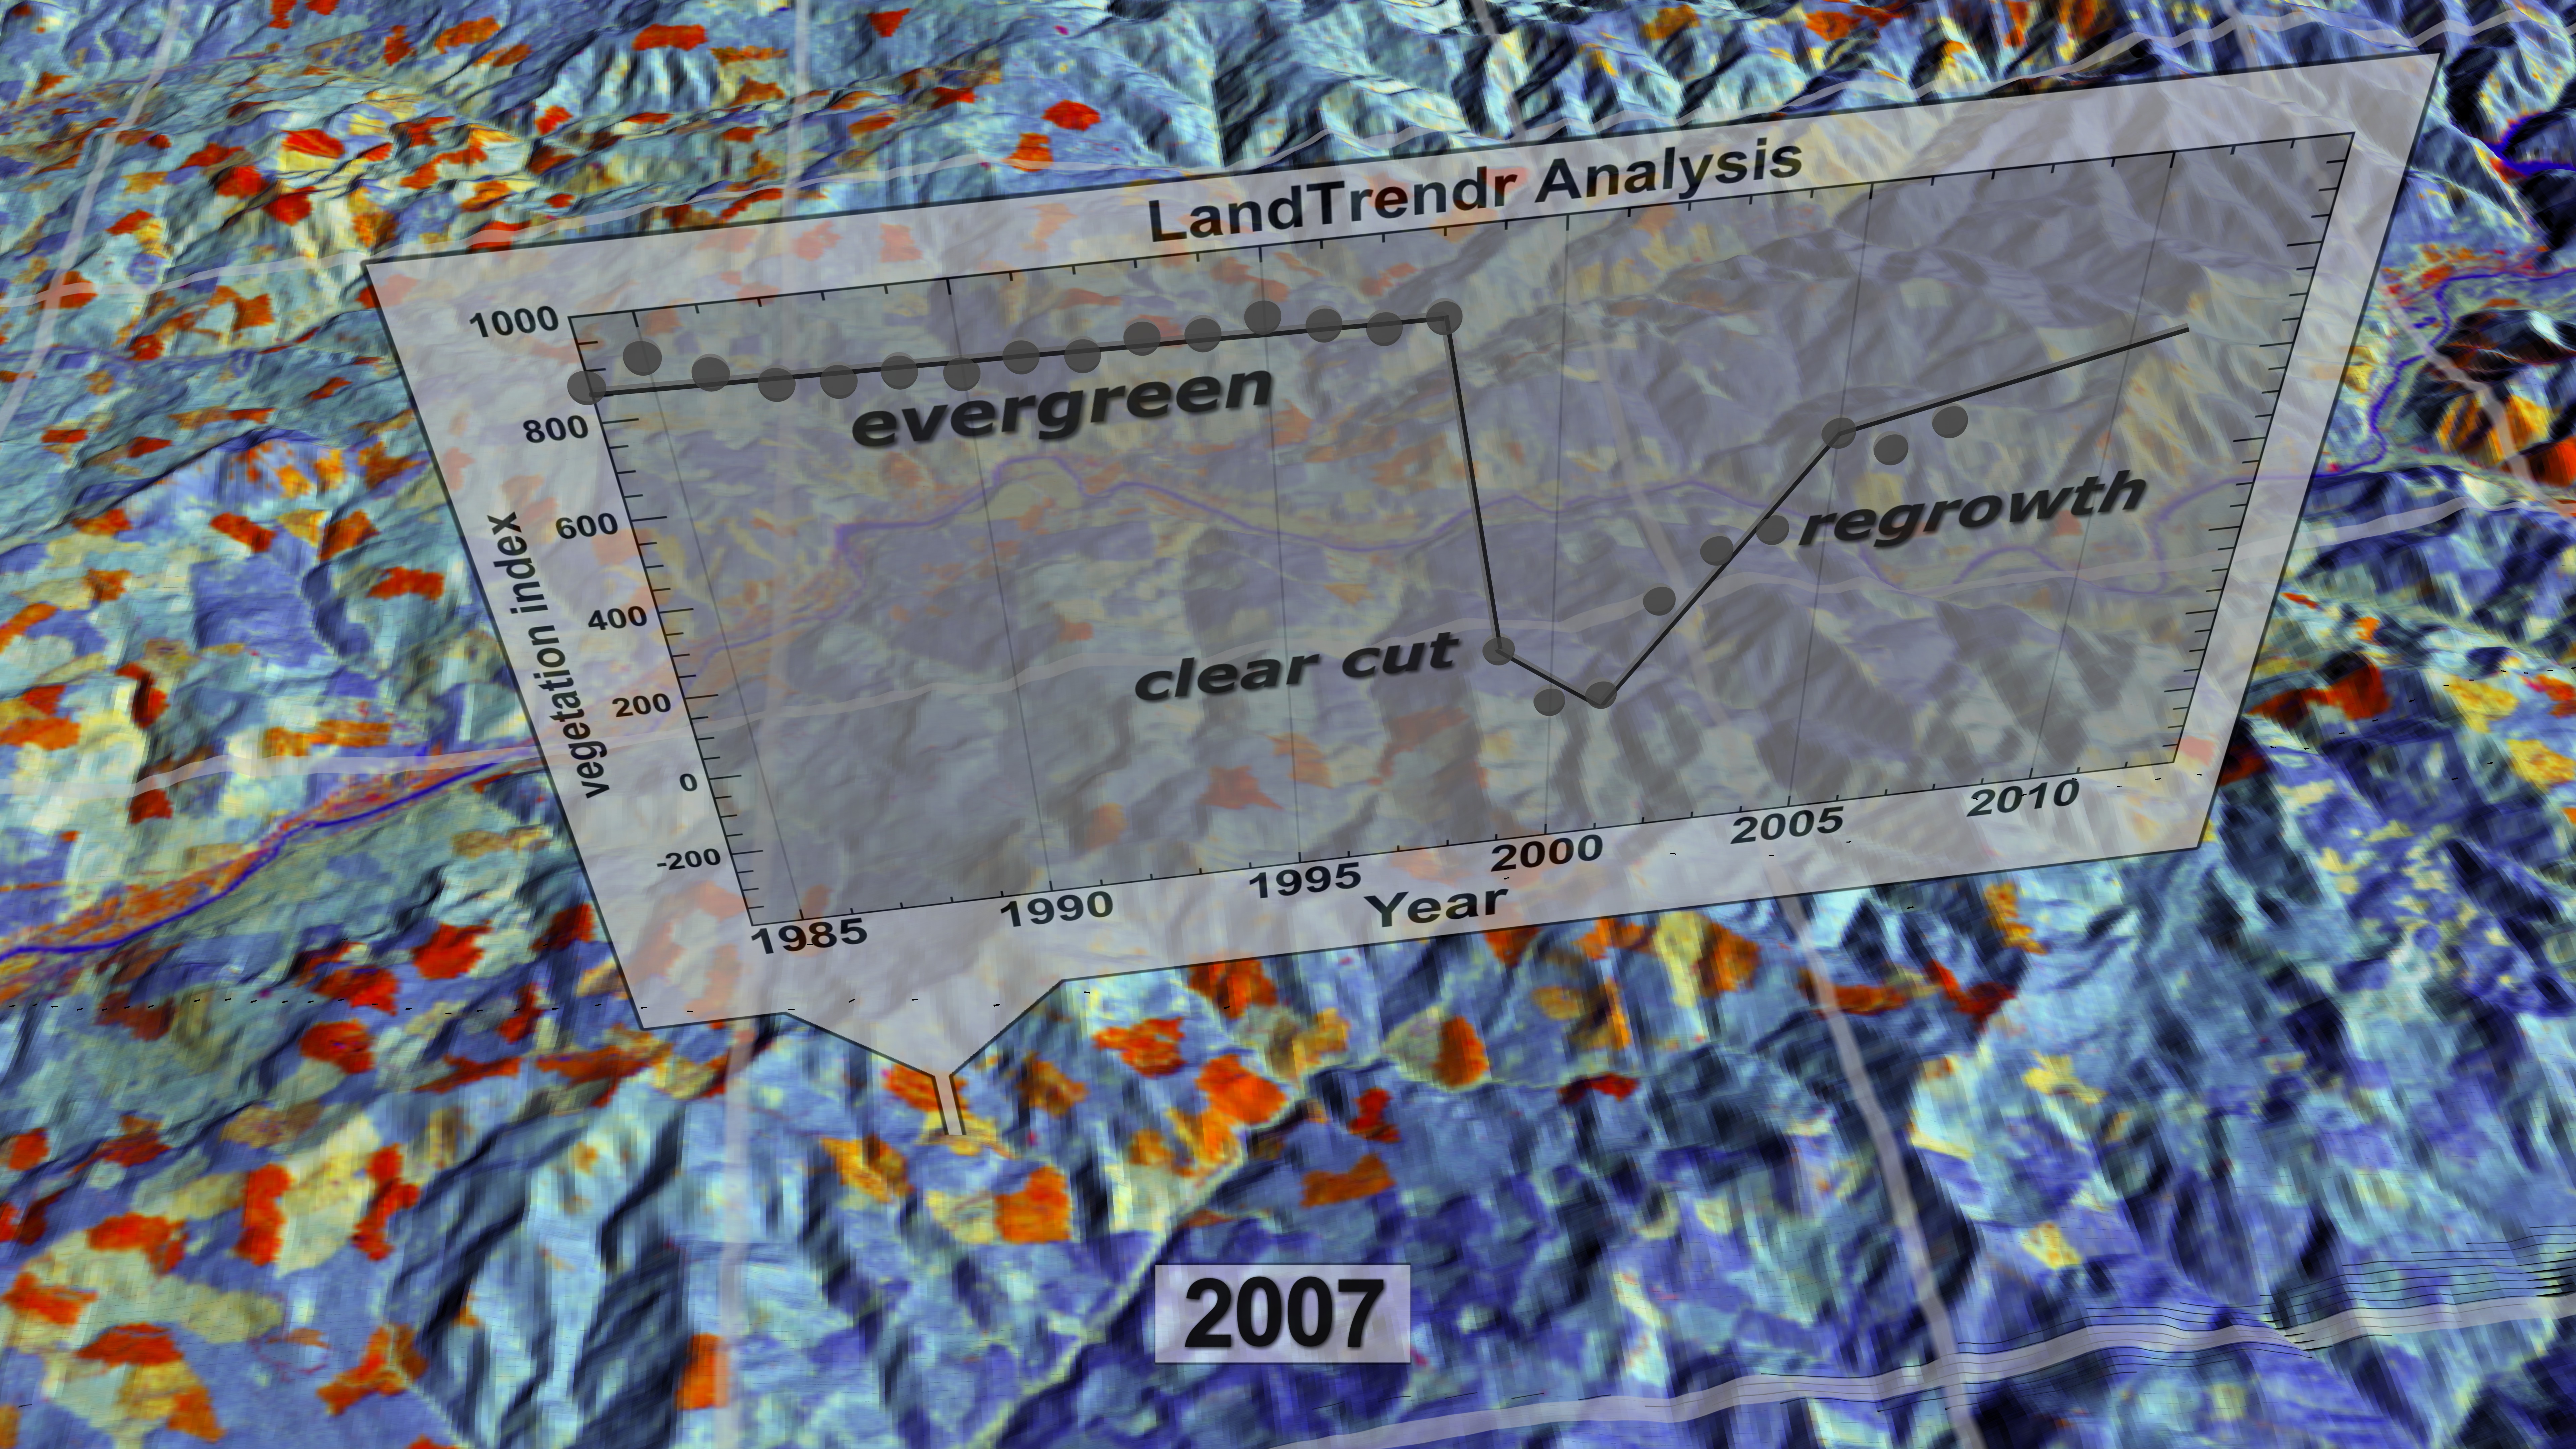
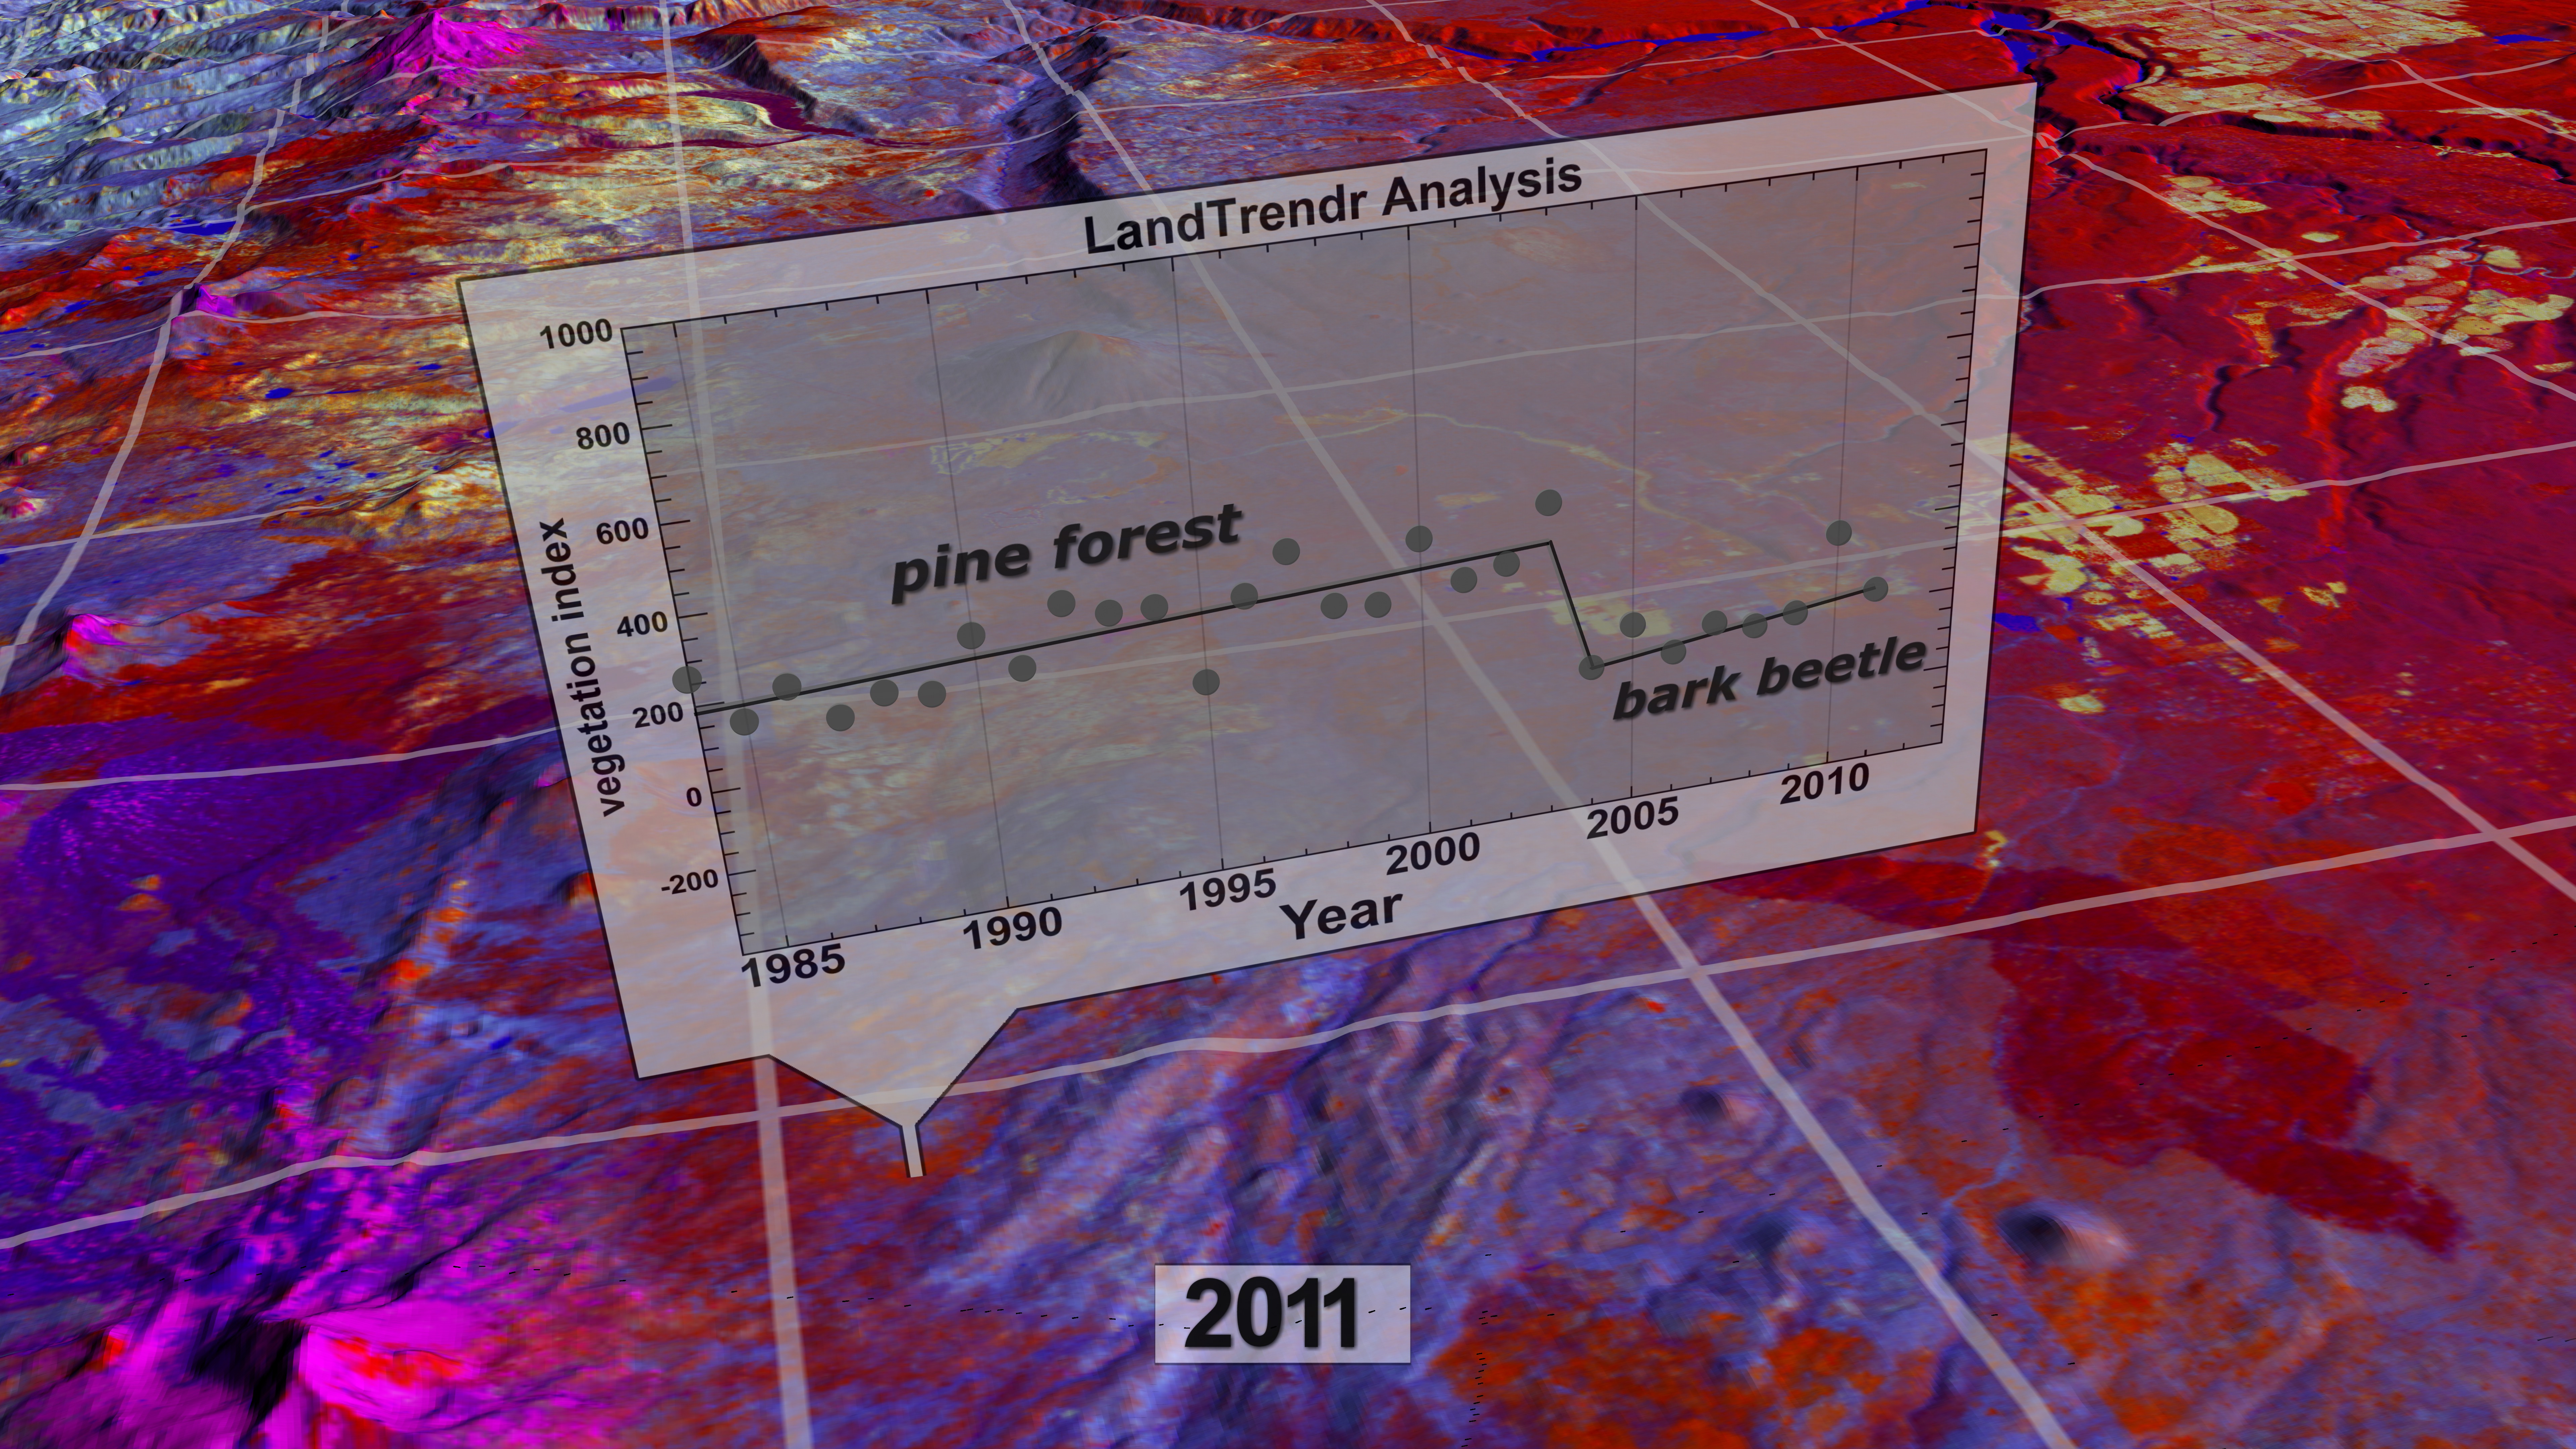
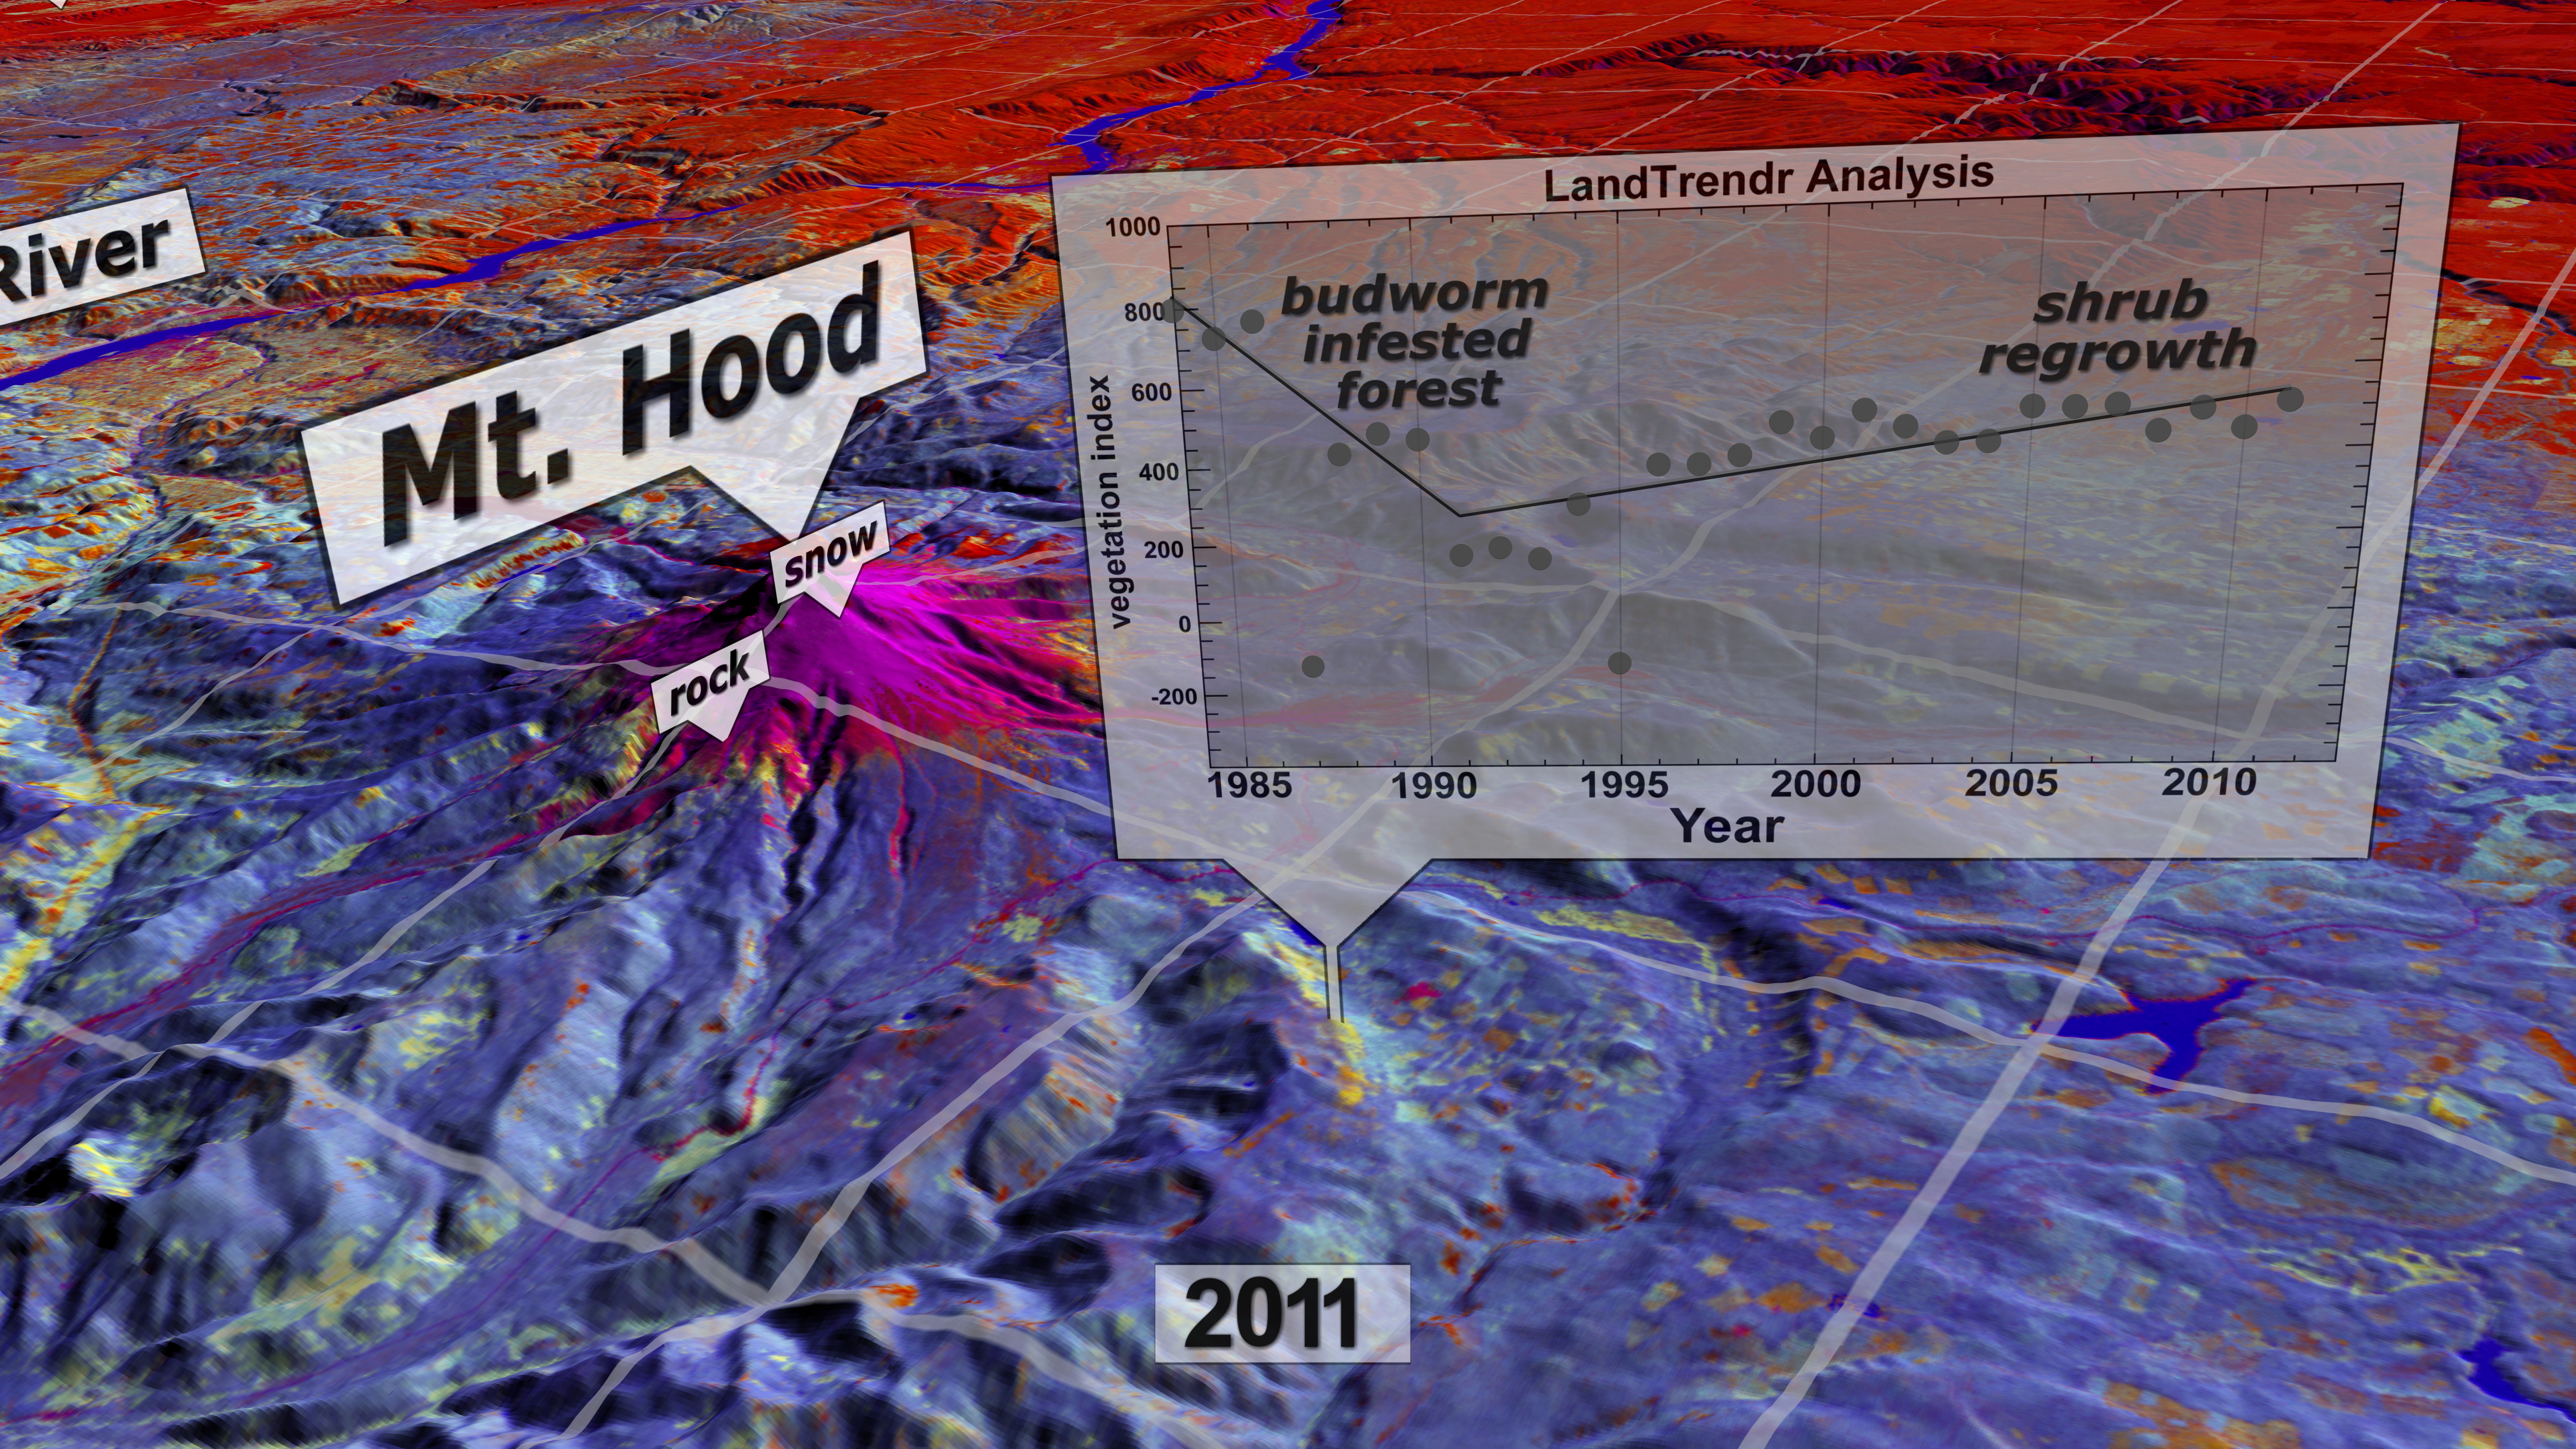
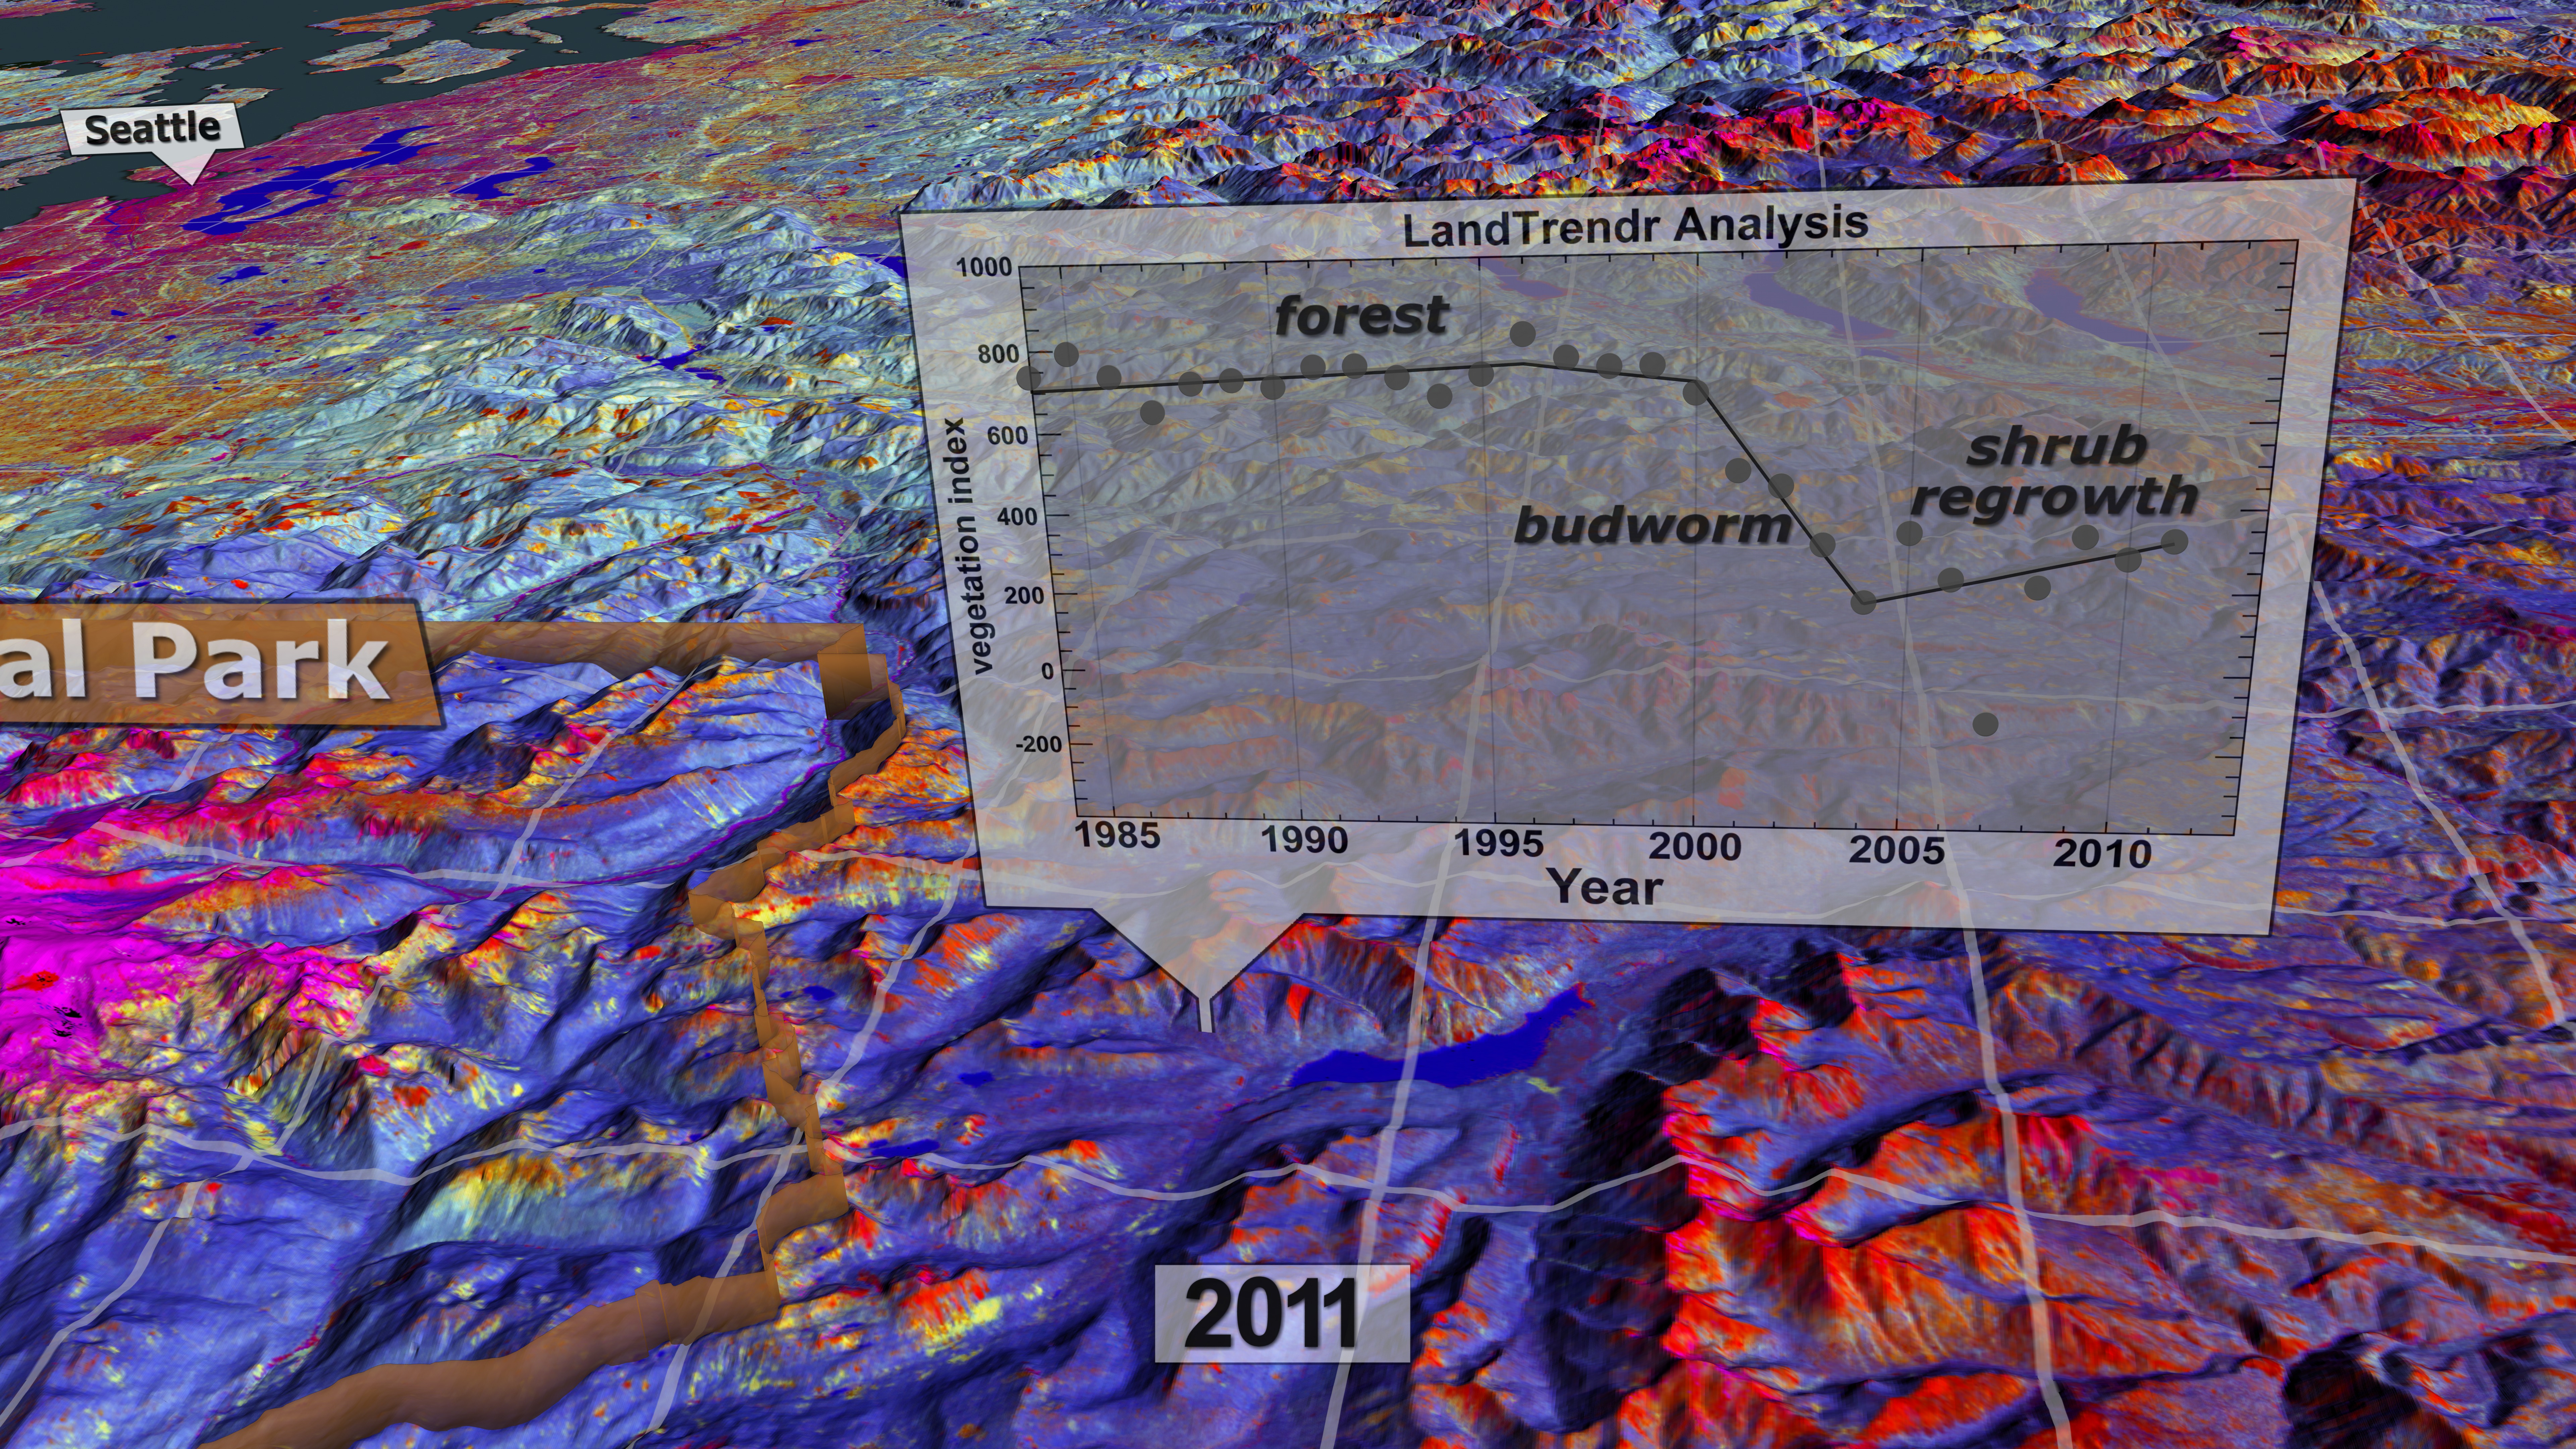
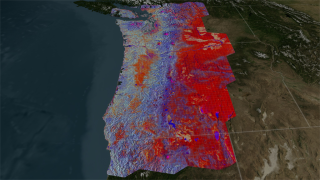
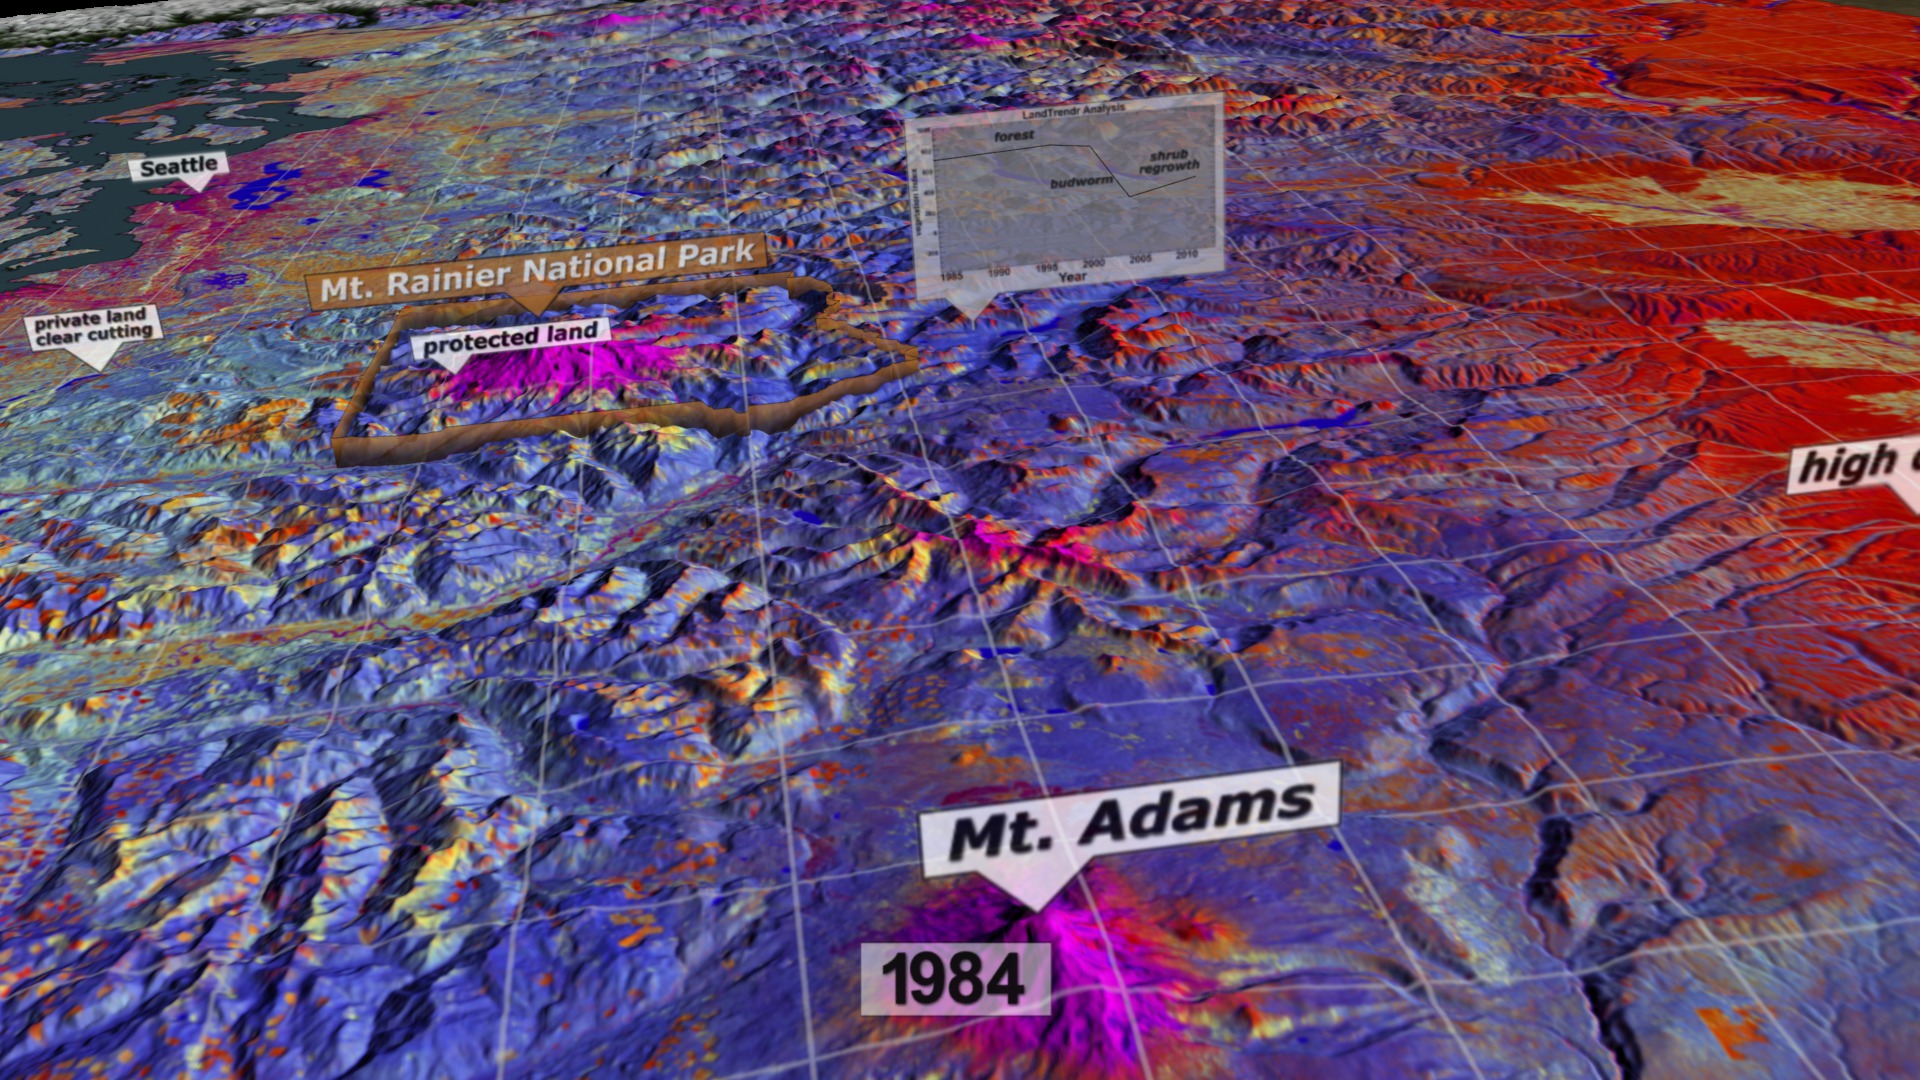
The visualization zooms into the Portland area showing different types of land such as agricultural, urban, and forests. We move south to a region that was evergreen forest for a number of years (blue), then was clear cut in 1999 (orange), then began to regrow (yellow). A graph shows the trajectories for a particular location in the clearcut as the years repeat. The dots represent the original data from Landsat; and, the line represents LandTrendr analysis. We move over to the Three Sisters region to show an area of pine forest that becomes infested with bark beetles in 2004. Next, we move to the southern foothills of Mount Hood where a budworm infestation is in progress; around 1991, the worms move on to another area and shrubs start to regrow. Next we
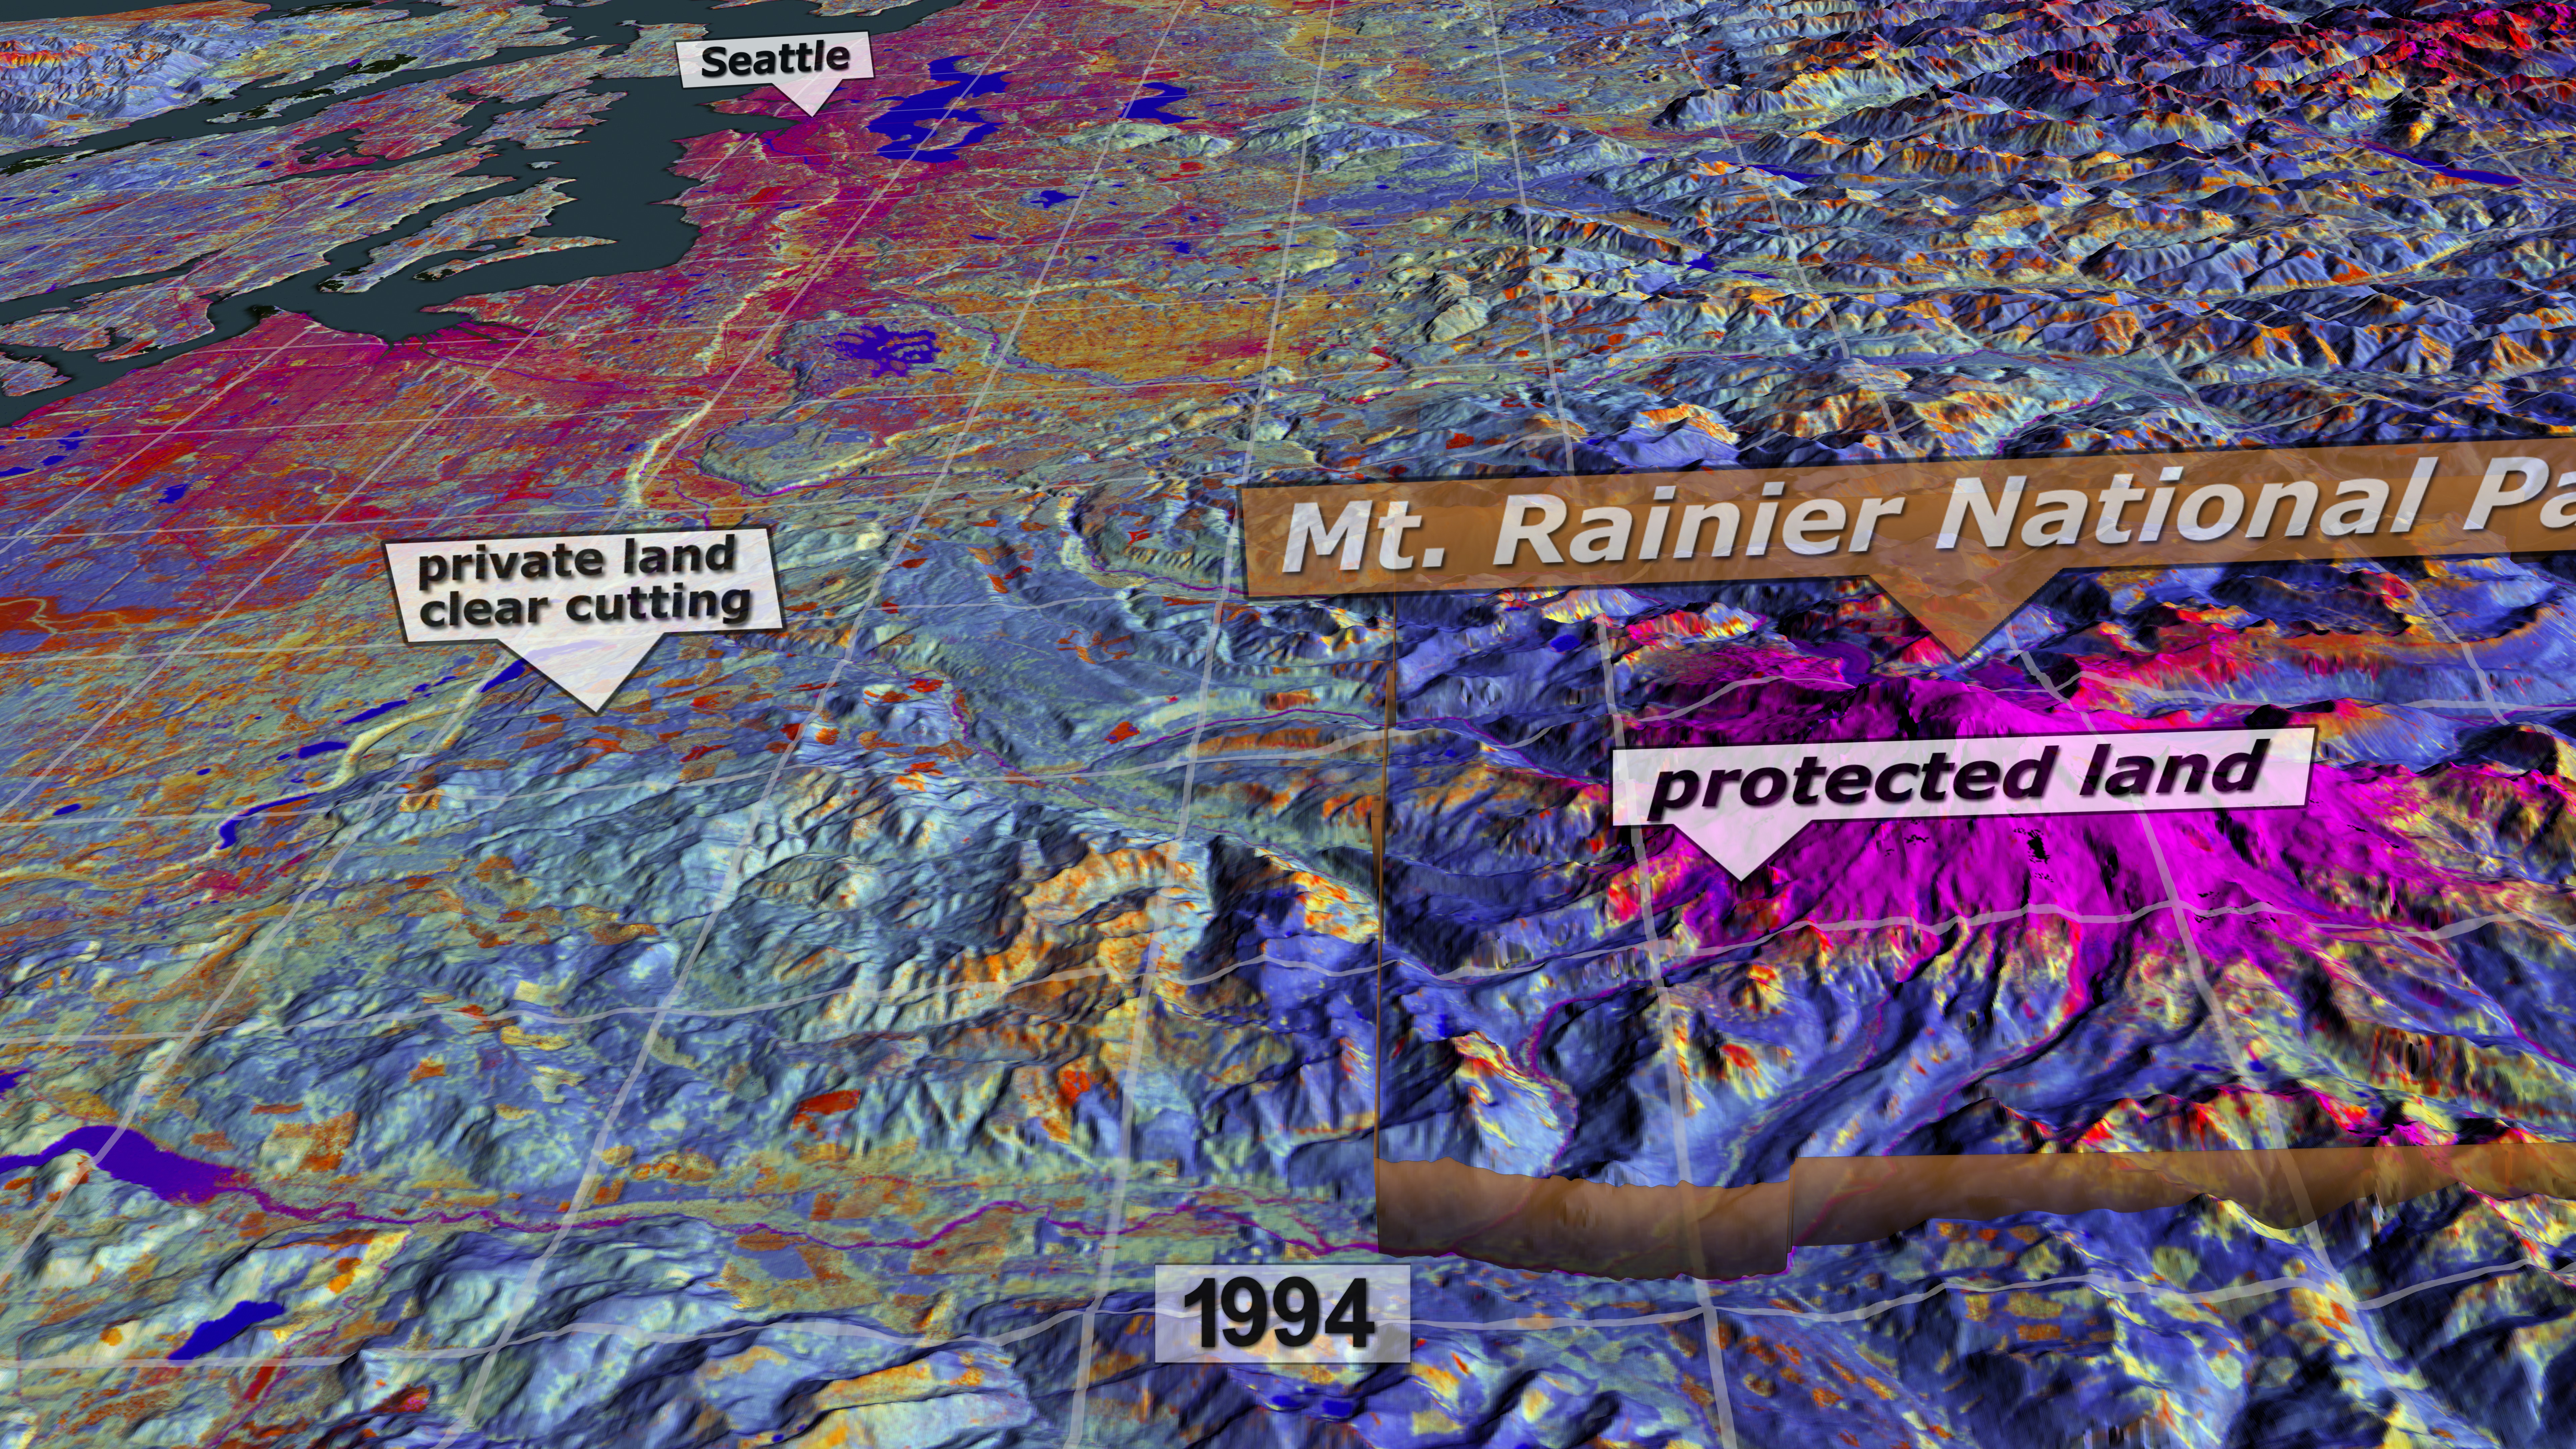
move to the east side of Mount Rainier National Park to see another budworm outbreak followed by shrub regrowth. Finally, we move to the west of Mount Rainier where we can see widespread clear cutting outside of the park, but no clear cutting inside the protected park land.
Don't miss this related tour of the region.
Related
Visualization Credits
Alex Kekesi (Global Science and Technology, Inc.): Animator
Horace Mitchell (NASA/GSFC): Animator
Matthew R. Radcliff (USRA): Producer
Robert Kennedy (Boston University): Scientist
Zhiqiang Yang (Oregon State University): Scientist
Justin Braaten (Oregon State University): Scientist
Ellen T. Gray (ADNET Systems, Inc.): Writer
NASA's Goddard Space Flight Center Scientific Visualization Studio and the Laboratory for Applications of Remote Sensing in Ecology at Oregon State University
https://svs.gsfc.nasa.gov/4013
Missions:
Landsat
Shuttle Radar Topography Mission - SRTM
Terra
Data Used:
Landsat
1984 through 2011SRTM/SIR-C/DEM
Terra and Aqua/MODIS/Blue Marble: Next Generation also referred to as: BMNG
The Blue Marble data is courtesy of Reto Stockli (NASA/GSFC).
also referred to as: LandTrendr
Analysis - Oregon State UniversityThis item is part of these series:
Geophysical Changes Over Time
Narrated Movies
Landsat
LDCM
Keywords:
SVS >> HDTV
SVS >> Land Classification
SVS >> Landsat
DLESE >> Physical geography
GCMD >> Earth Science >> Land Surface
GCMD >> Earth Science >> Land Surface >> Land Use/Land Cover
SVS >> Hyperwall
NASA Science >> Earth
GCMD keywords can be found on the Internet with the following citation: Olsen, L.M., G. Major, K. Shein, J. Scialdone, S. Ritz, T. Stevens, M. Morahan, A. Aleman, R. Vogel, S. Leicester, H. Weir, M. Meaux, S. Grebas, C.Solomon, M. Holland, T. Northcutt, R. A. Restrepo, R. Bilodeau, 2013. NASA/Global Change Master Directory (GCMD) Earth Science Keywords. Version 8.0.0.0.0


