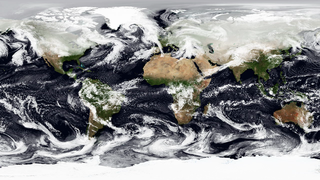
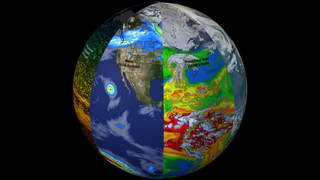
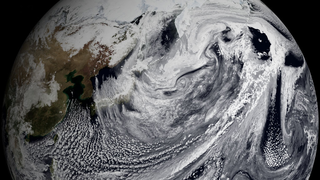
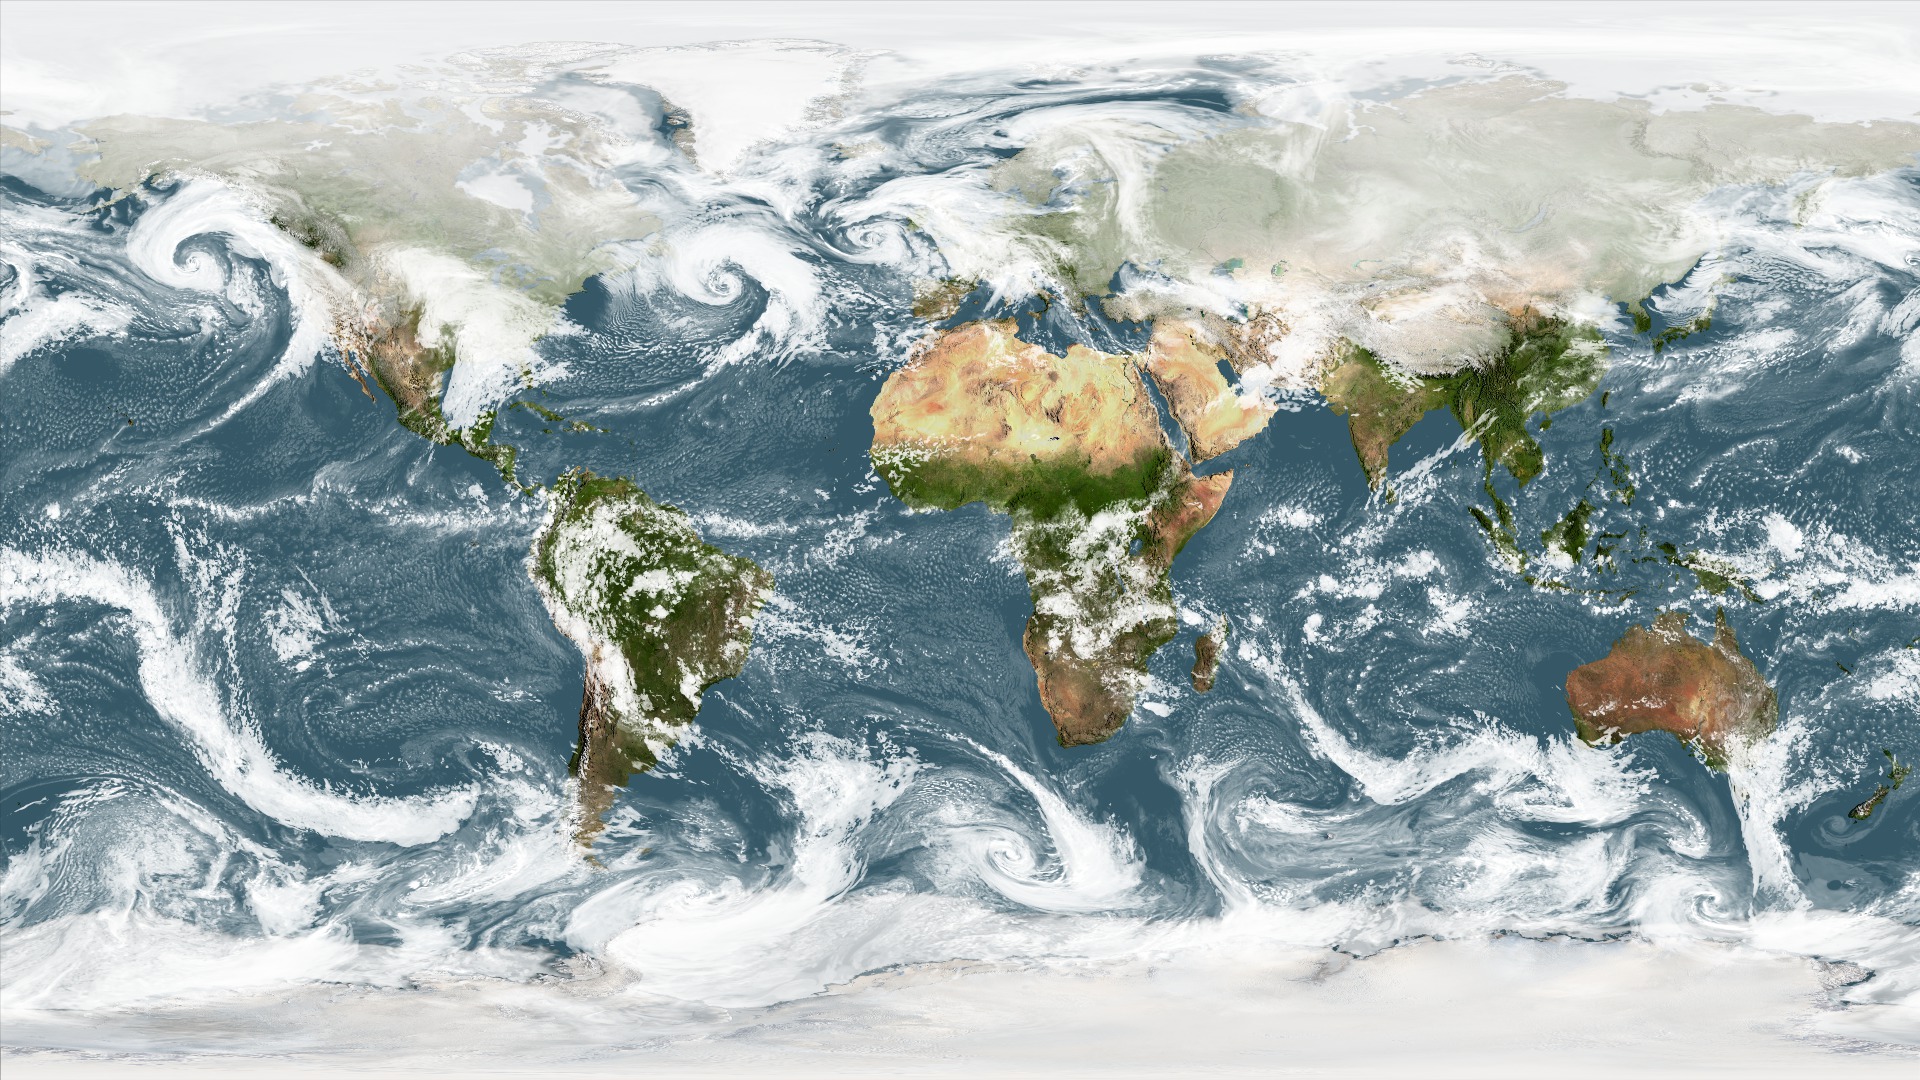
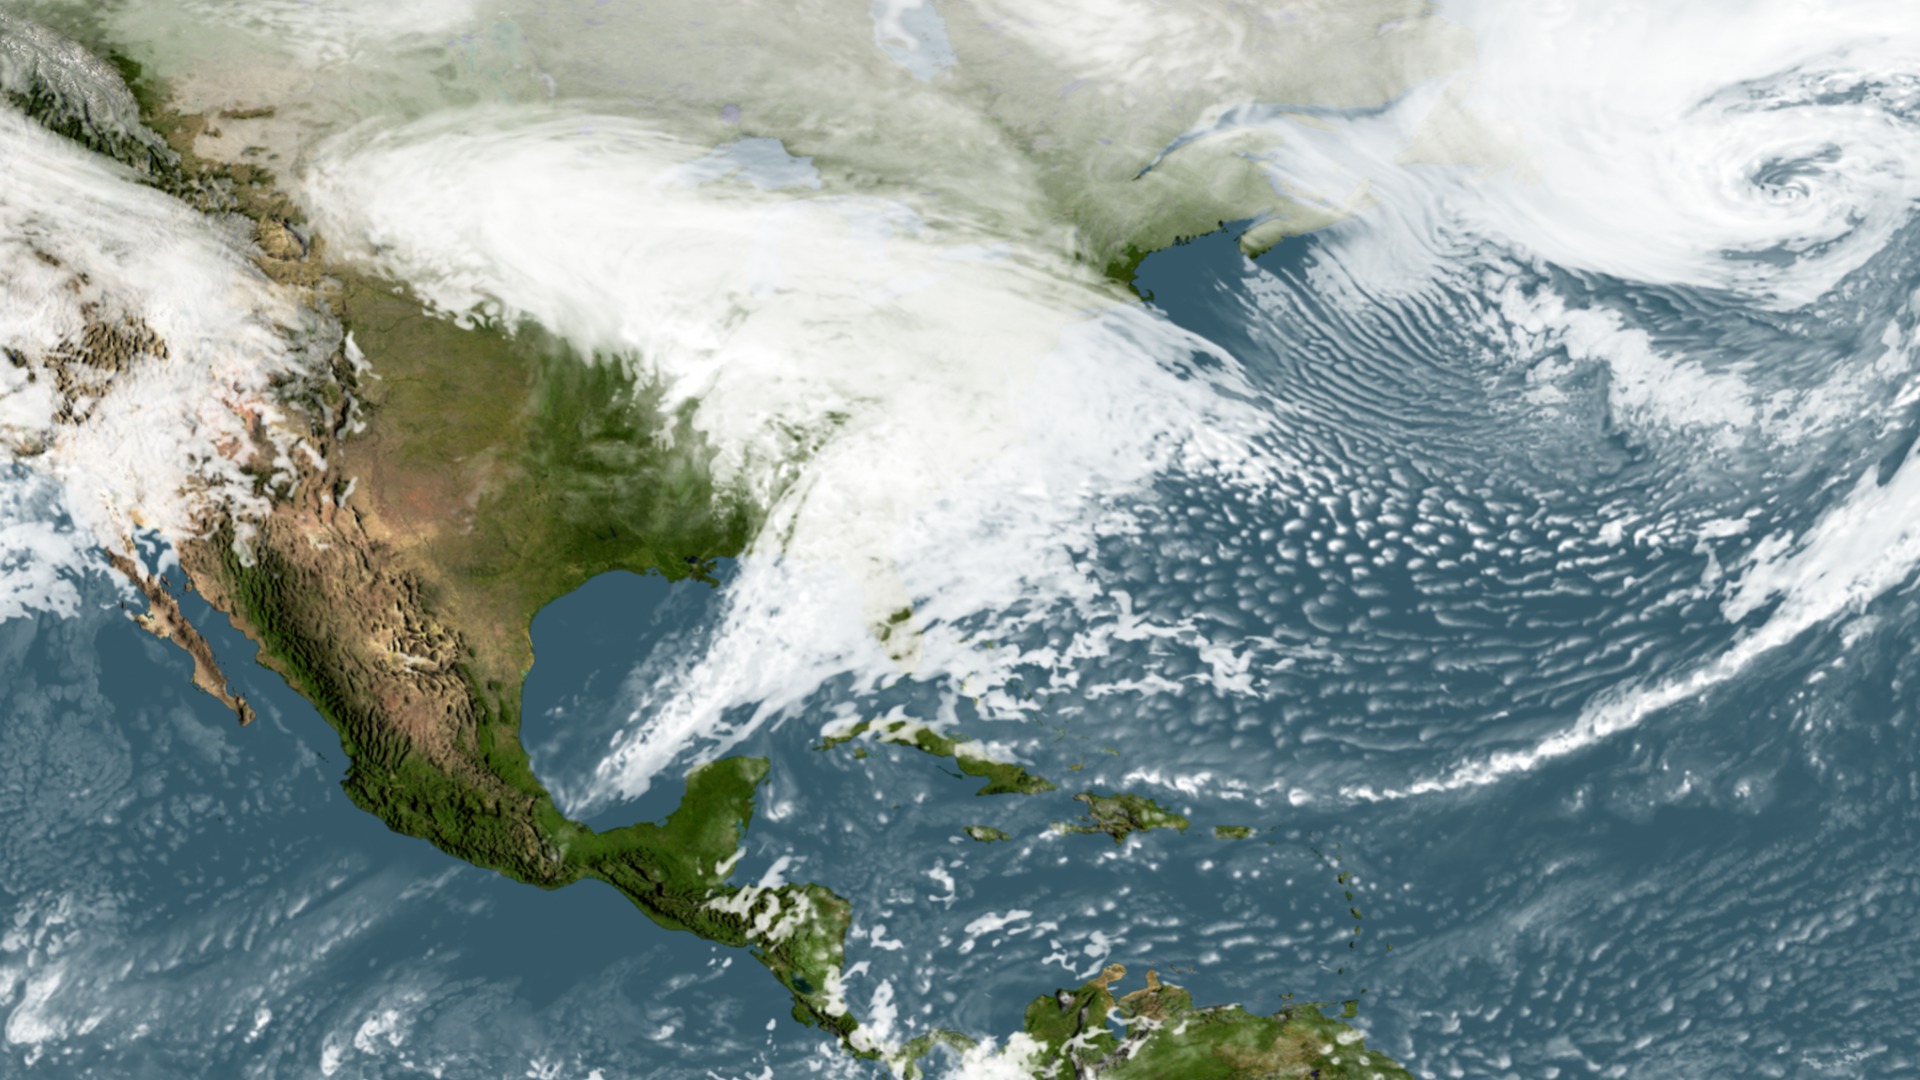
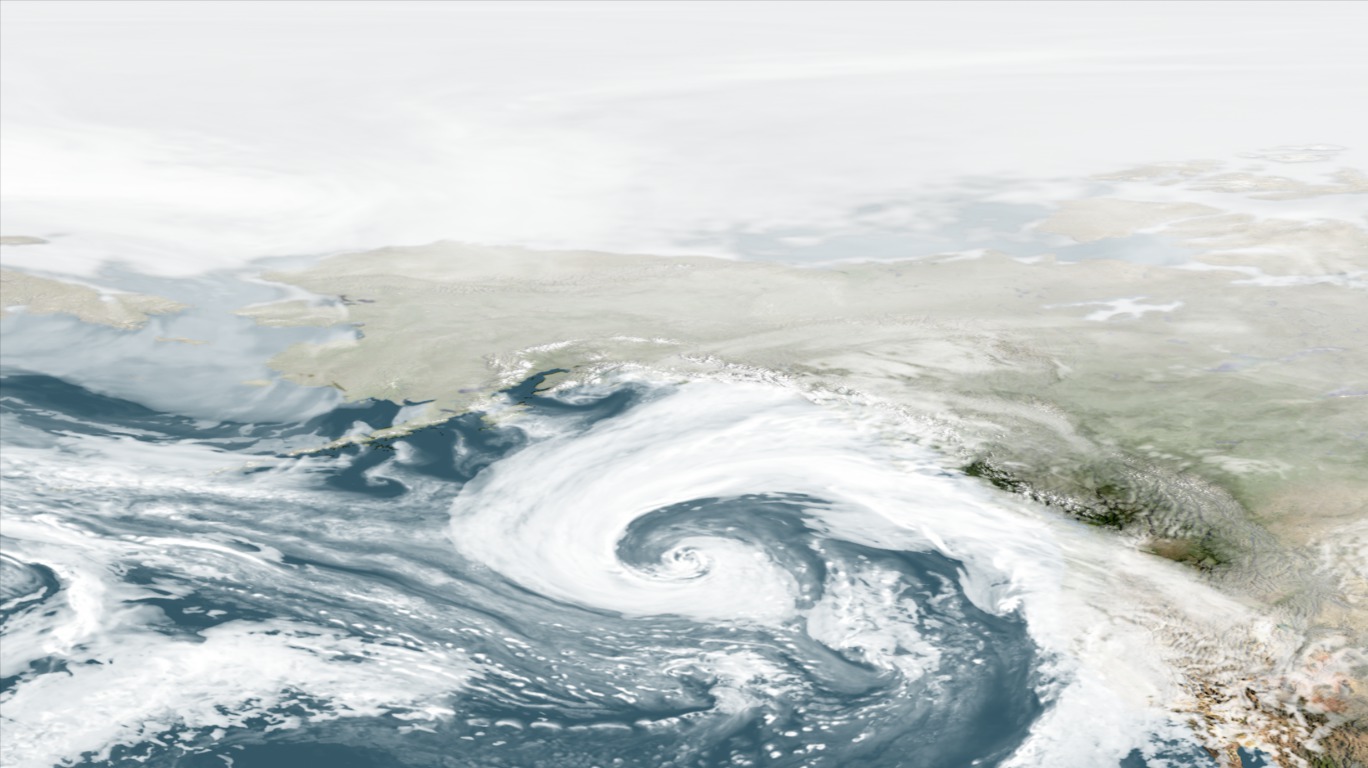
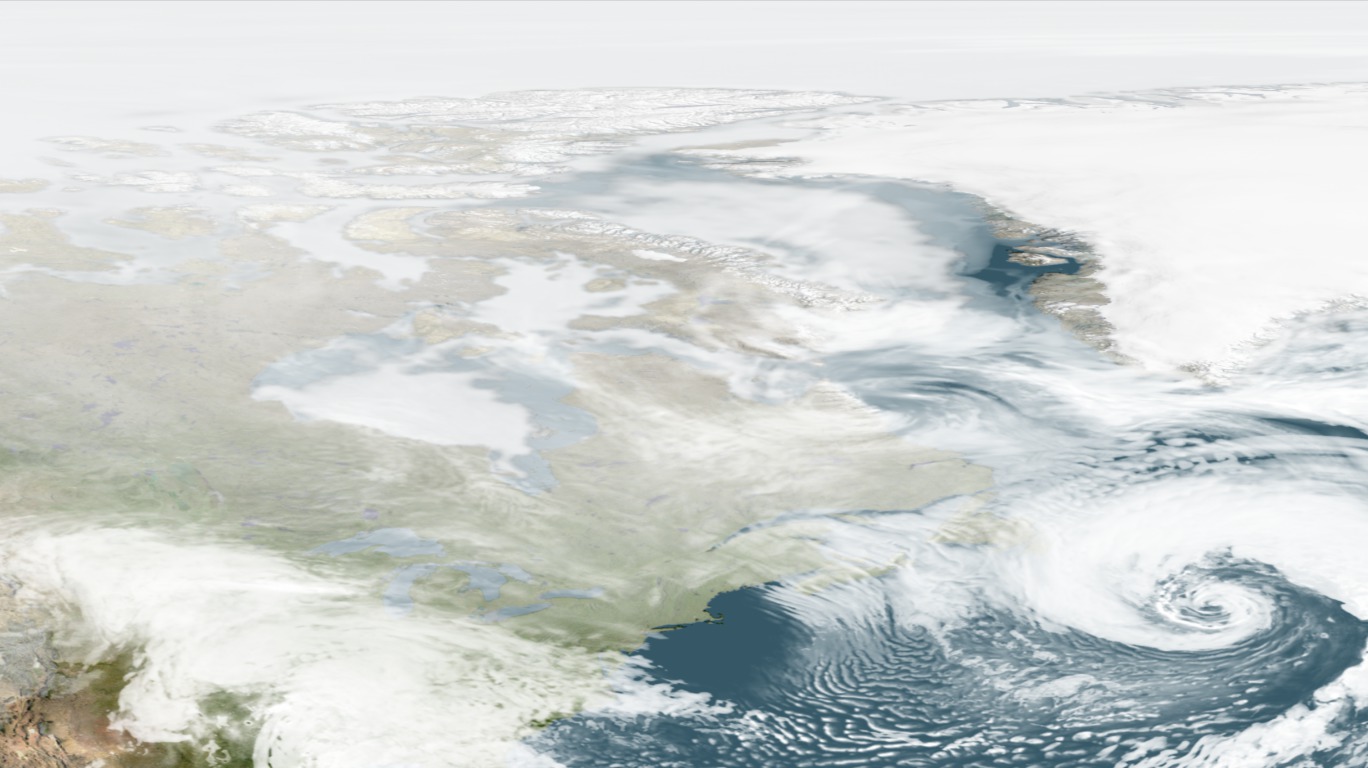
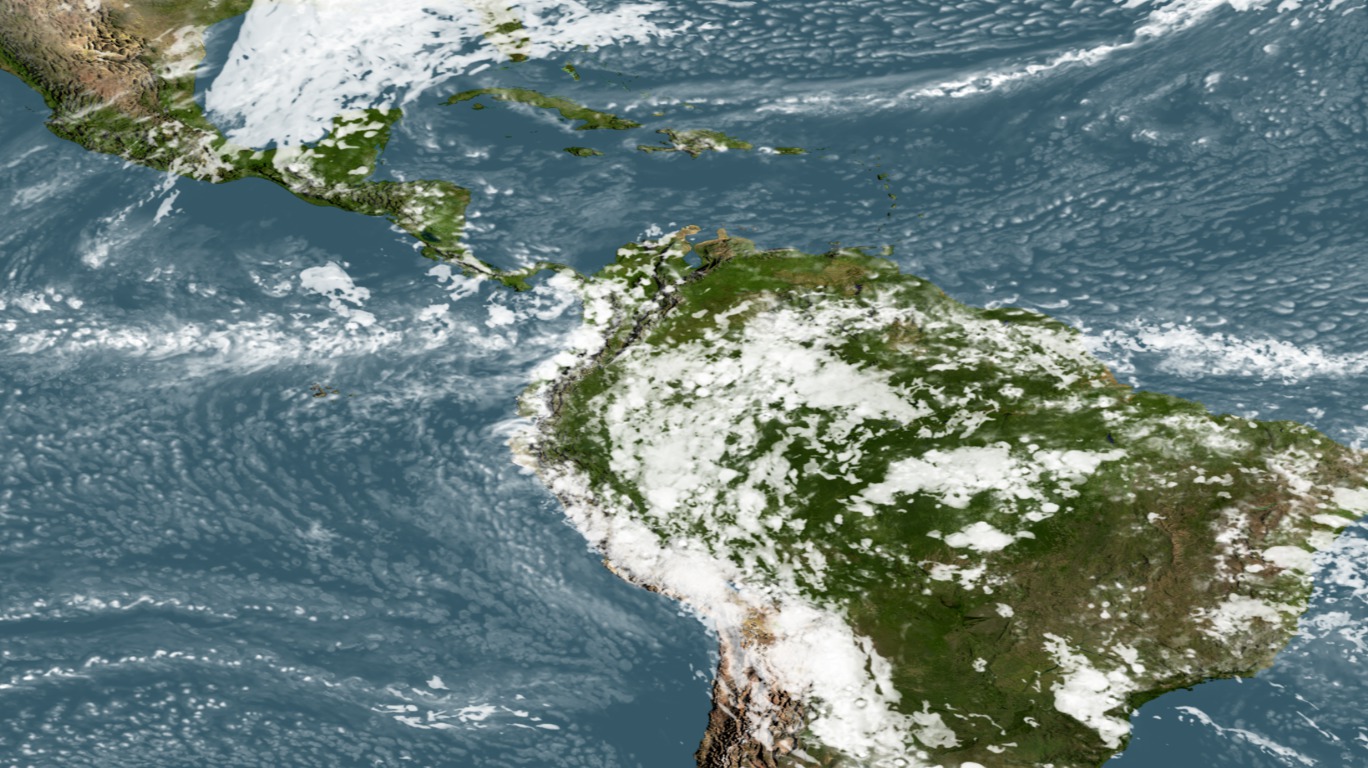
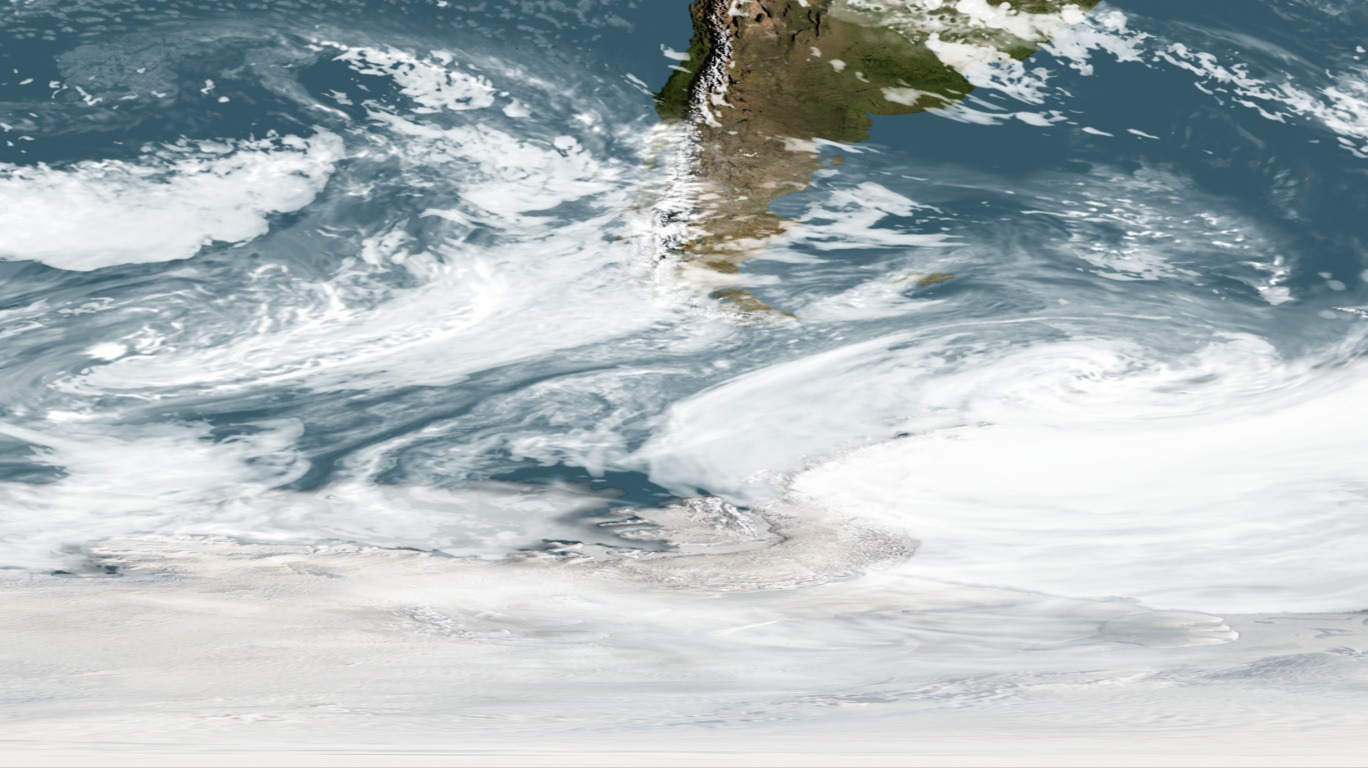
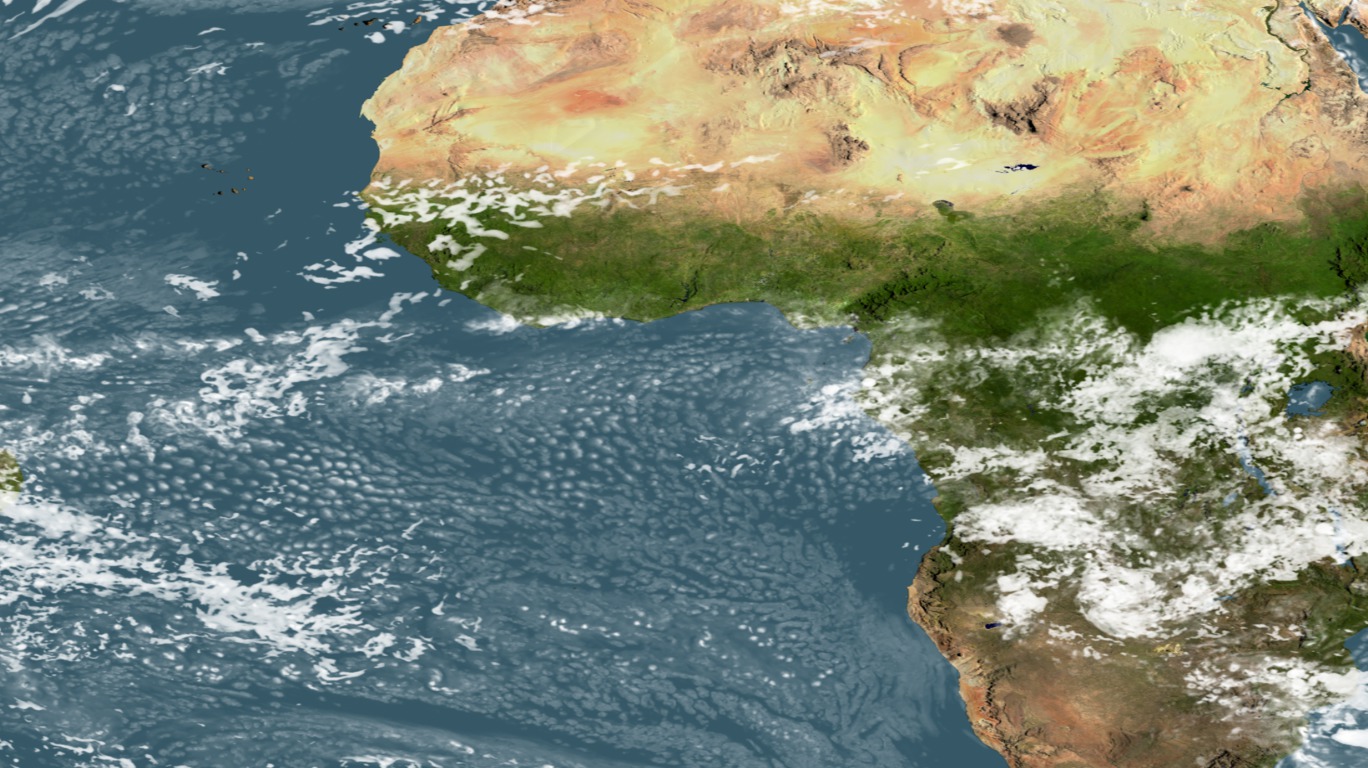
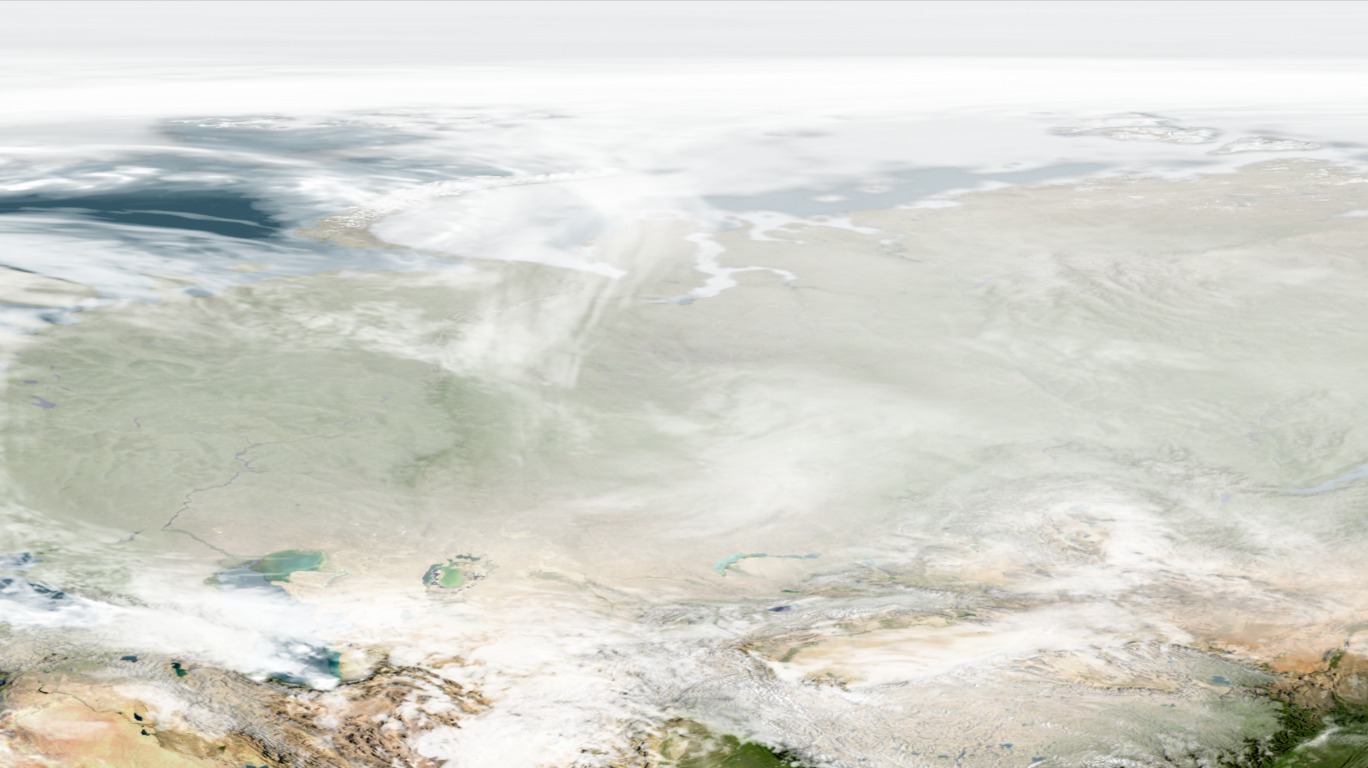
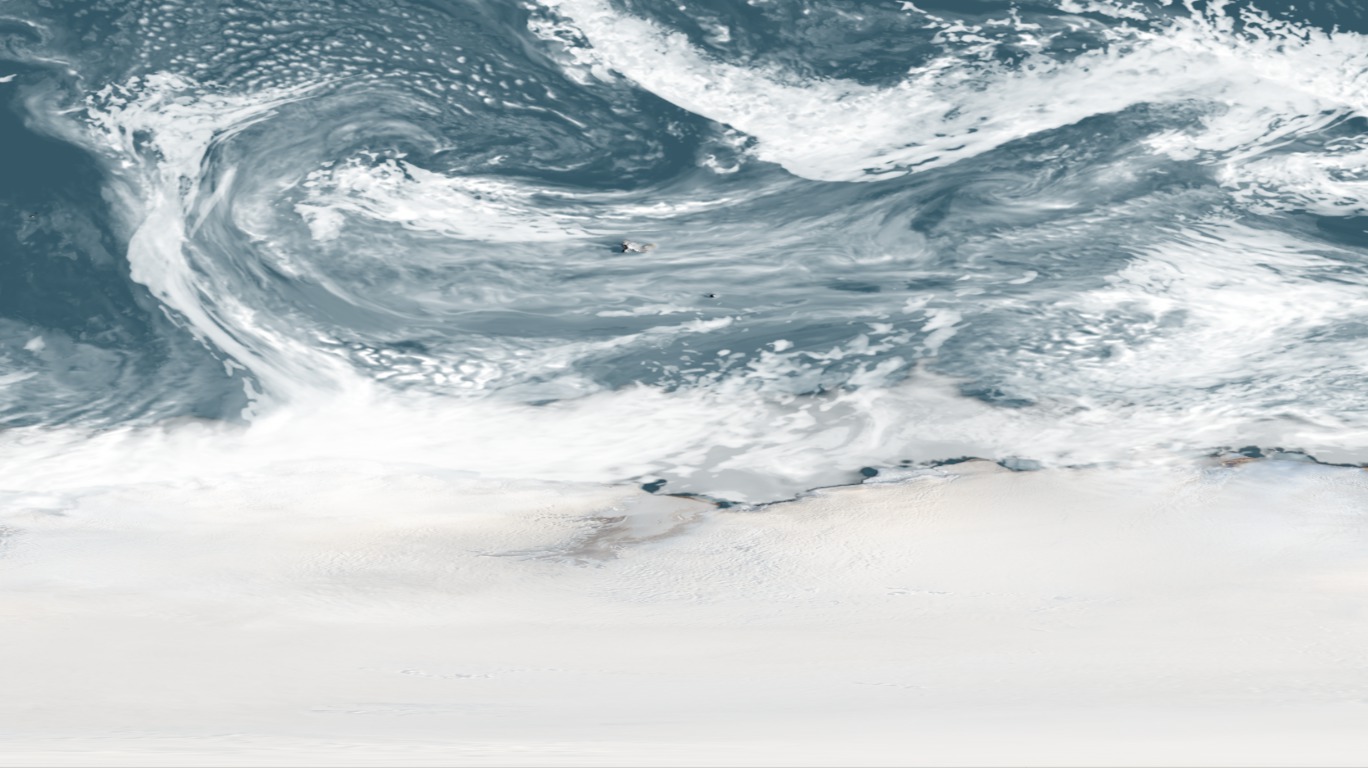
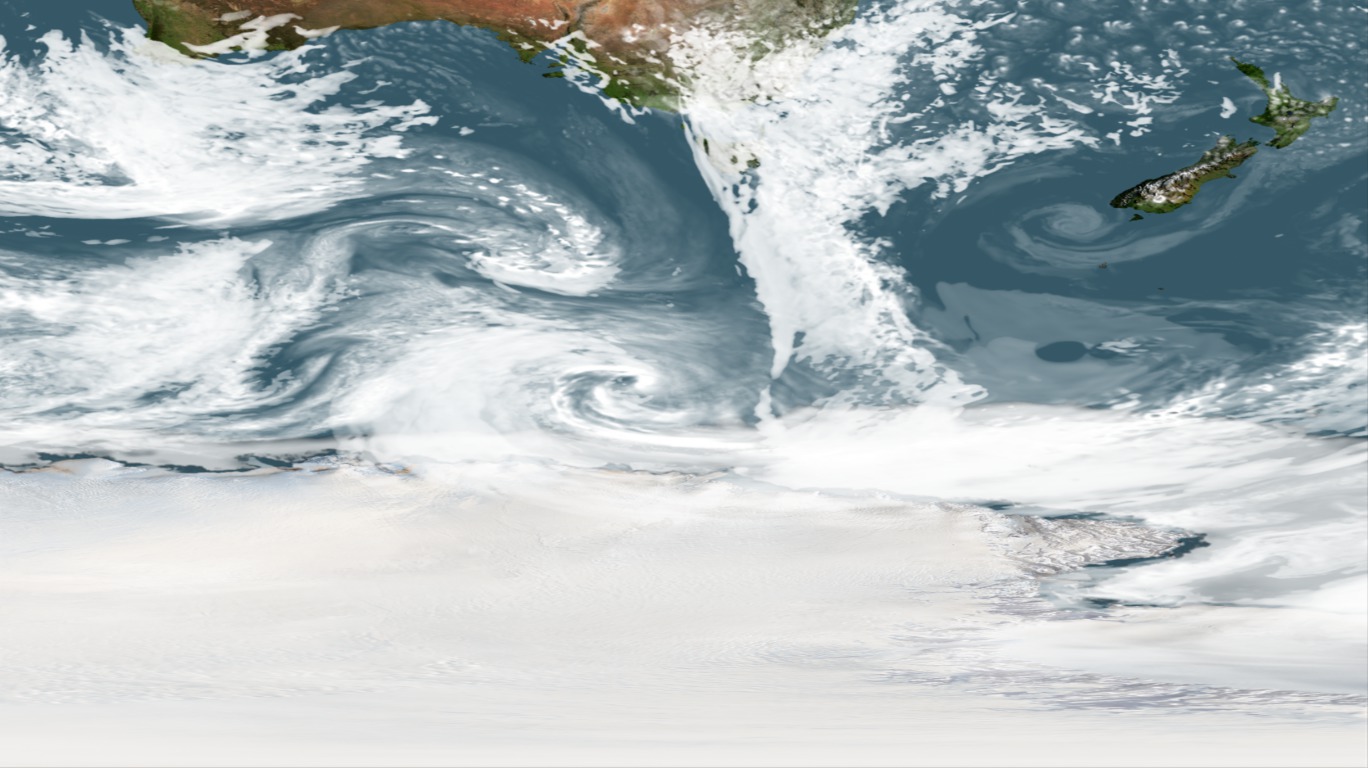
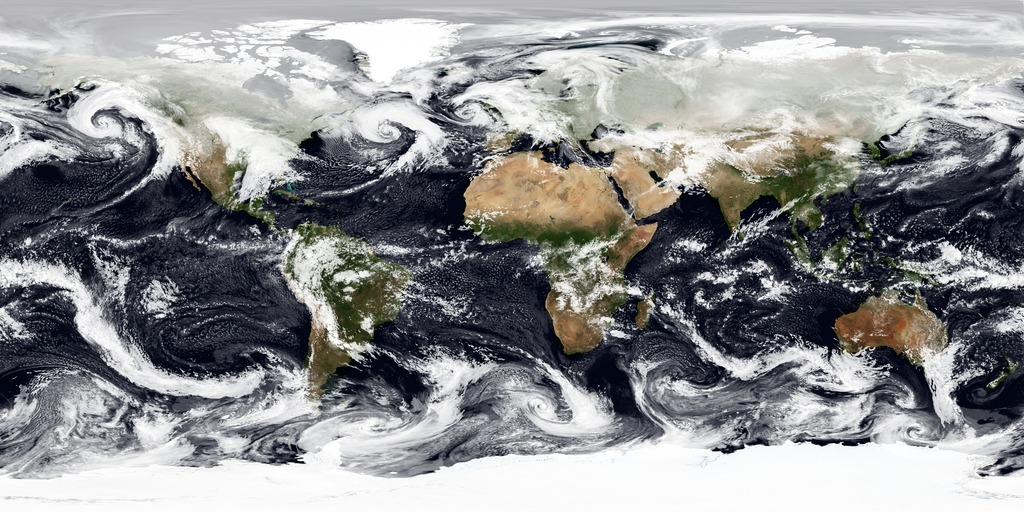
NCCS Hyperwall Show: GEOS-5 Modeled Clouds at 5-km Resolution (Flat Map)
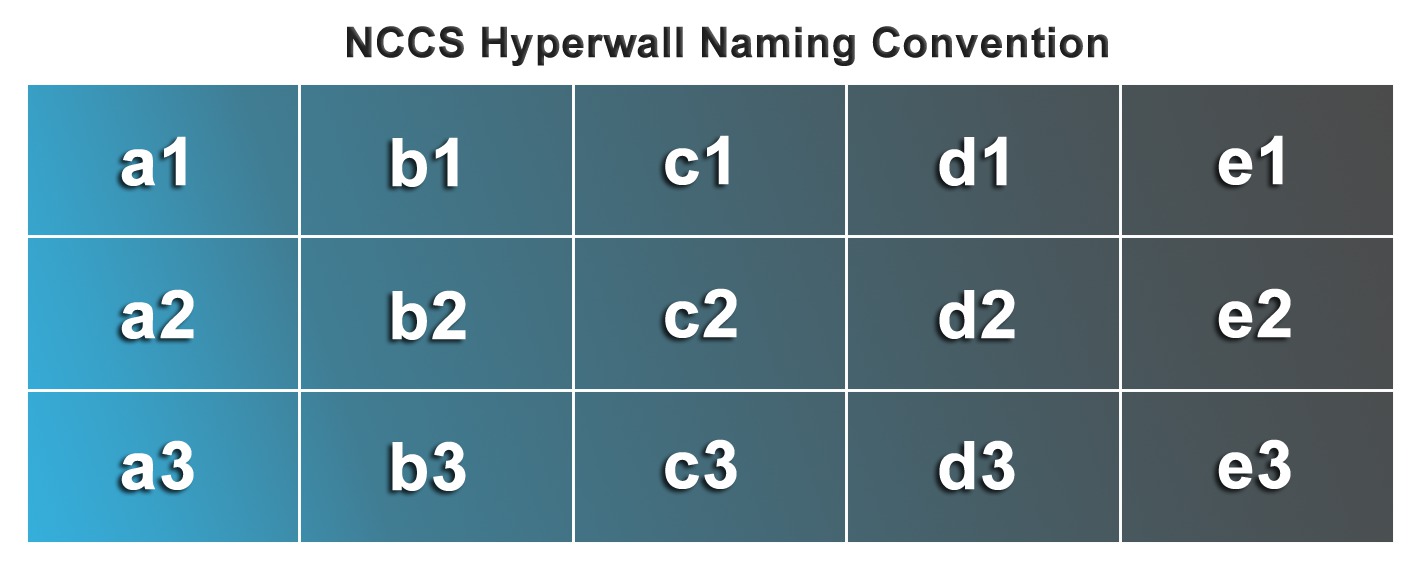
This visualization was created for display on the NASA Center for Climate Simulation (NCCS) hyperwall. This is a set of tiled high definition displays consisting of 5 displays across by 3 displays down. The full resolution of all combined displays is 6840 pixels accross by 2304 pixels down. This movie was rendered at this high resolution, then diced up into images to be displayed on each screen.
A similar, lower resolution visualization is available in entry #3724. The lower resolution version is for comparison to current operational model resolution output. When displaying these visualizations on the hyperwall, we sometimes show them in a checkerboard pattern with alternating 5-km and quarter-degree tiles for easy comparison. We chose to stretch the image to fit the hyperwall aspect rather than cropping or adding black bars.
Used Elsewhere In
Source Material
Related
Visualization Credits
Michelle Williams (UMBC): Producer
William Putman (NASA/GSFC): Scientist
Max J. Suarez (NASA/GSFC): Scientist
Eric Sokolowsky (GST): Project Support
NASA/Goddard Space Flight Center Scientific Visualization Studio
https://svs.gsfc.nasa.gov/3723
Mission:
Terra
Data Used:
Terra and Aqua/MODIS/Blue Marble: Next Generation also referred to as: BMNG
The Blue Marble data is courtesy of Reto Stockli (NASA/GSFC).
GEOS-5 Atmospheric Model on the Cubed-Sphere also referred to as: GEOS-5 Cubed-Sphere
Model - NASA GMAO - 2/2/2010 through 2/22/2010This item is part of this series:
NCCS Dedication 2010
Keywords:
DLESE >> Atmospheric science
SVS >> HDTV
SVS >> Simulation
GCMD >> Earth Science >> Atmosphere >> Clouds
SVS >> Model Data
SVS >> Global Climate Models
SVS >> Hyperwall
SVS >> iPod
SVS >> For Educators
SVS >> Water Cycle >> Condensation
SVS >> Atmosphere >> Humidity
SVS >> Climate >> Precipitation
NASA Science >> Earth
SVS >> Presentation
GCMD keywords can be found on the Internet with the following citation: Olsen, L.M., G. Major, K. Shein, J. Scialdone, S. Ritz, T. Stevens, M. Morahan, A. Aleman, R. Vogel, S. Leicester, H. Weir, M. Meaux, S. Grebas, C.Solomon, M. Holland, T. Northcutt, R. A. Restrepo, R. Bilodeau, 2013. NASA/Global Change Master Directory (GCMD) Earth Science Keywords. Version 8.0.0.0.0


