Earth
ID: 3655
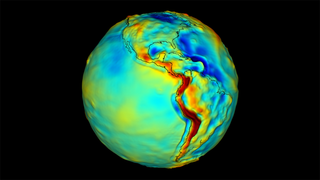
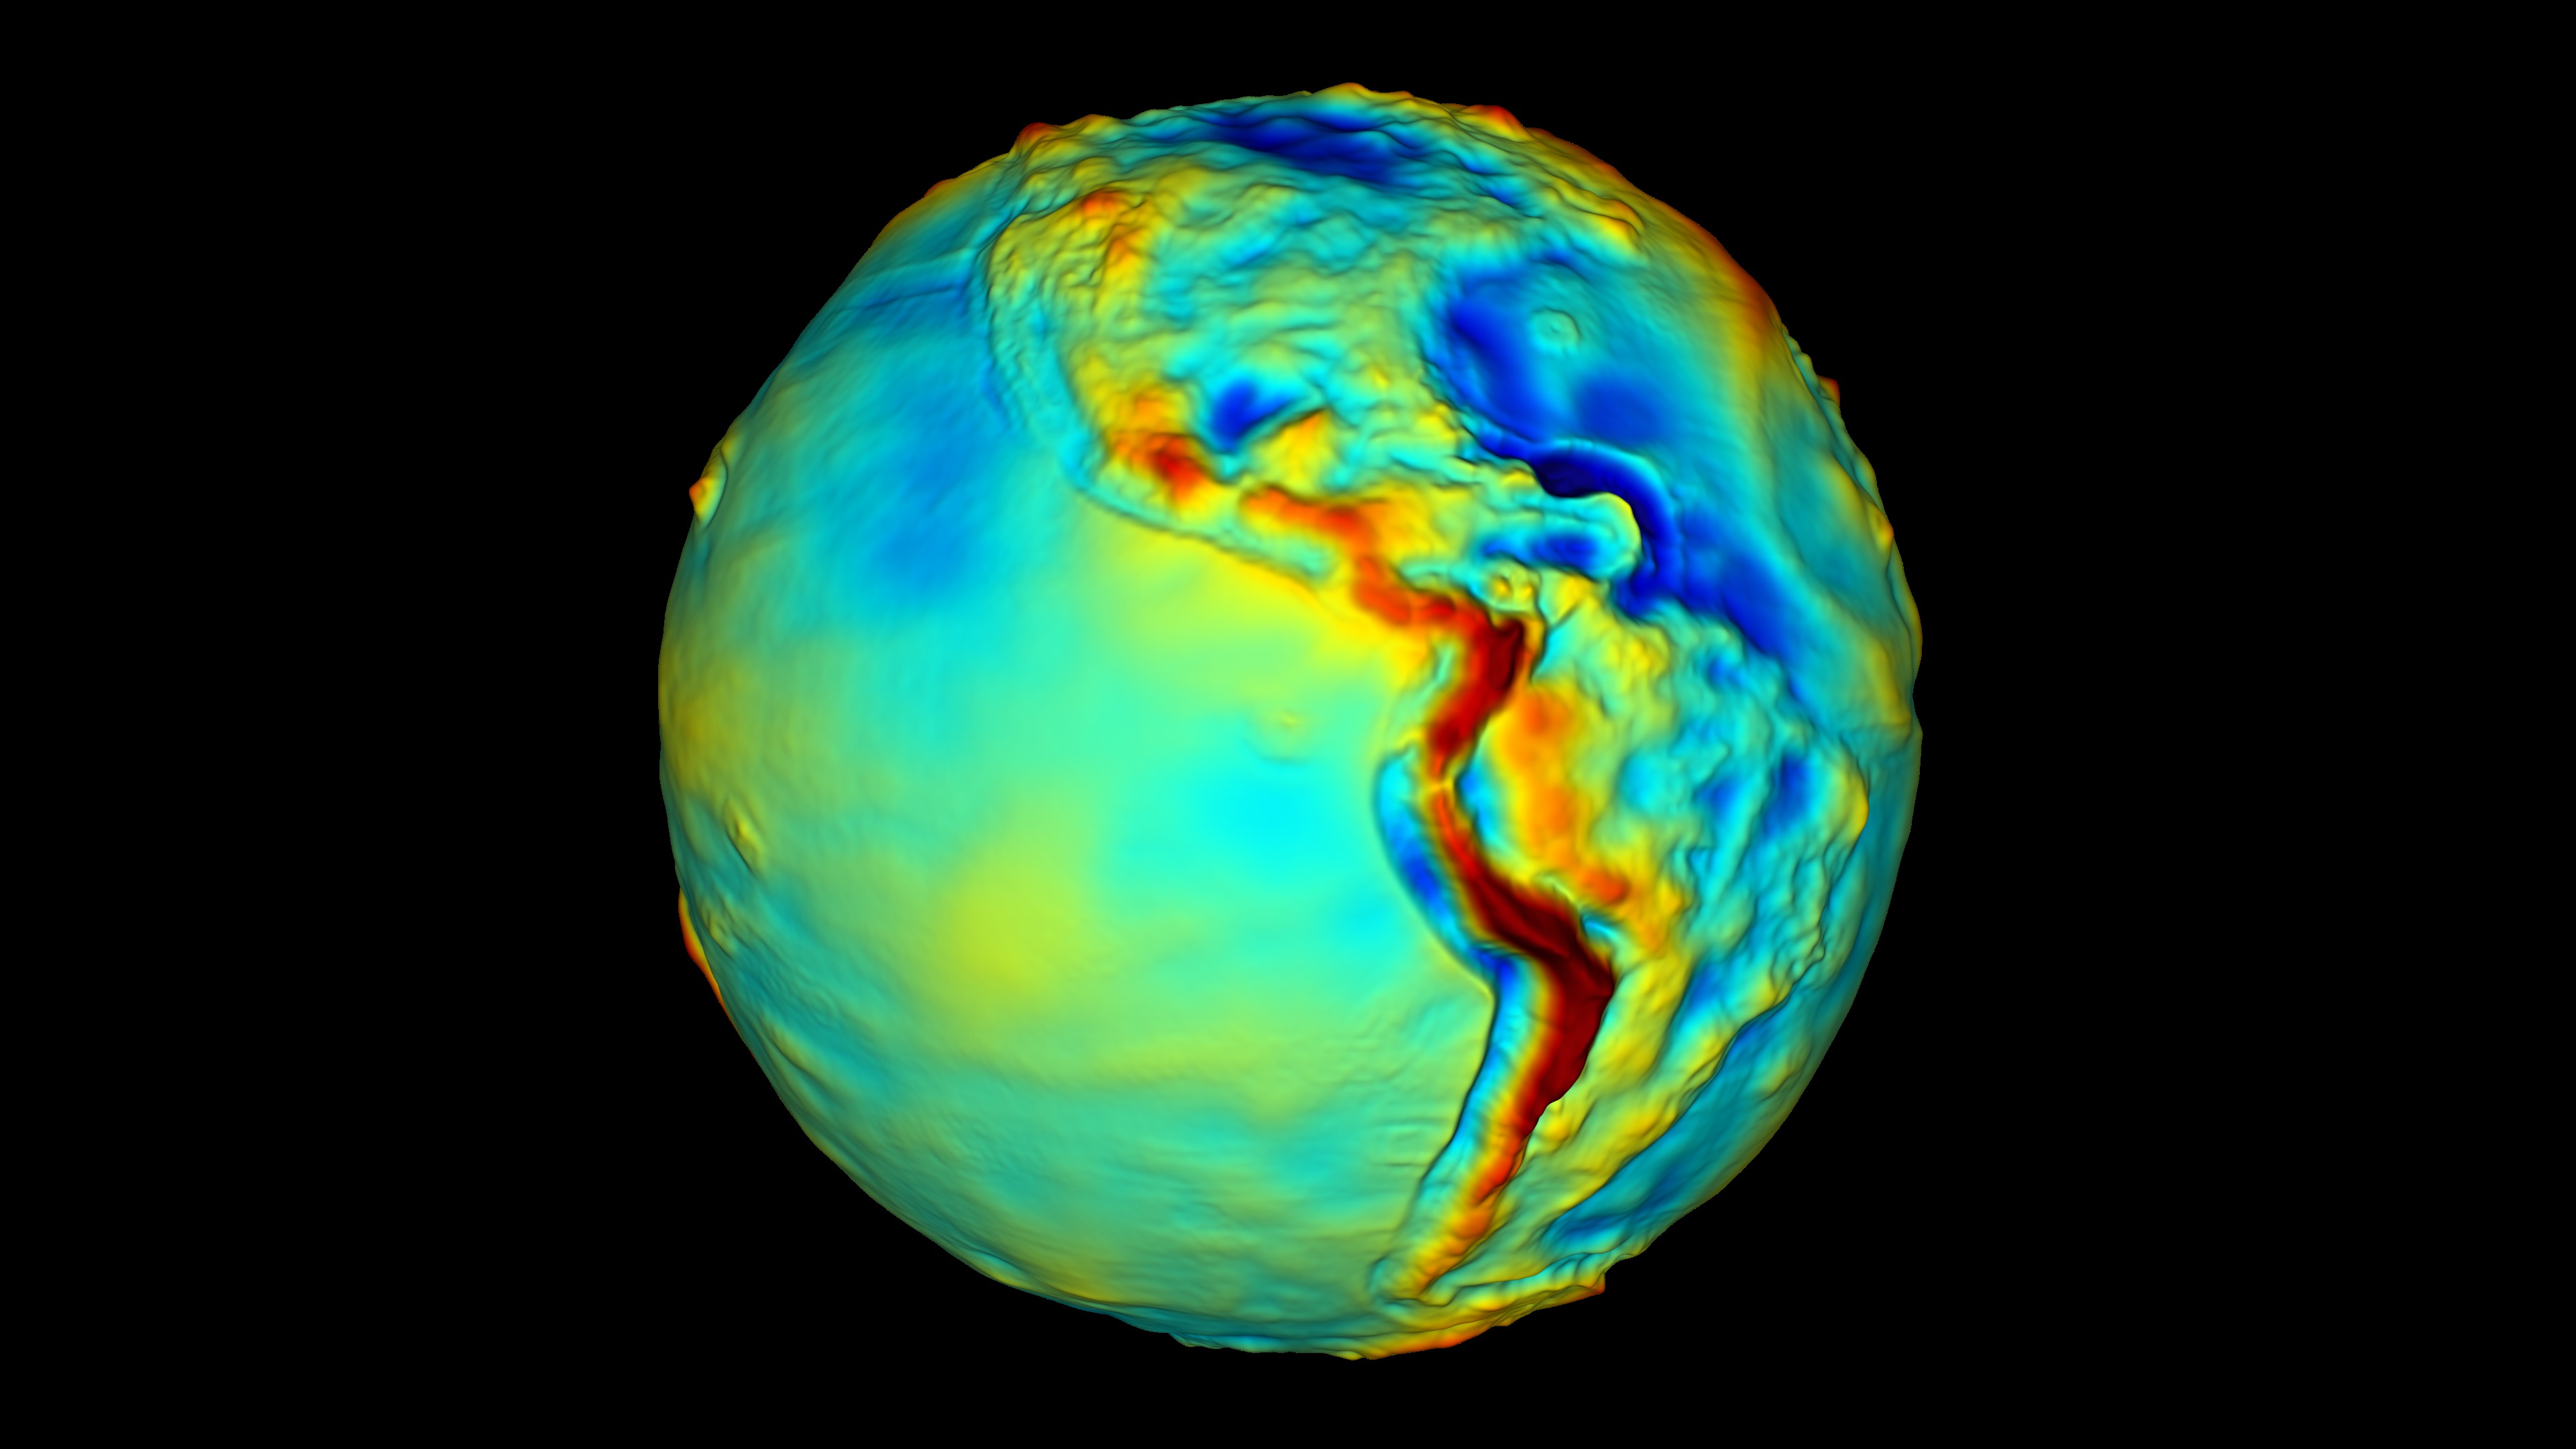
The following animation displays the Earth's gravitational anomalies. The colors and heights represent the strength of gravity at the locality. Areas with less mass, such as ocean basins, show up as blue, that is less gravity, while mountains such as the Andes are red, representing the greater pull of gravity. The visualization utilizes a version of the GRACE Gravity Model 02 that has been smoothed for greater readability.
GRACE Gravity Model
Related
Visualization Credits
Adam Martin (UMBC): Lead Animator
Paul Reddish (Free Spirit Films): Producer
John C. Ries (University of Texas): Scientist
Scott Luthcke (NASA/GSFC): Scientist
Paul Reddish (Free Spirit Films): Producer
John C. Ries (University of Texas): Scientist
Scott Luthcke (NASA/GSFC): Scientist
Please give credit for this item to:
NASA/Goddard Space Flight Center Scientific Visualization Studio
NASA/Goddard Space Flight Center Scientific Visualization Studio
Short URL to share this page:
https://svs.gsfc.nasa.gov/3655
Mission:
Gravity Recovery and Climate Experiment (GRACE)
Data Used:
Note: While we identify the data sets used in these visualizations, we do not store any further details nor the data sets themselves on our site.
Keywords:
SVS >> HDTV
GCMD >> Earth Science >> Solid Earth >> Geodetics/Gravity >> Geoid Properties
GCMD >> Earth Science >> Solid Earth >> Geodetics/Gravity >> Gravitational Field
GCMD >> Earth Science >> Solid Earth >> Geodetics/Gravity >> Gravity
SVS >> Hyperwall
SVS >> GRACE
NASA Science >> Earth
GCMD keywords can be found on the Internet with the following citation: Olsen, L.M., G. Major, K. Shein, J. Scialdone, S. Ritz, T. Stevens, M. Morahan, A. Aleman, R. Vogel, S. Leicester, H. Weir, M. Meaux, S. Grebas, C.Solomon, M. Holland, T. Northcutt, R. A. Restrepo, R. Bilodeau, 2013. NASA/Global Change Master Directory (GCMD) Earth Science Keywords. Version 8.0.0.0.0
https://svs.gsfc.nasa.gov/3655
Mission:
Gravity Recovery and Climate Experiment (GRACE)
Data Used:
Gravity Recovery and Climate Experiment (GRACE)/KBR Horn/K-band Intersatellite Range Rate
JPL, the University of Texas and GeoForschungsZentrum PotsdamKeywords:
SVS >> HDTV
GCMD >> Earth Science >> Solid Earth >> Geodetics/Gravity >> Geoid Properties
GCMD >> Earth Science >> Solid Earth >> Geodetics/Gravity >> Gravitational Field
GCMD >> Earth Science >> Solid Earth >> Geodetics/Gravity >> Gravity
SVS >> Hyperwall
SVS >> GRACE
NASA Science >> Earth
GCMD keywords can be found on the Internet with the following citation: Olsen, L.M., G. Major, K. Shein, J. Scialdone, S. Ritz, T. Stevens, M. Morahan, A. Aleman, R. Vogel, S. Leicester, H. Weir, M. Meaux, S. Grebas, C.Solomon, M. Holland, T. Northcutt, R. A. Restrepo, R. Bilodeau, 2013. NASA/Global Change Master Directory (GCMD) Earth Science Keywords. Version 8.0.0.0.0


