Earth
ID: 3563
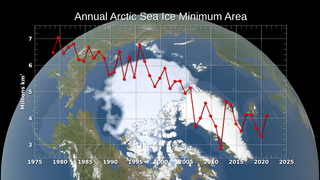
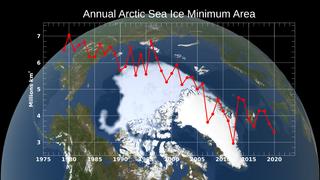
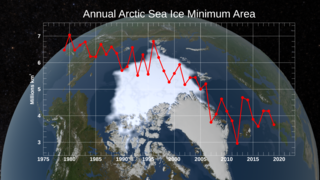
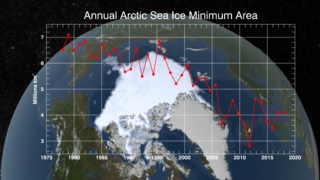
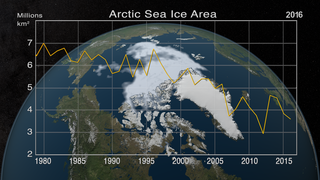
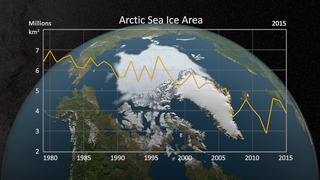
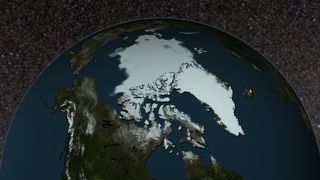
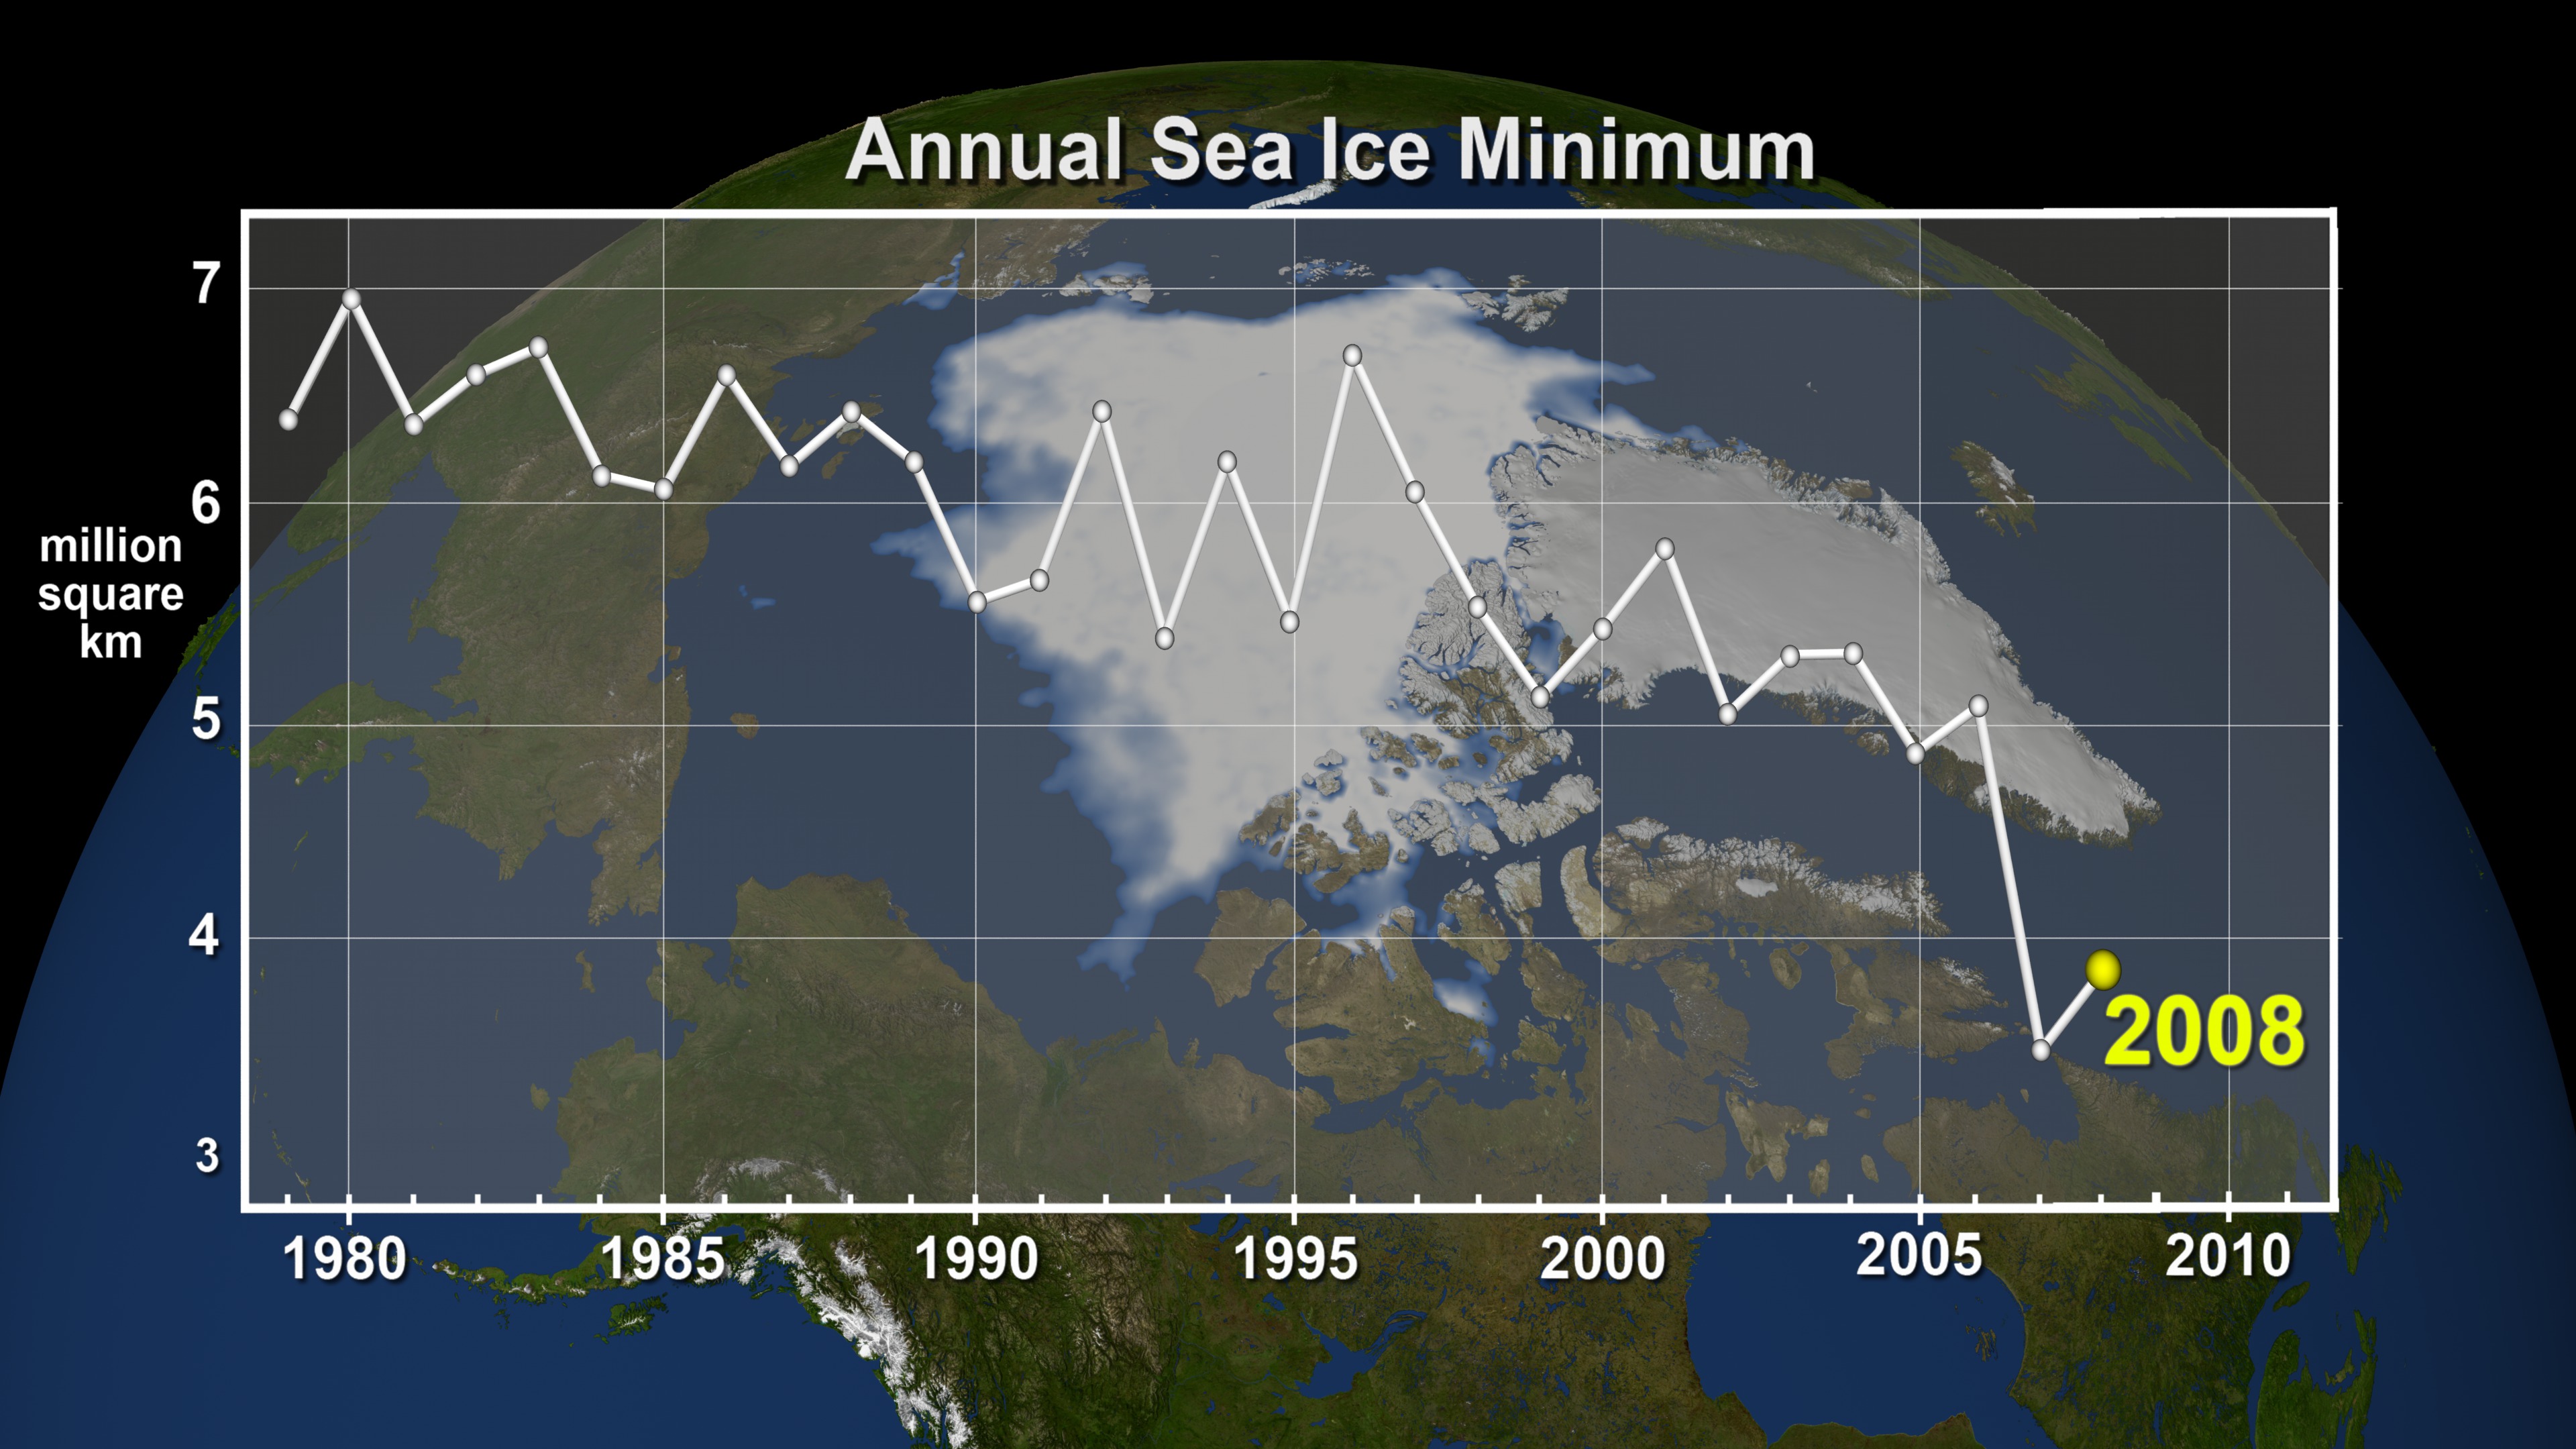
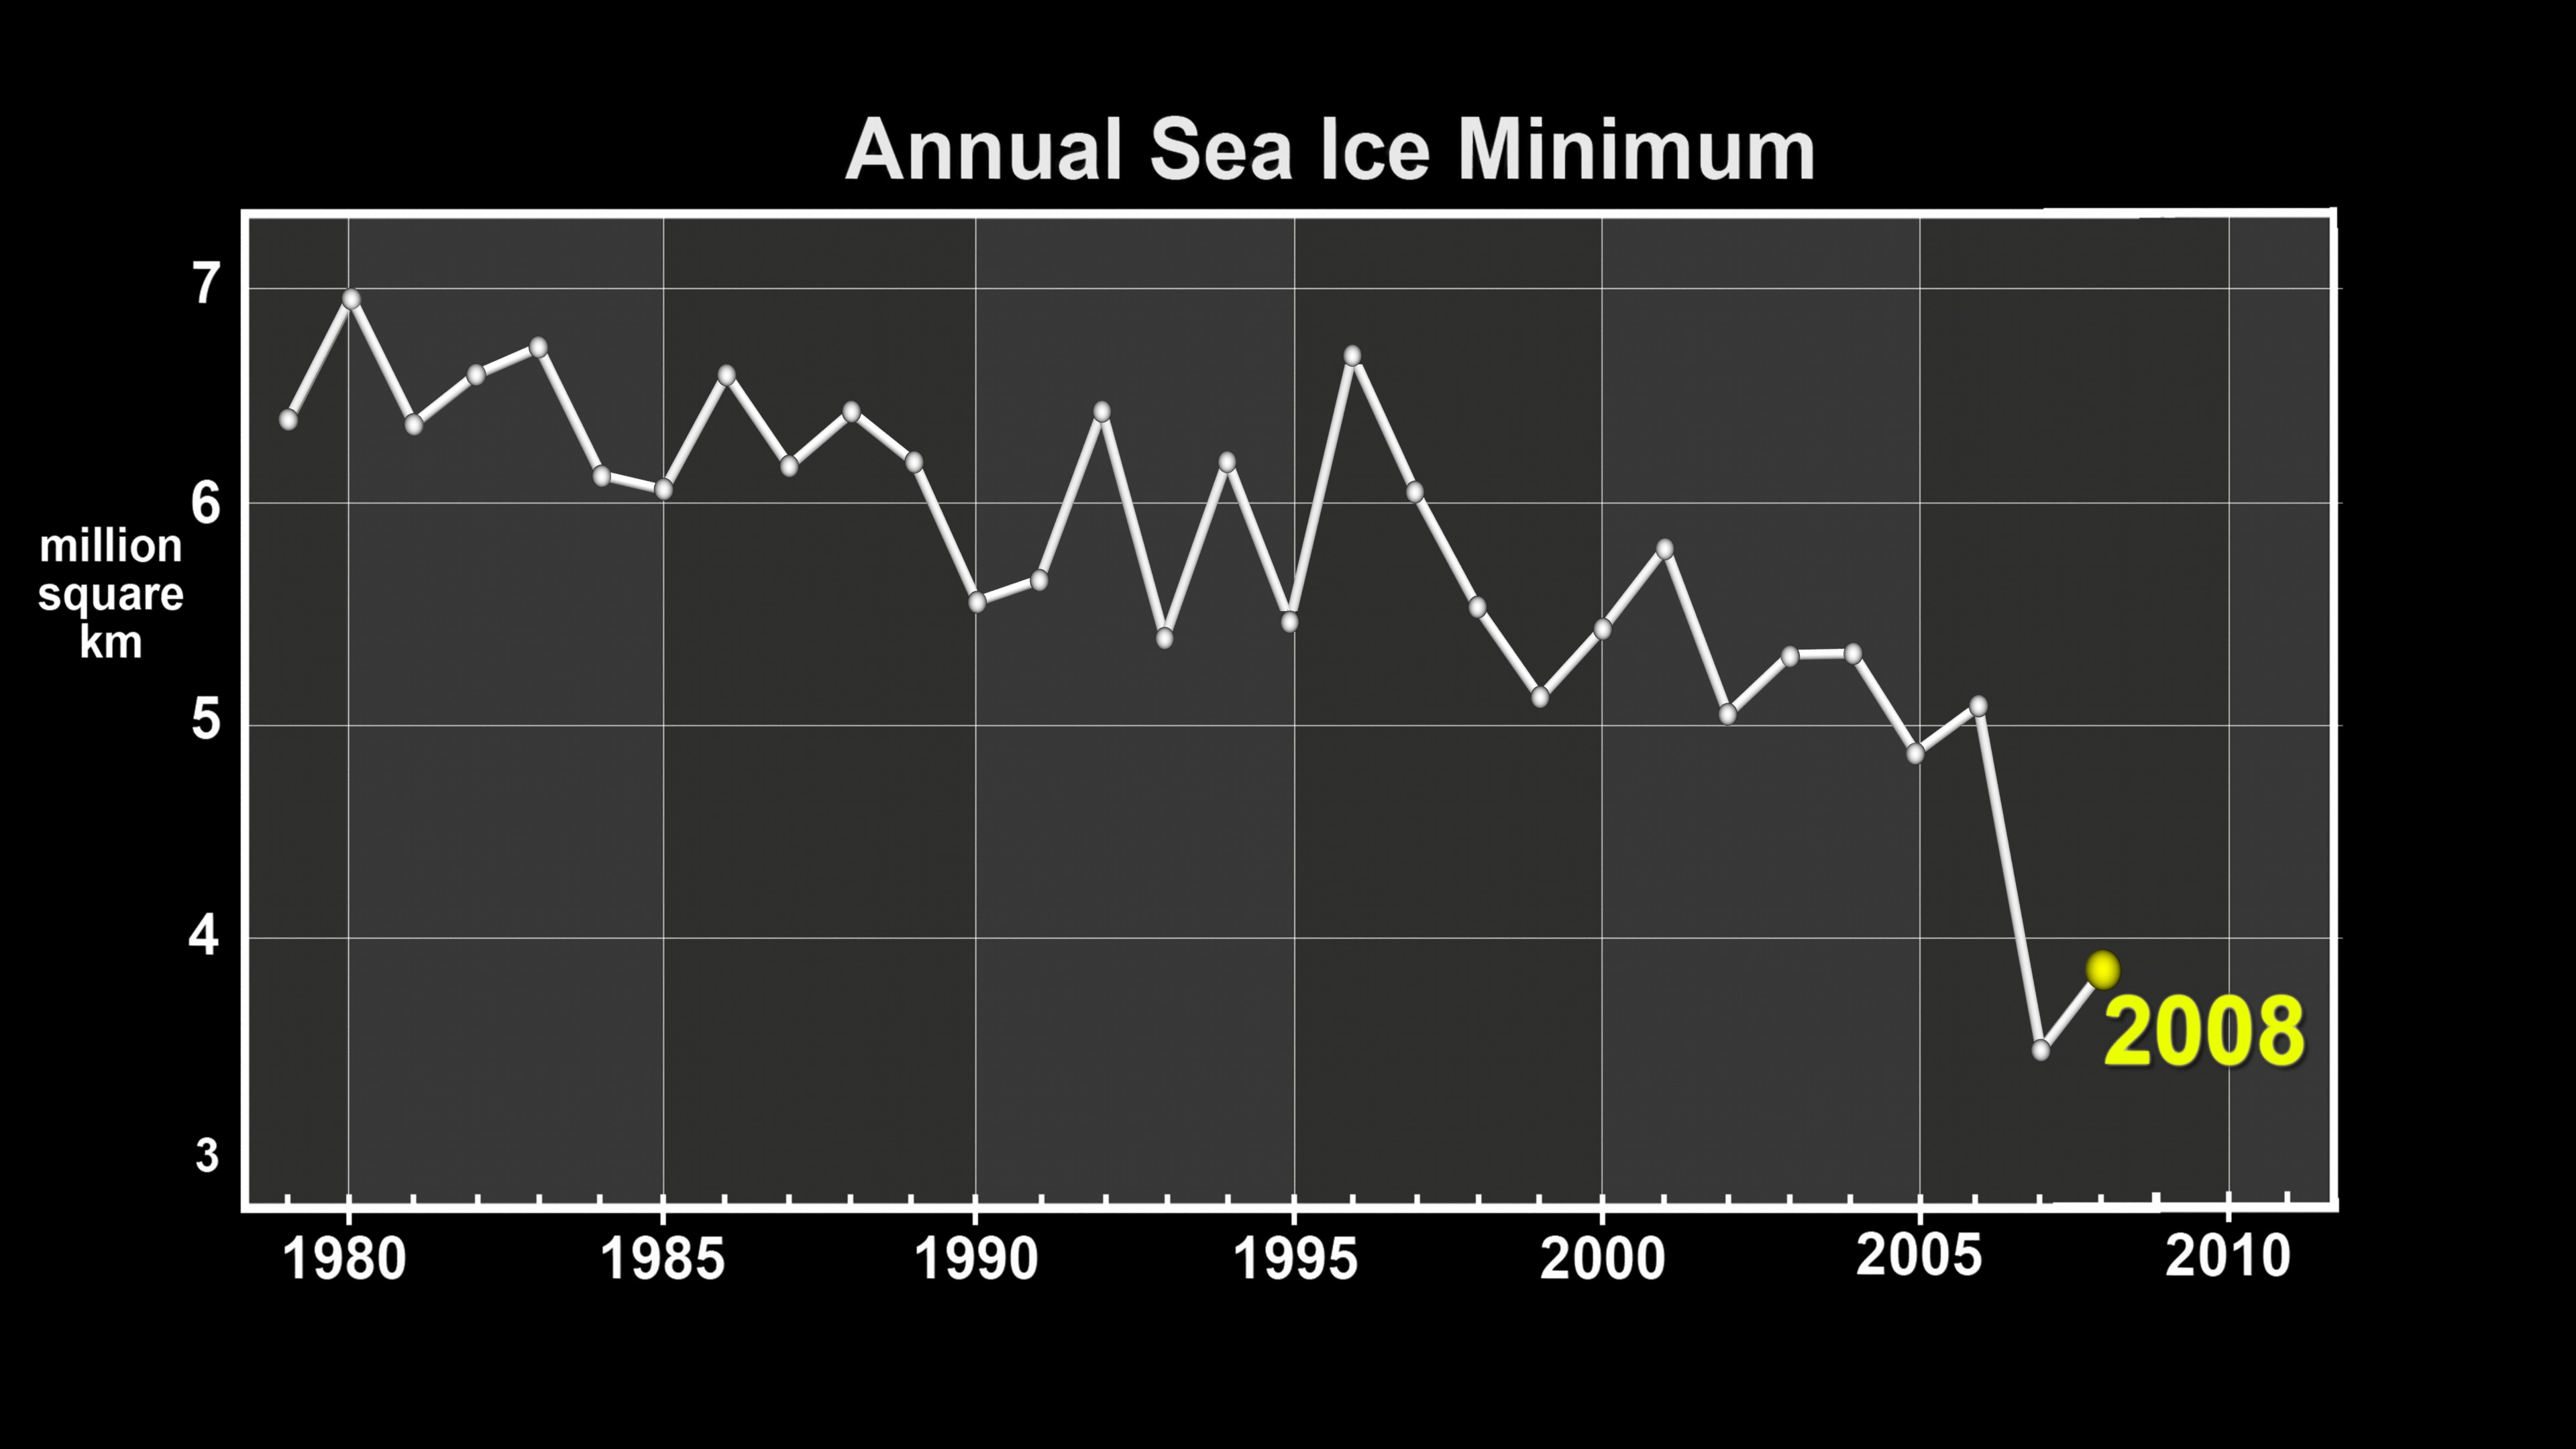
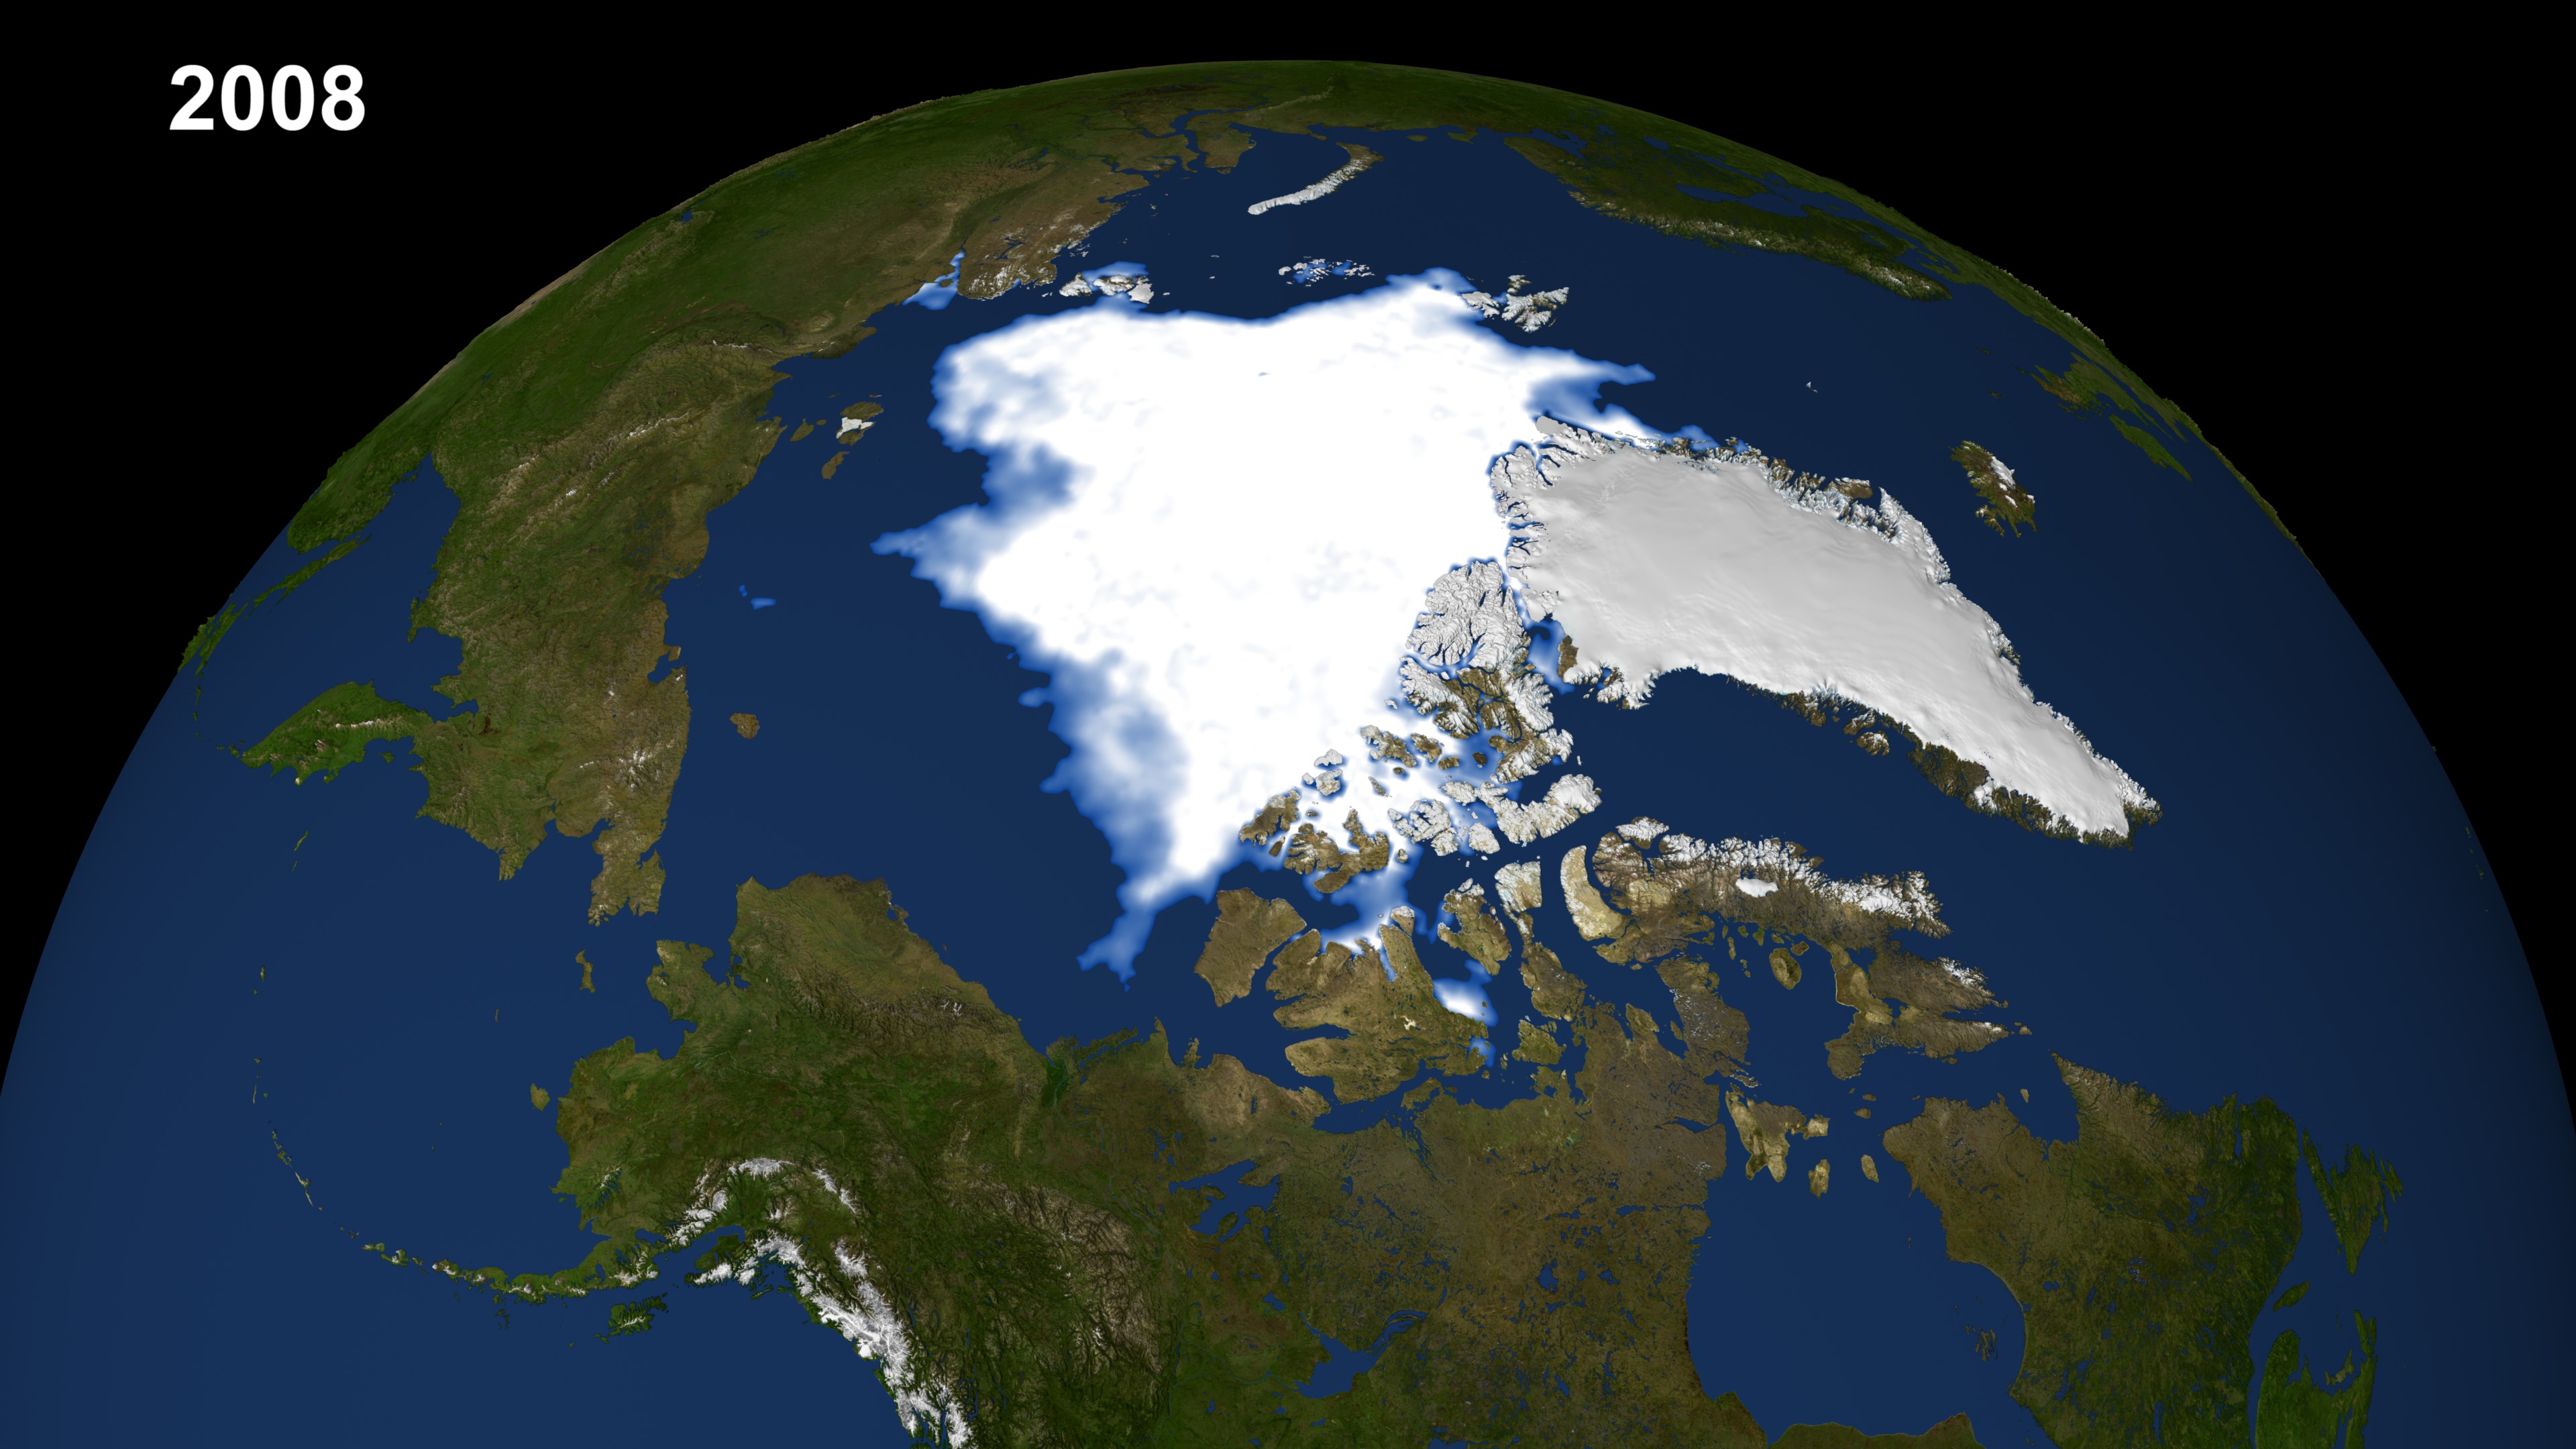
The continued significant reduction in the extent of the summer sea ice cover is a dramatic illustration of the pronounced impact increased global temperatures are having on the Arctic regions. There has also been a significant reduction in the relative amount of older, thicker ice. Satellite-based passive microwave images of the sea ice cover have provided a reliable tool for continuously monitoring changes in the extent of the Arctic ice cover since 1979. The ice parameters derived from satellite ice concentration data that are most relevant to climate change studies are sea ice extent and ice area. This visualization shows ice extent in the background and ice area in the foreground. Ice extent is defined here as the integrated sum of the areas of data elements (pixels) with at least 15% ice concentration while ice area is the integrated sum of the products of the area of each pixel and the corresponding ice concentration. Ice extent provides information about how far south (or north) the ice extends in winter and how far north (or south) it retreats toward the continent in the summer while the ice area provides the total area actually covered by sea ice which is useful for estimating the total volume and therefore mass, given the average ice thickness. For more information about these ice datasets, see The Journal of Geophysical Research VOL. 113, C02S07, doi:10.1029/2007JC004257, 2008
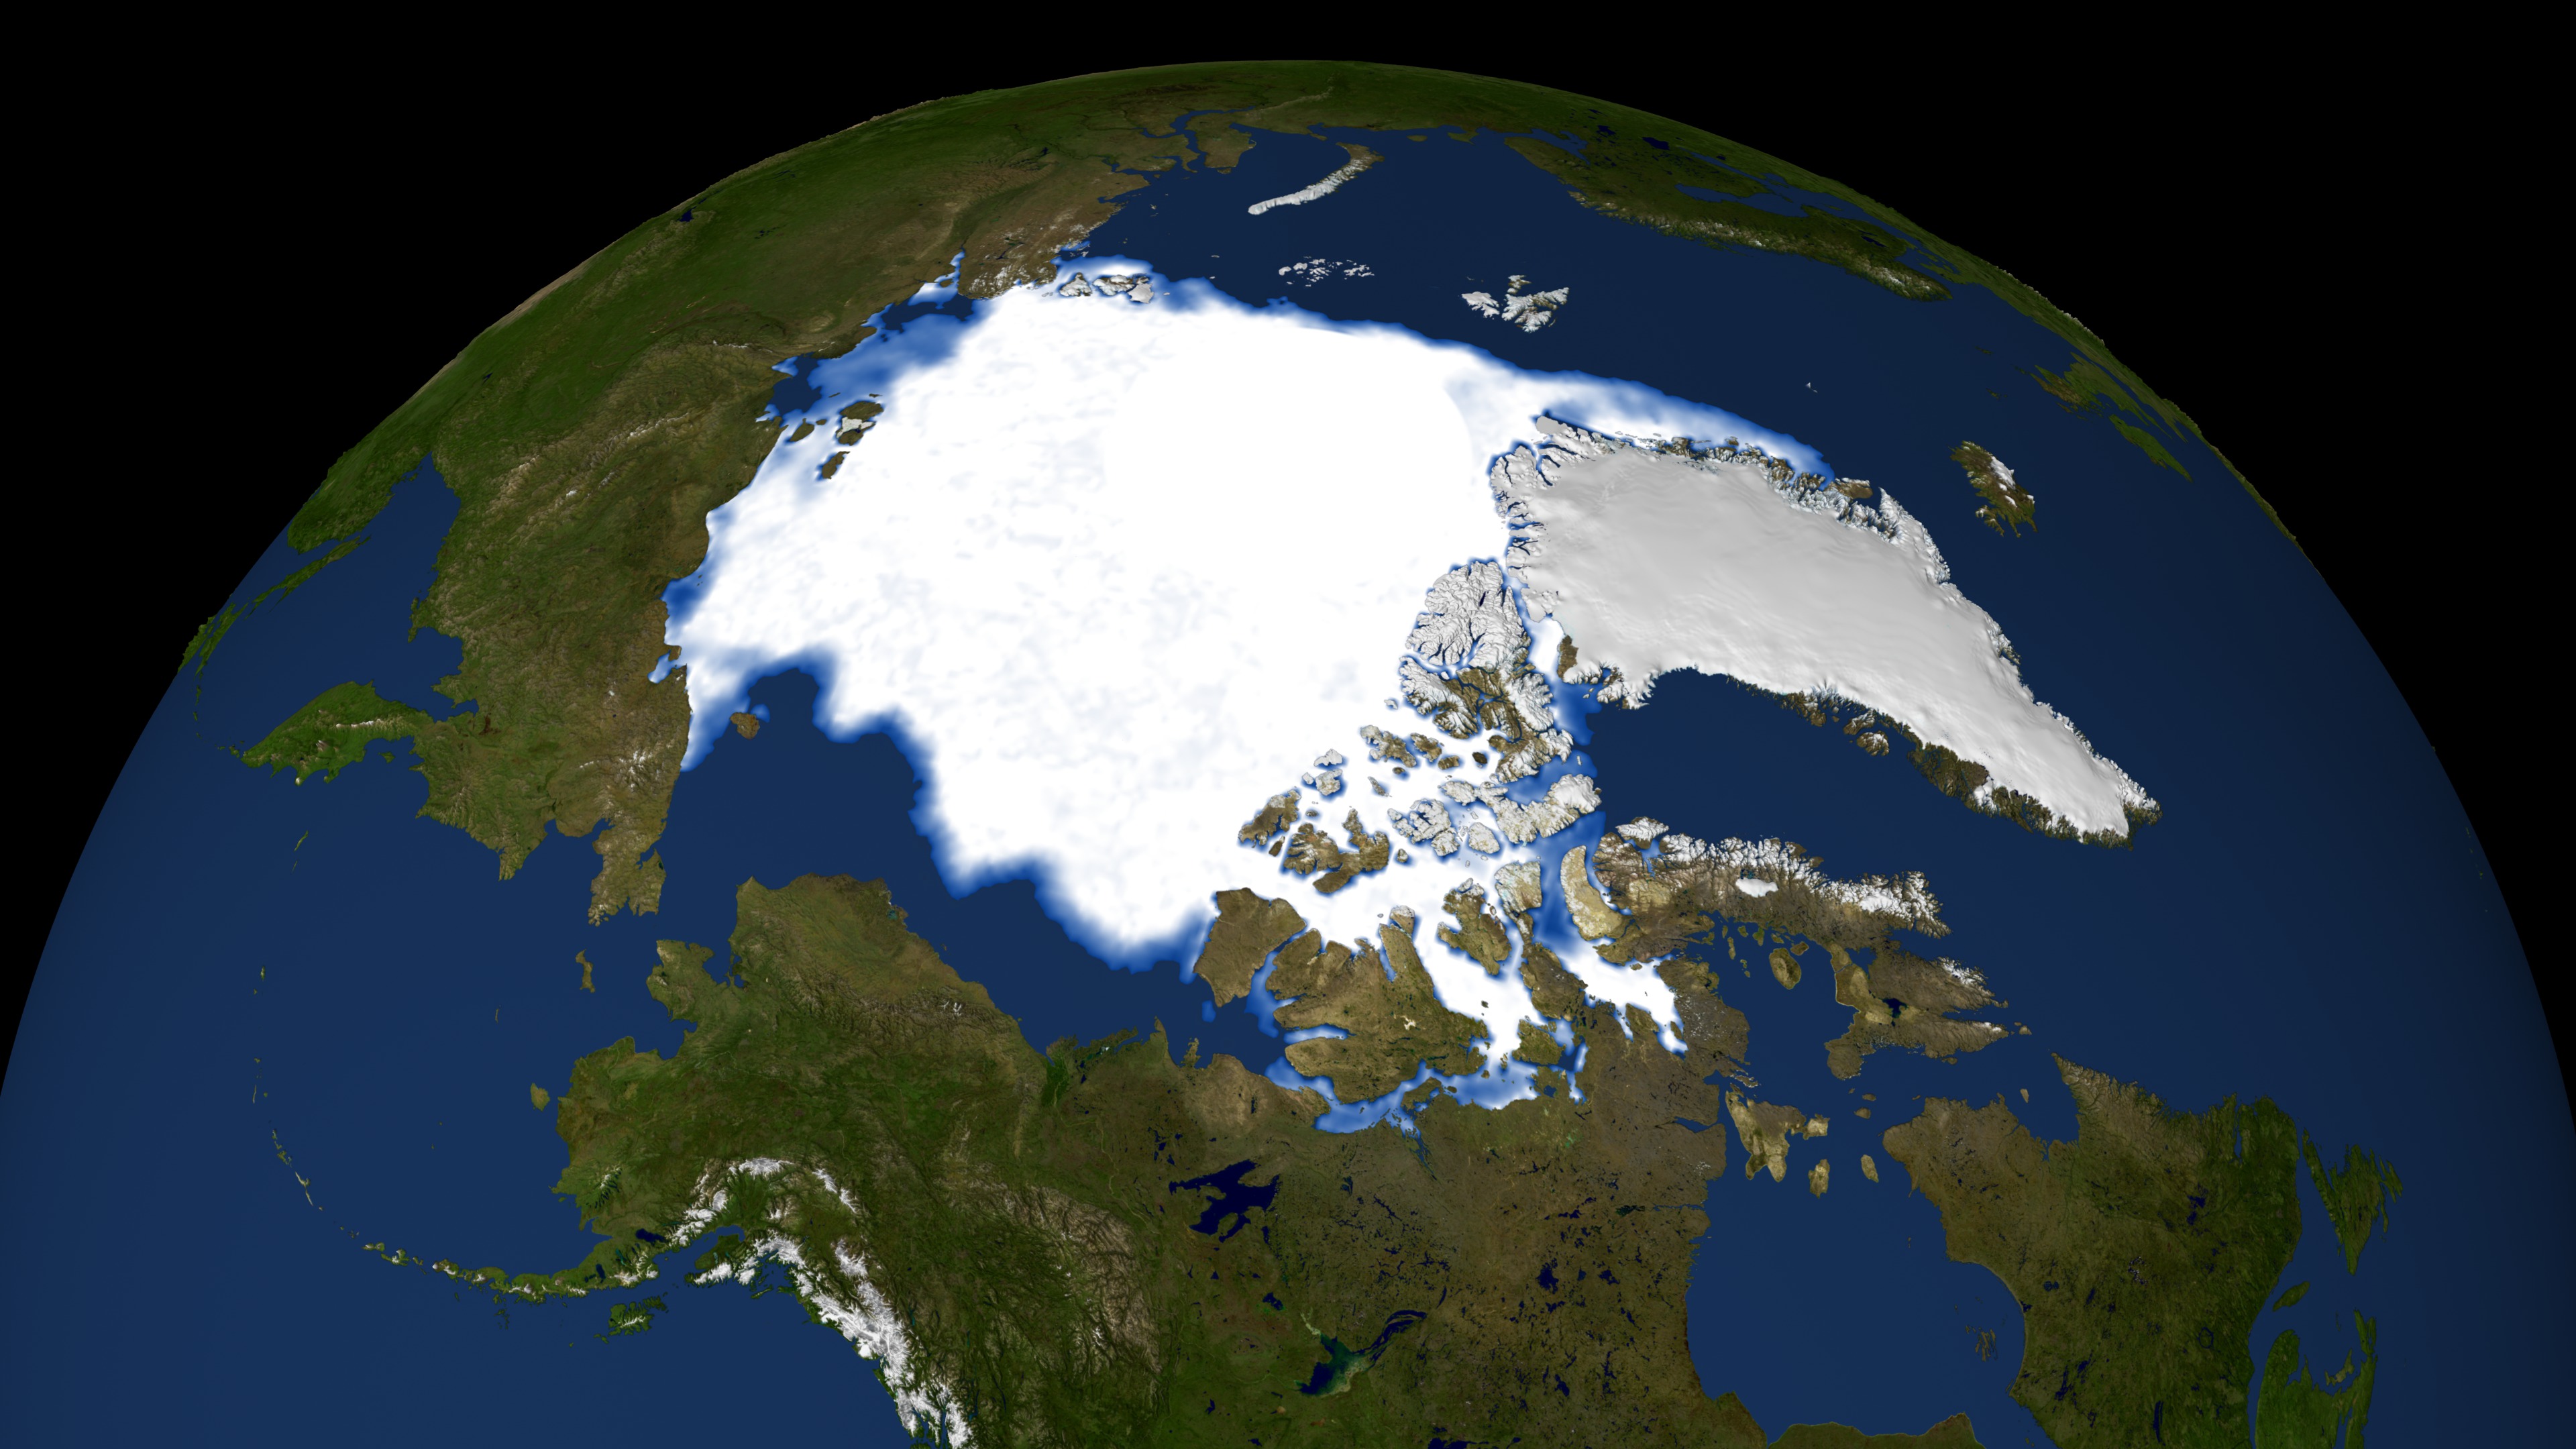
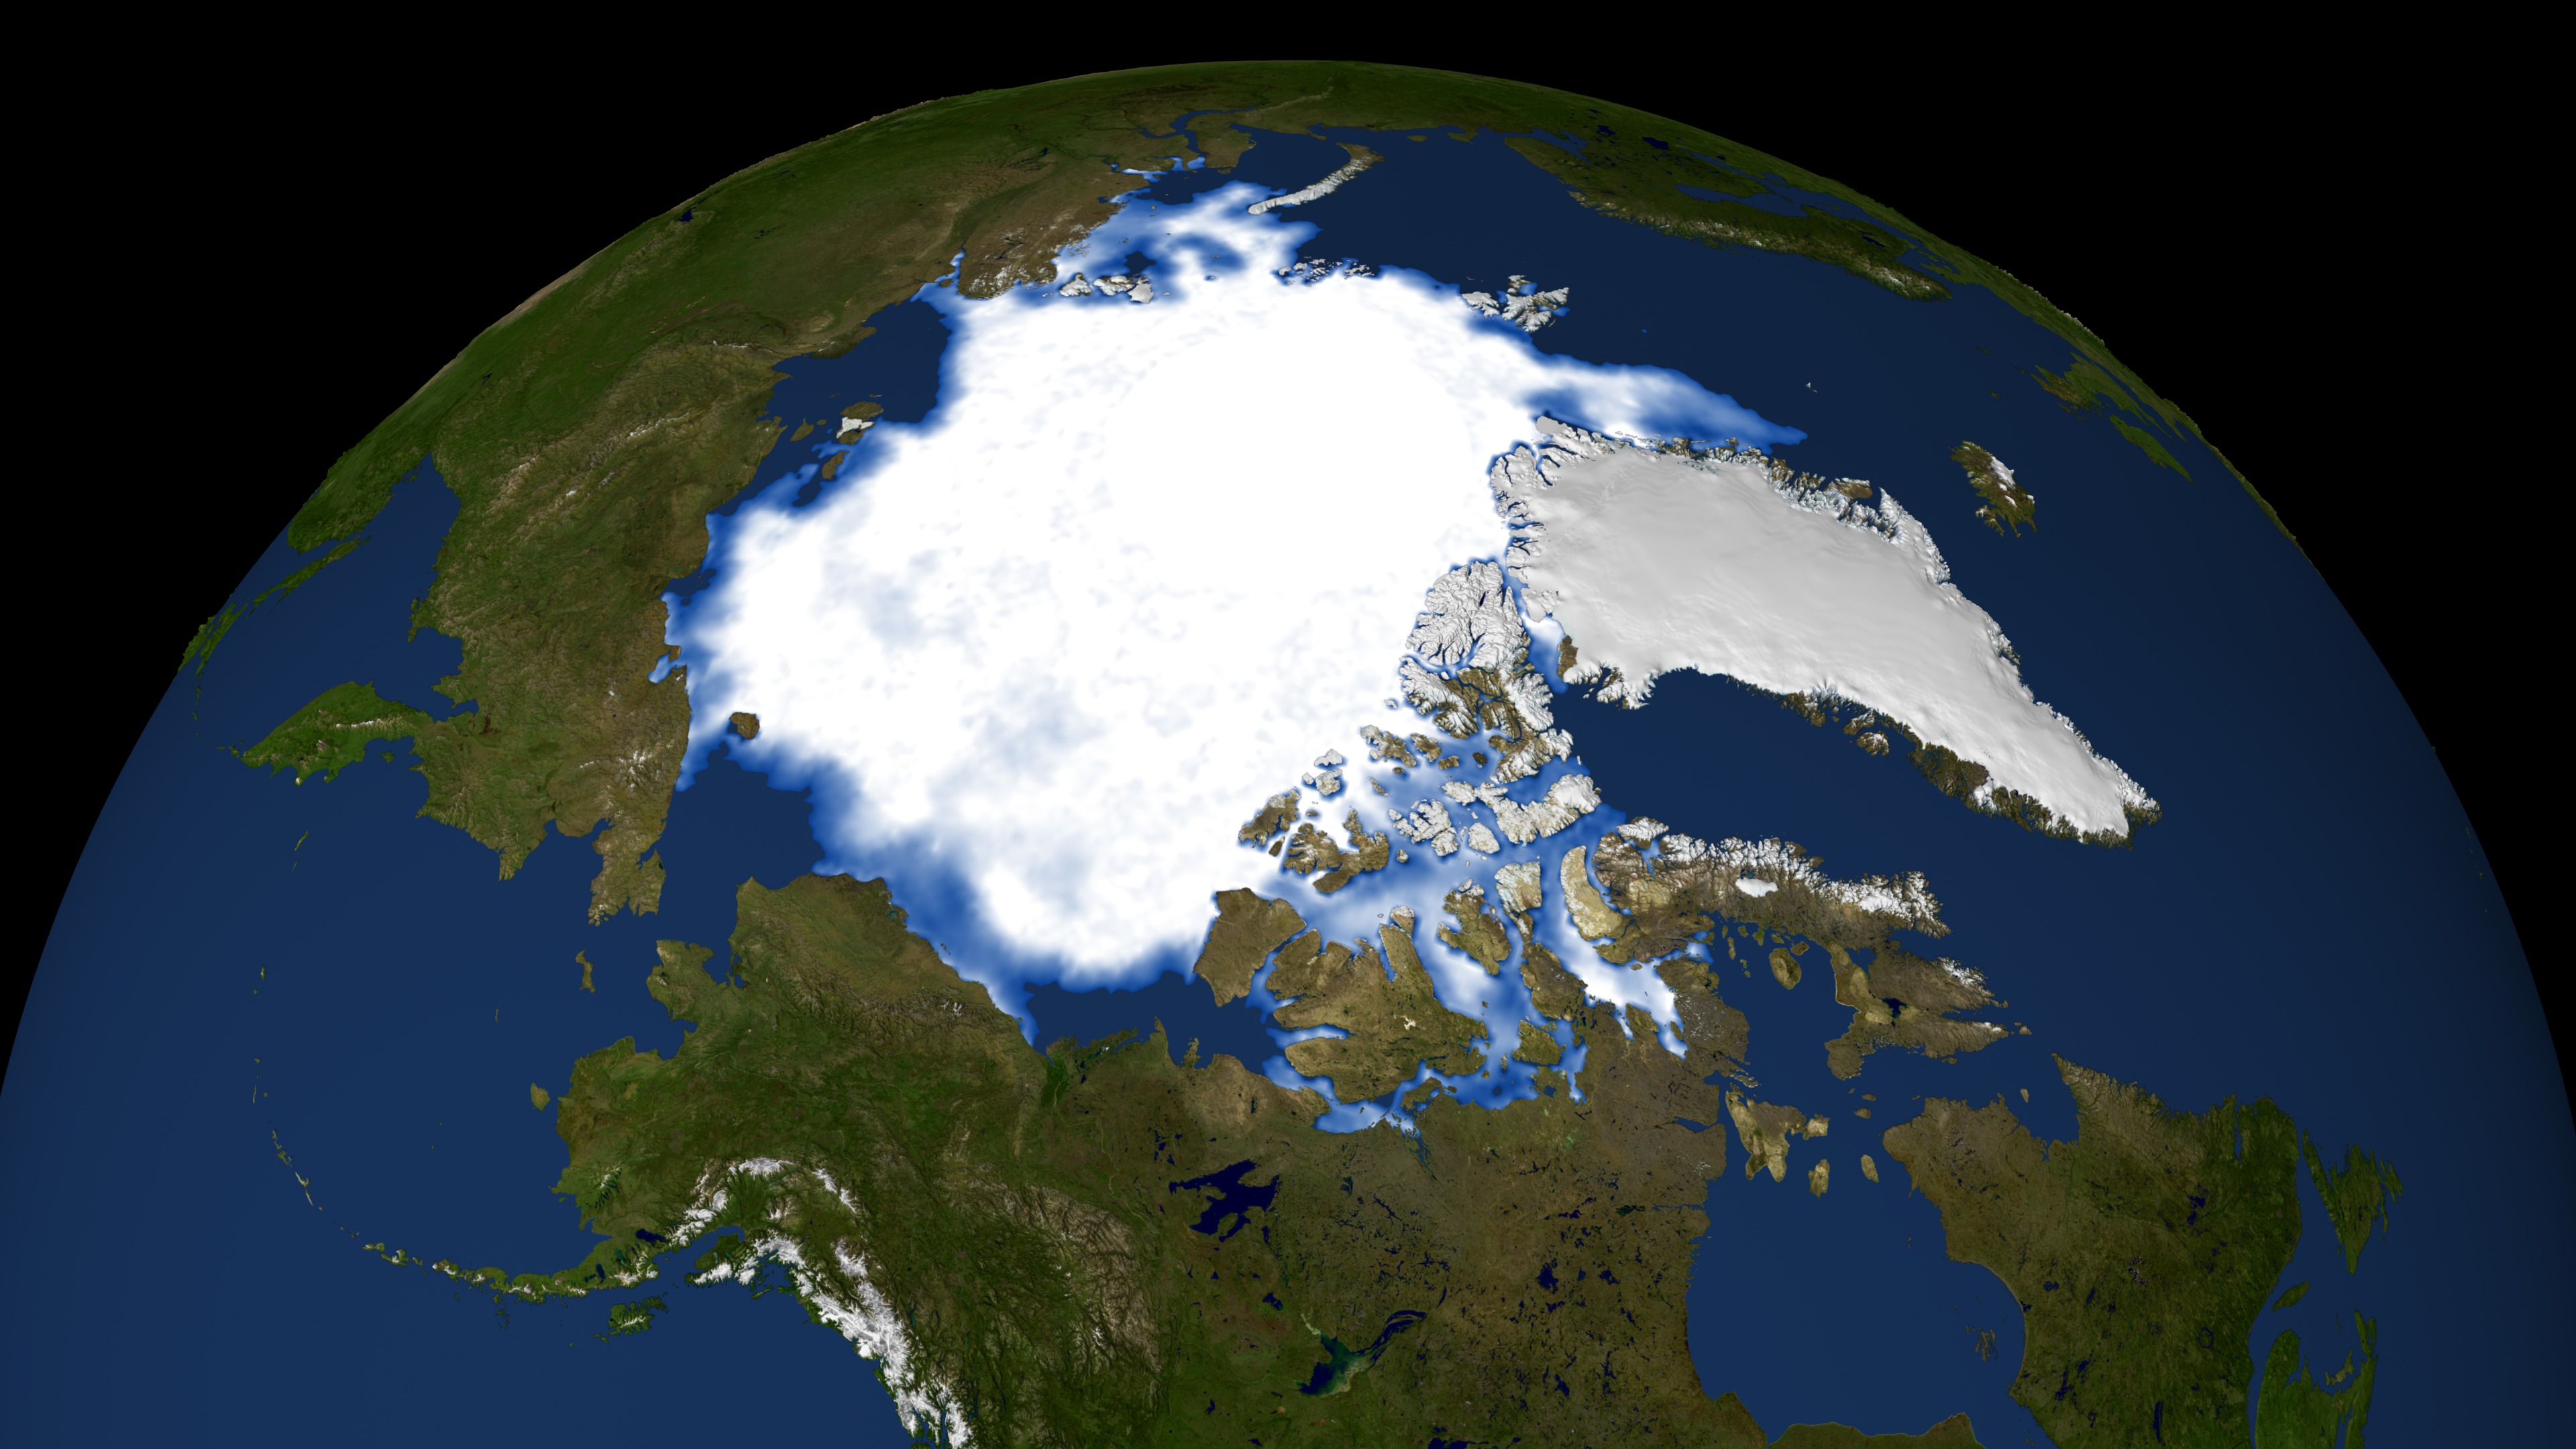
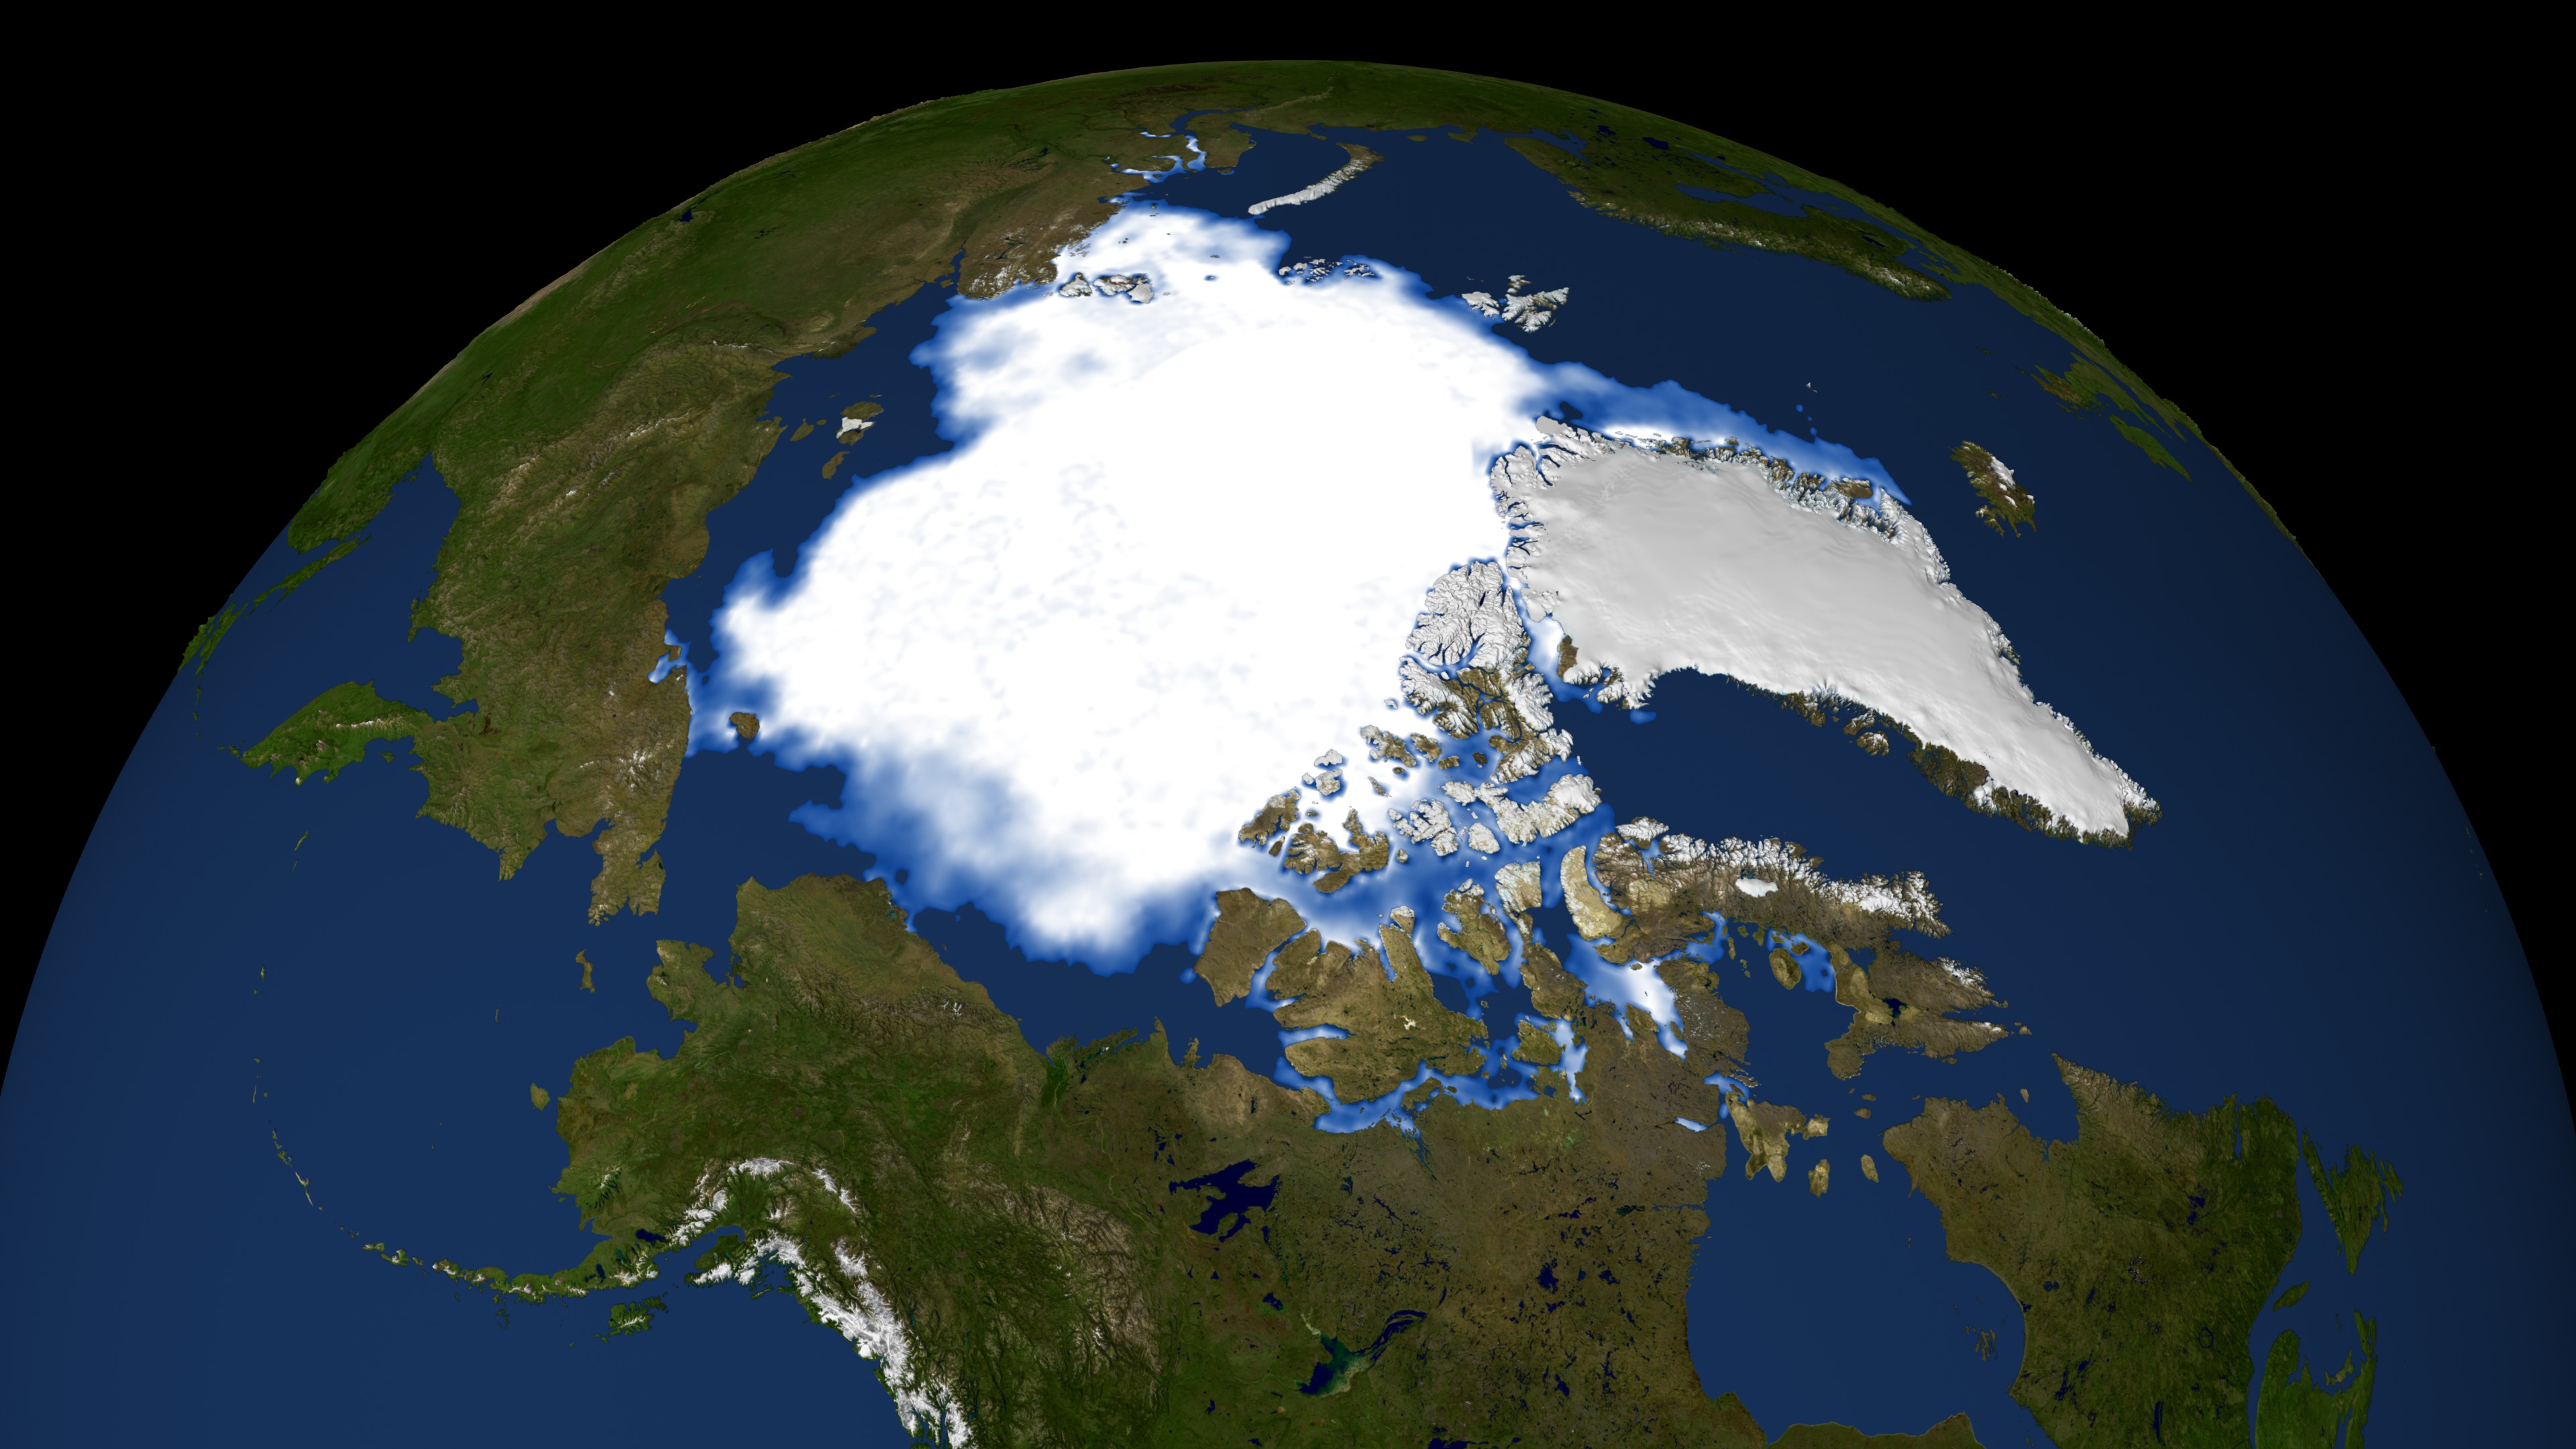
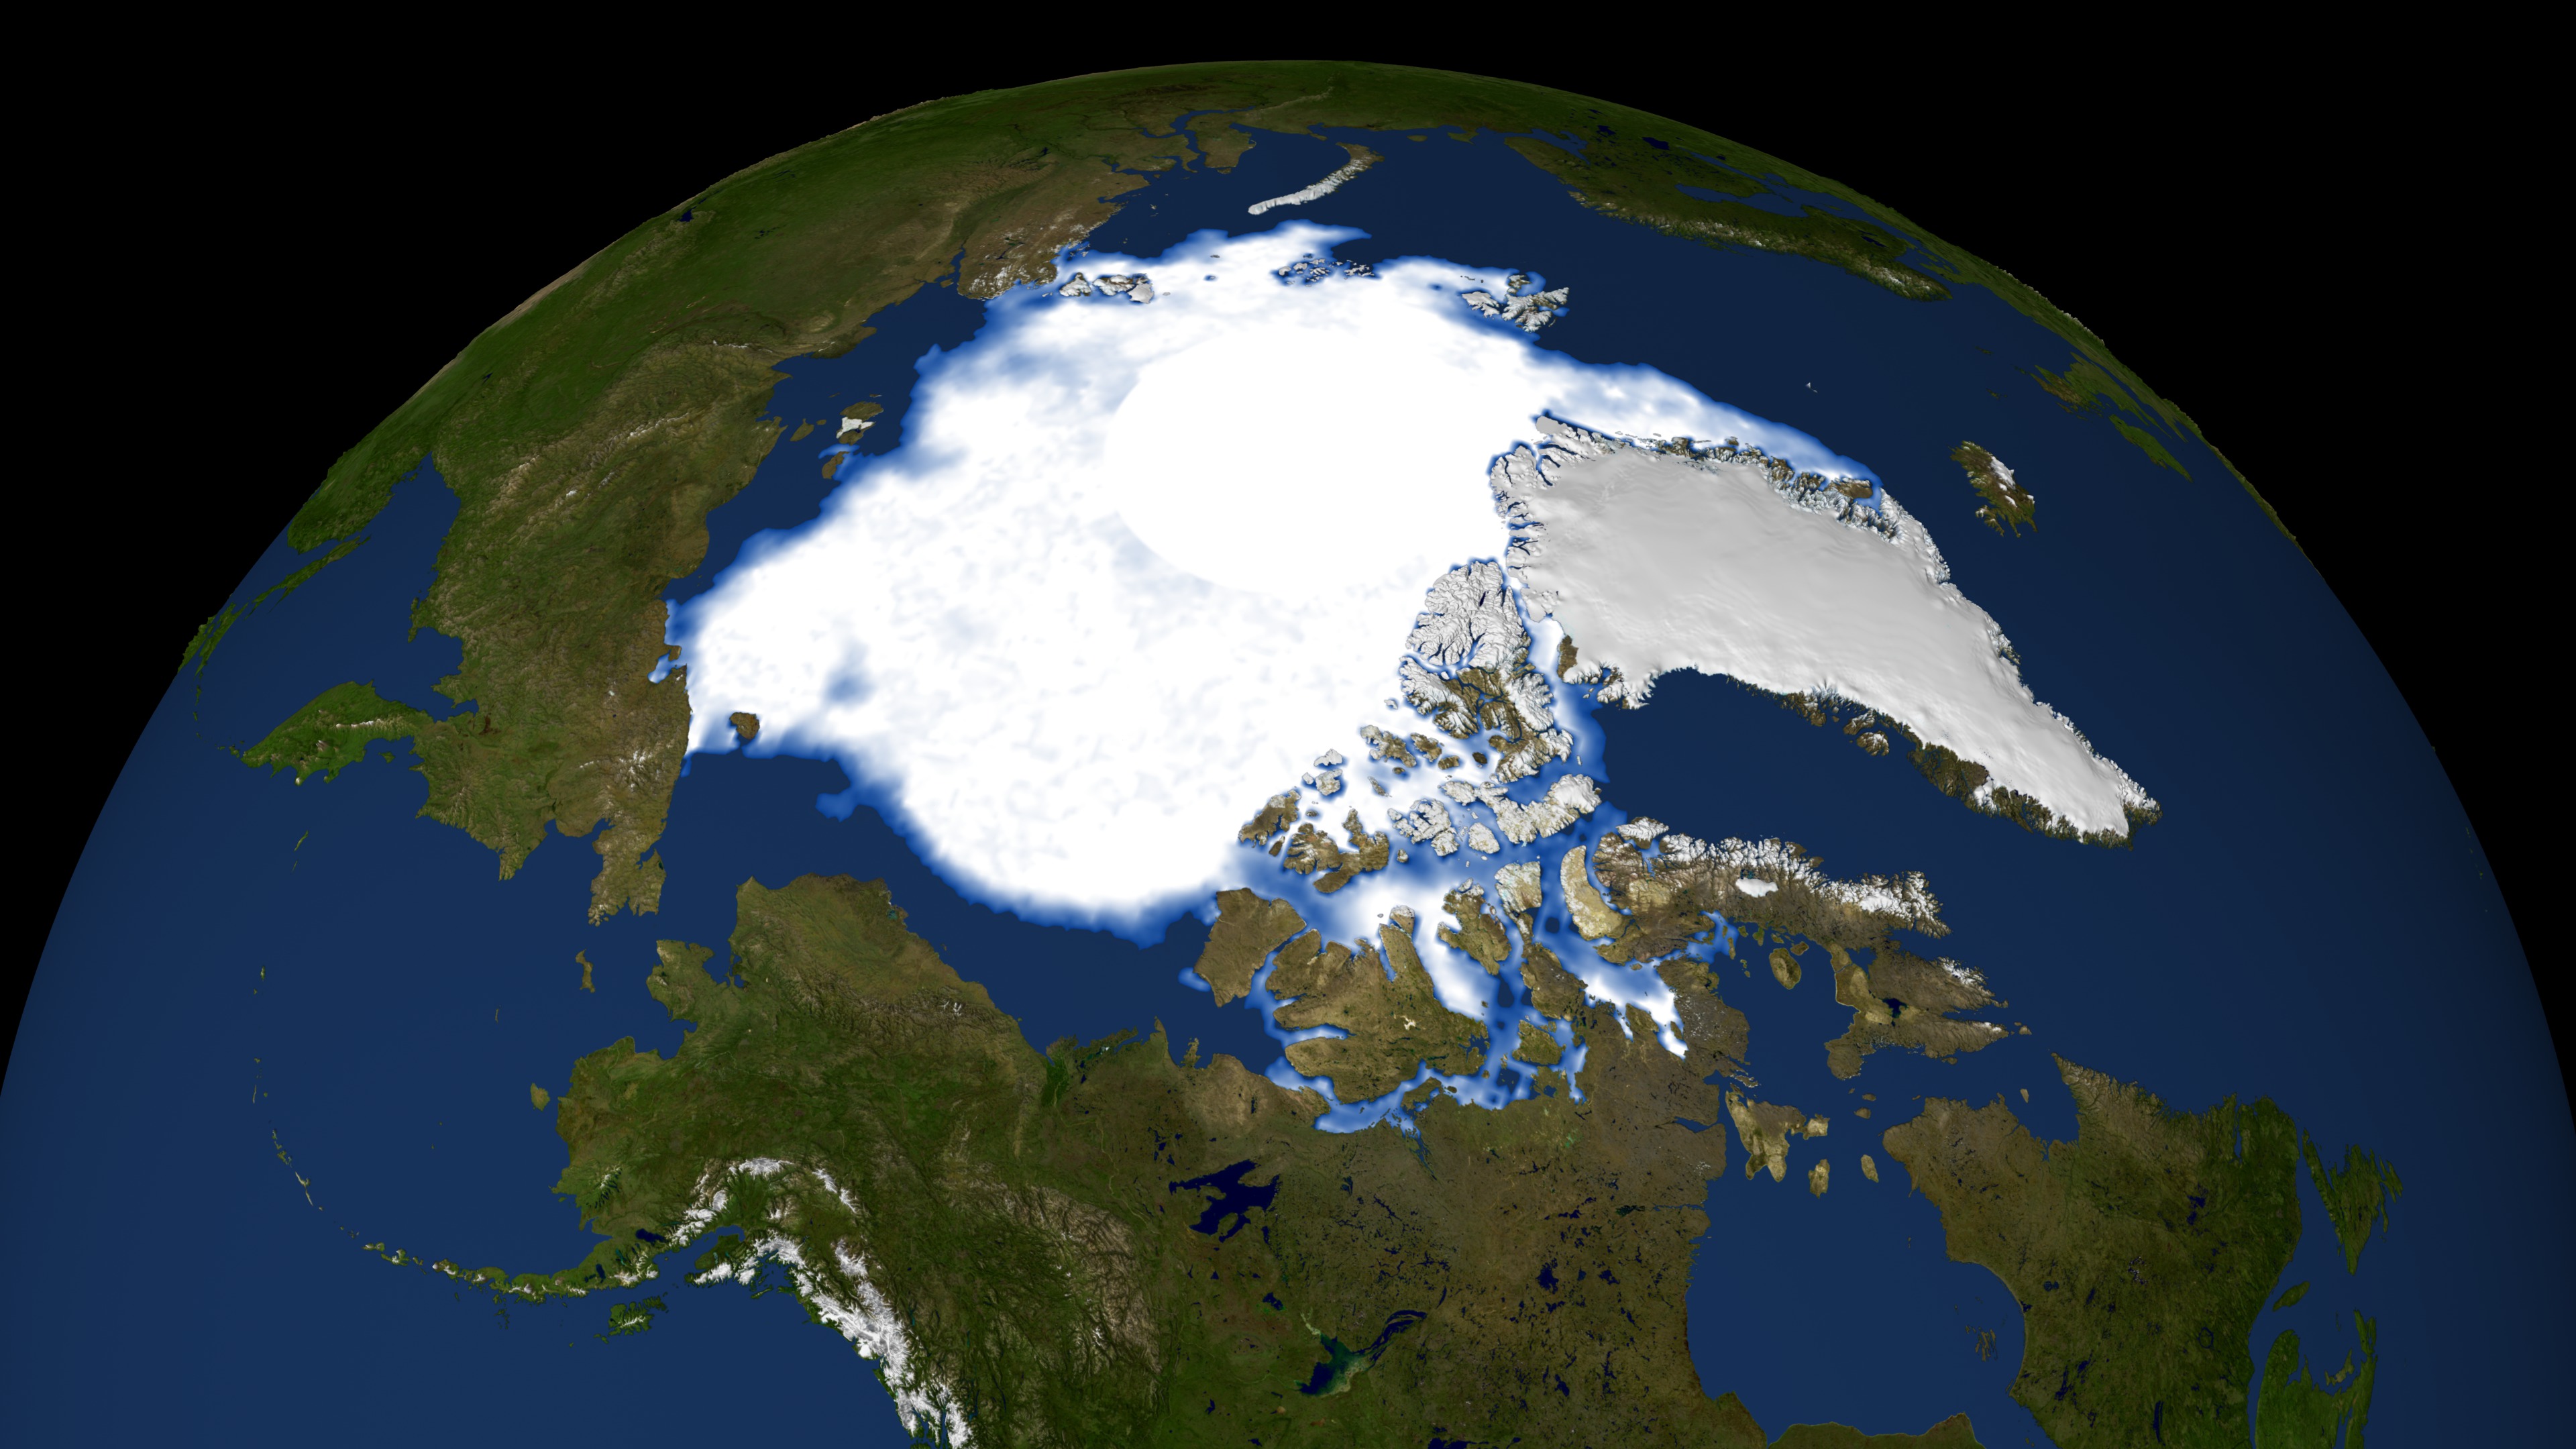
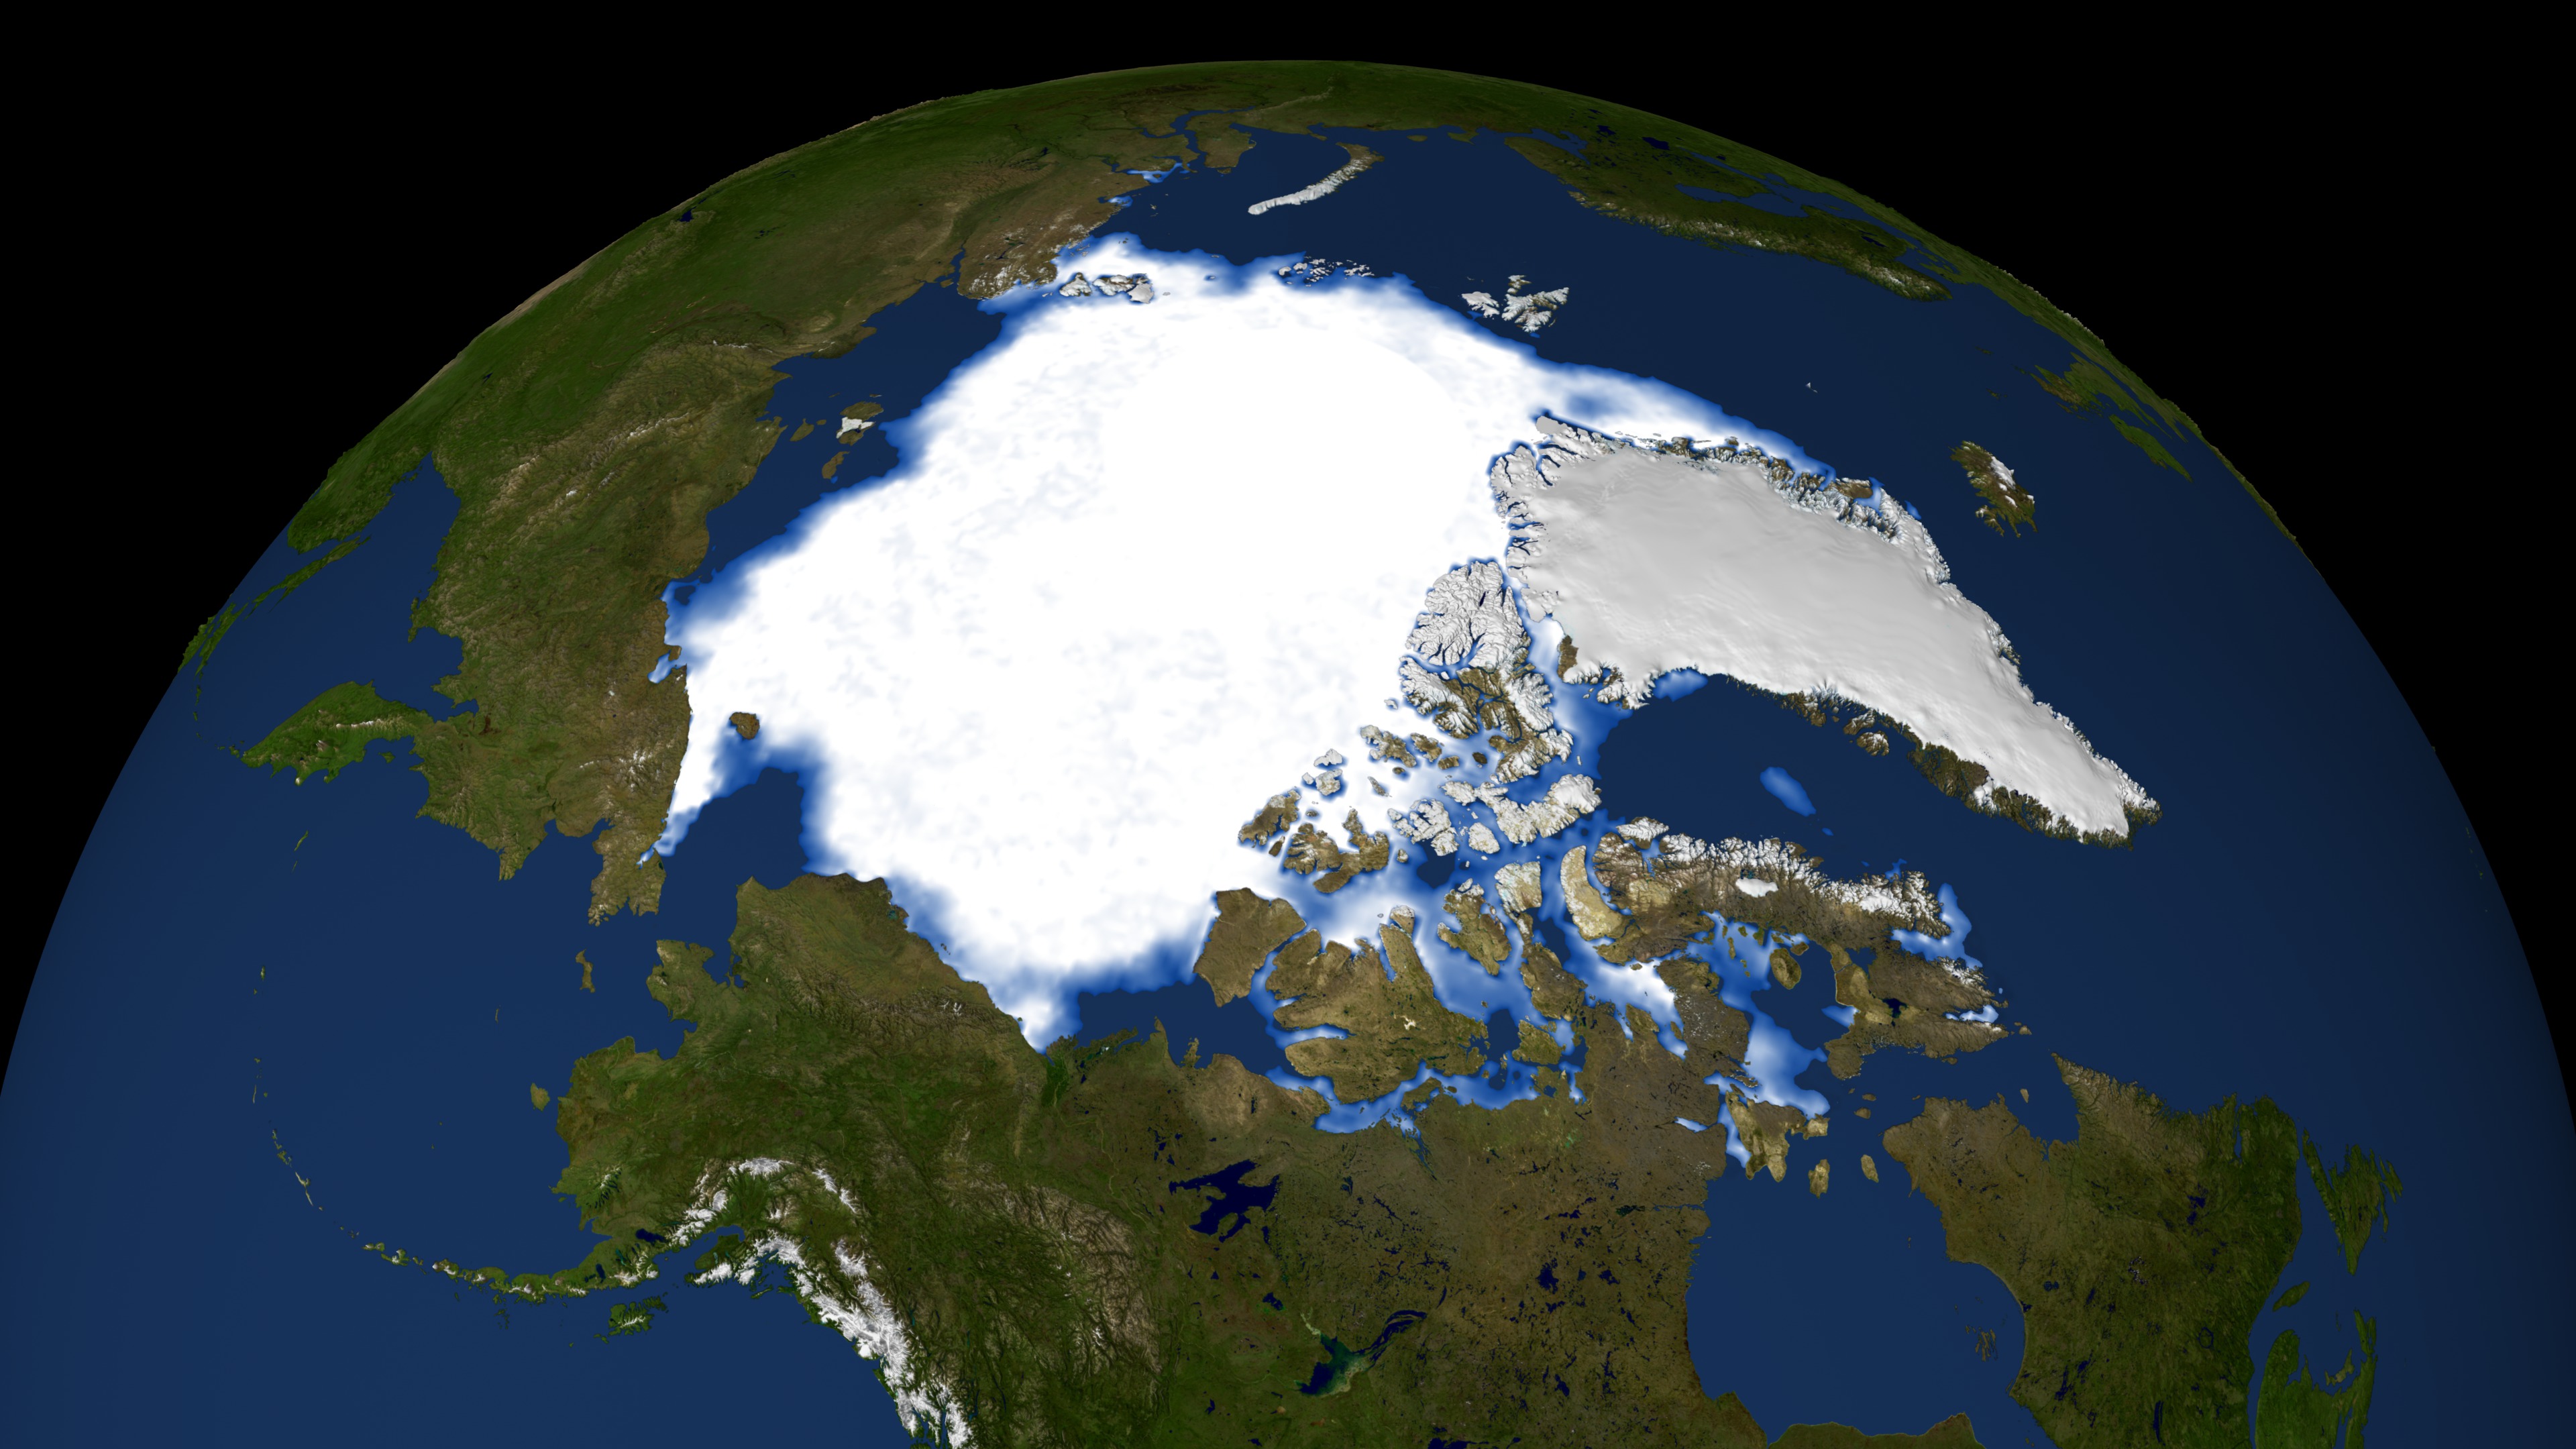
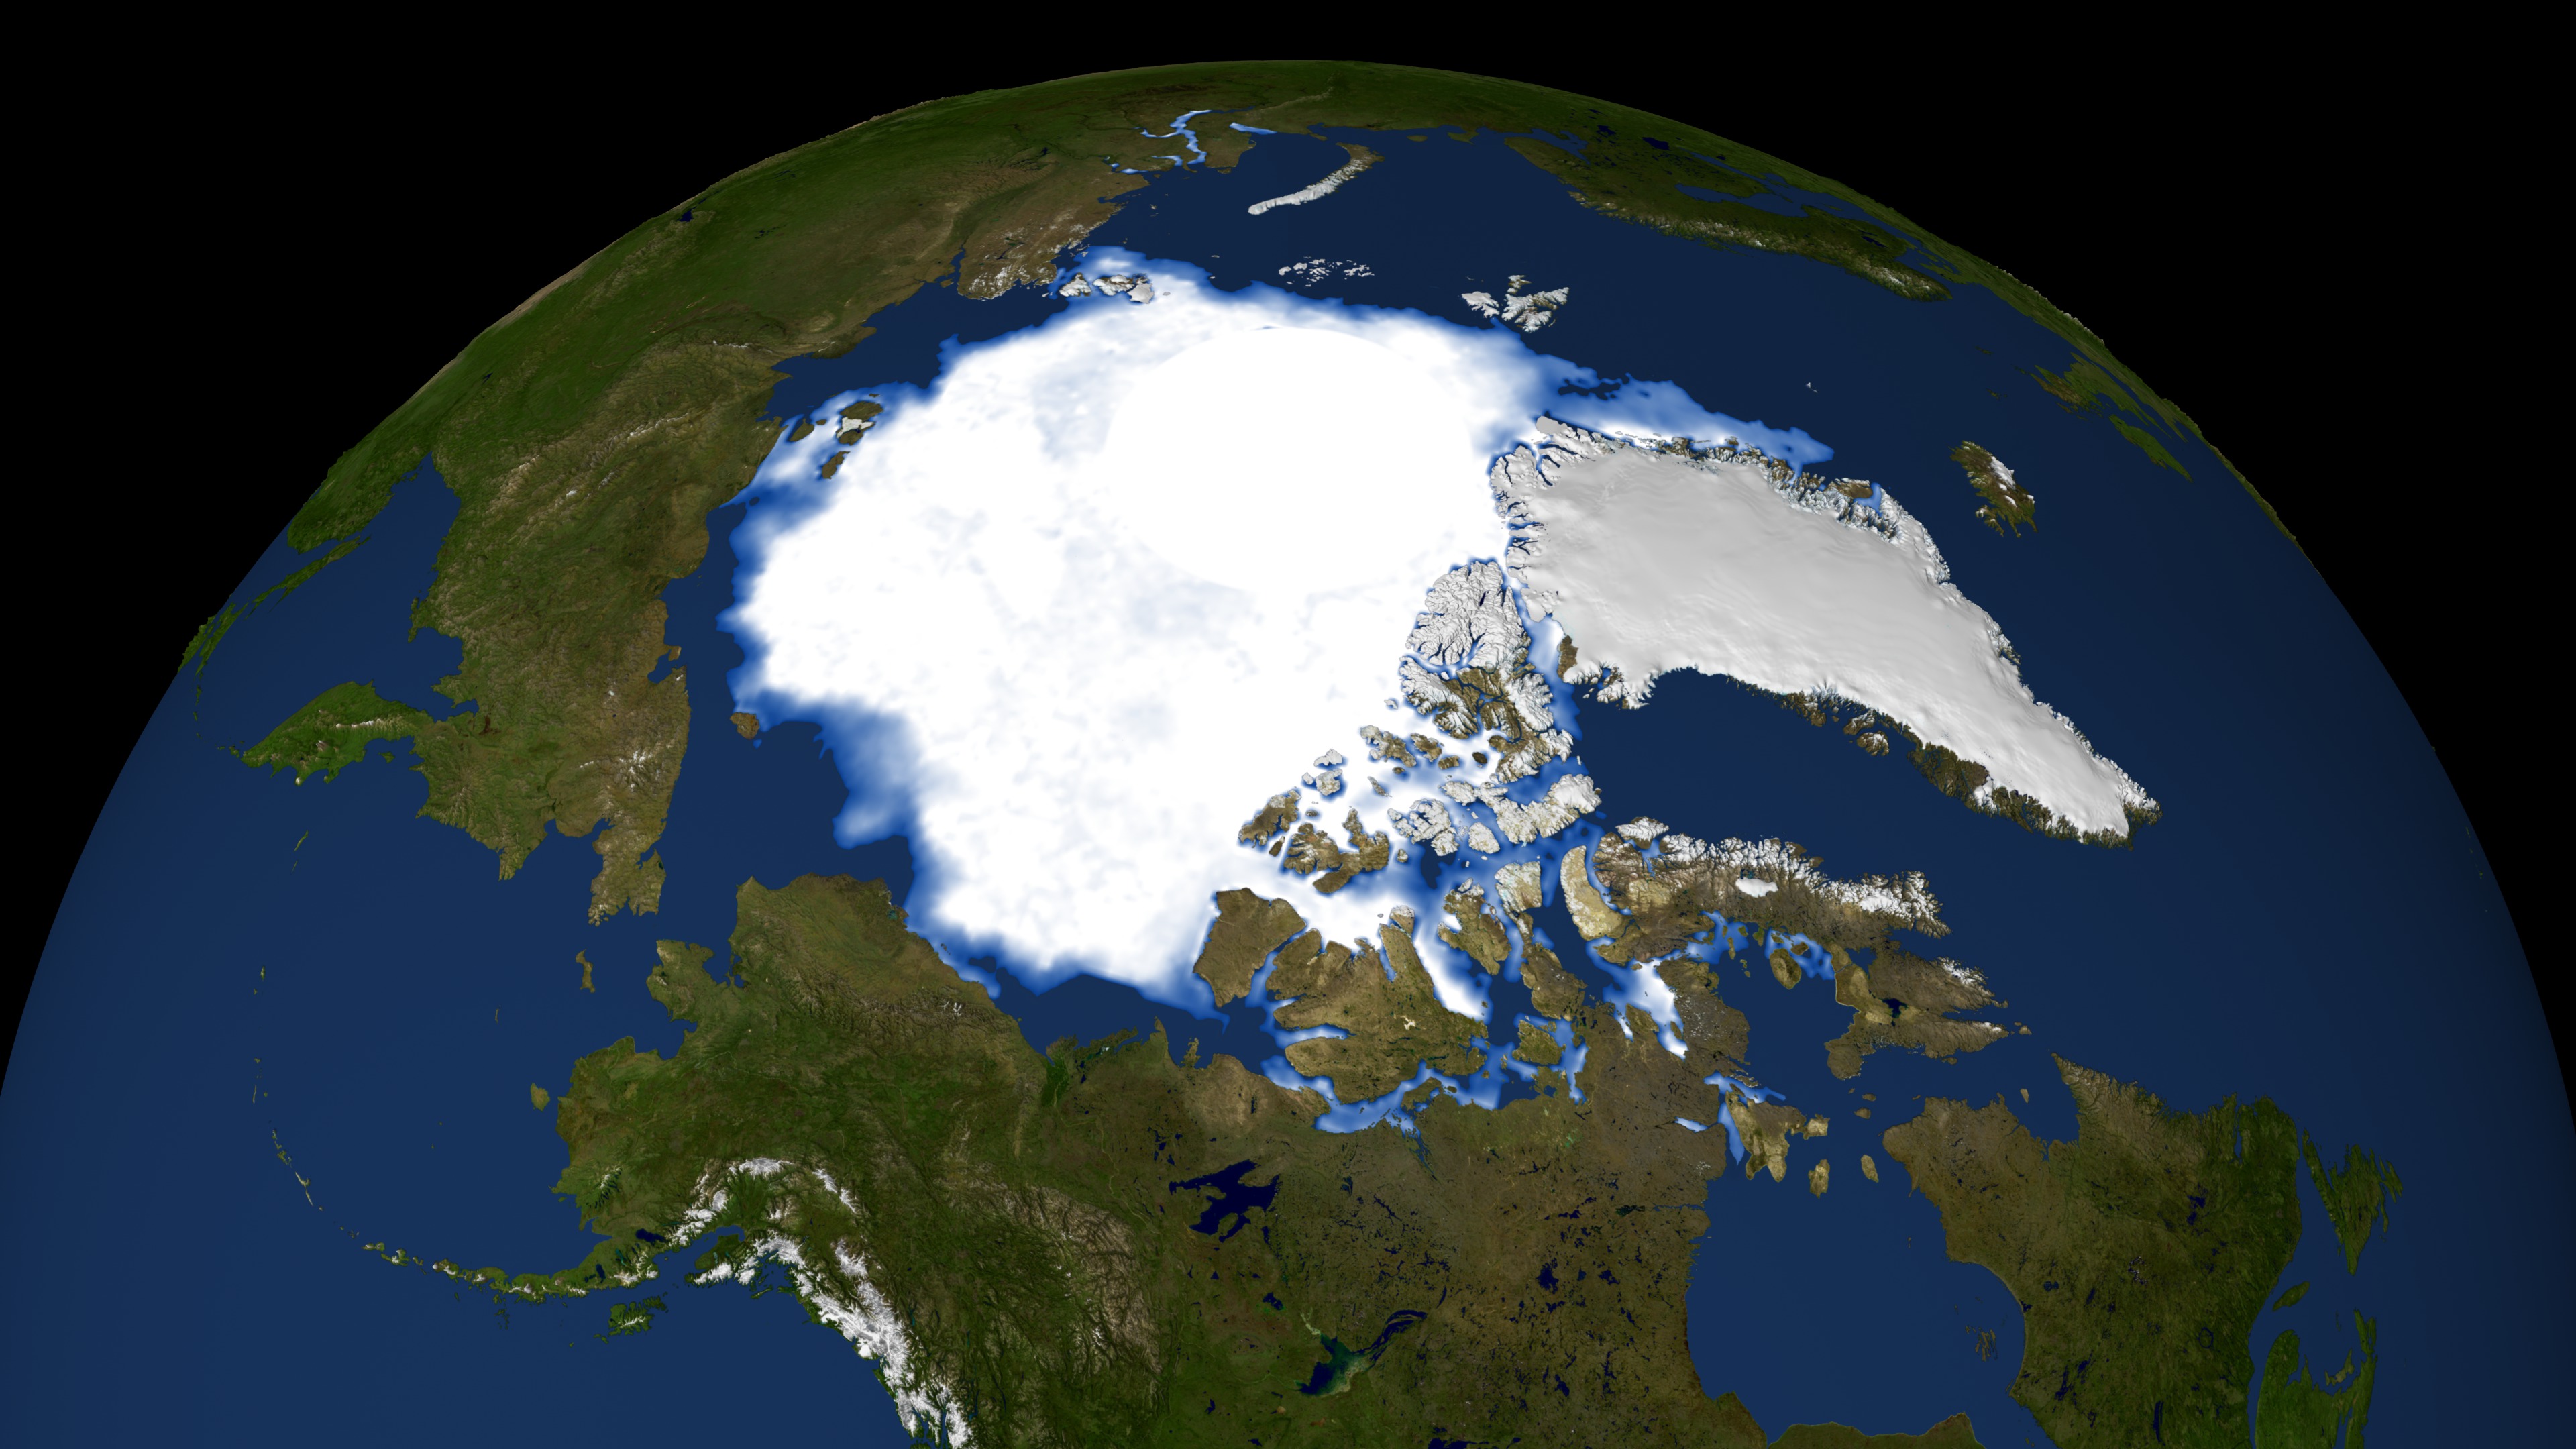
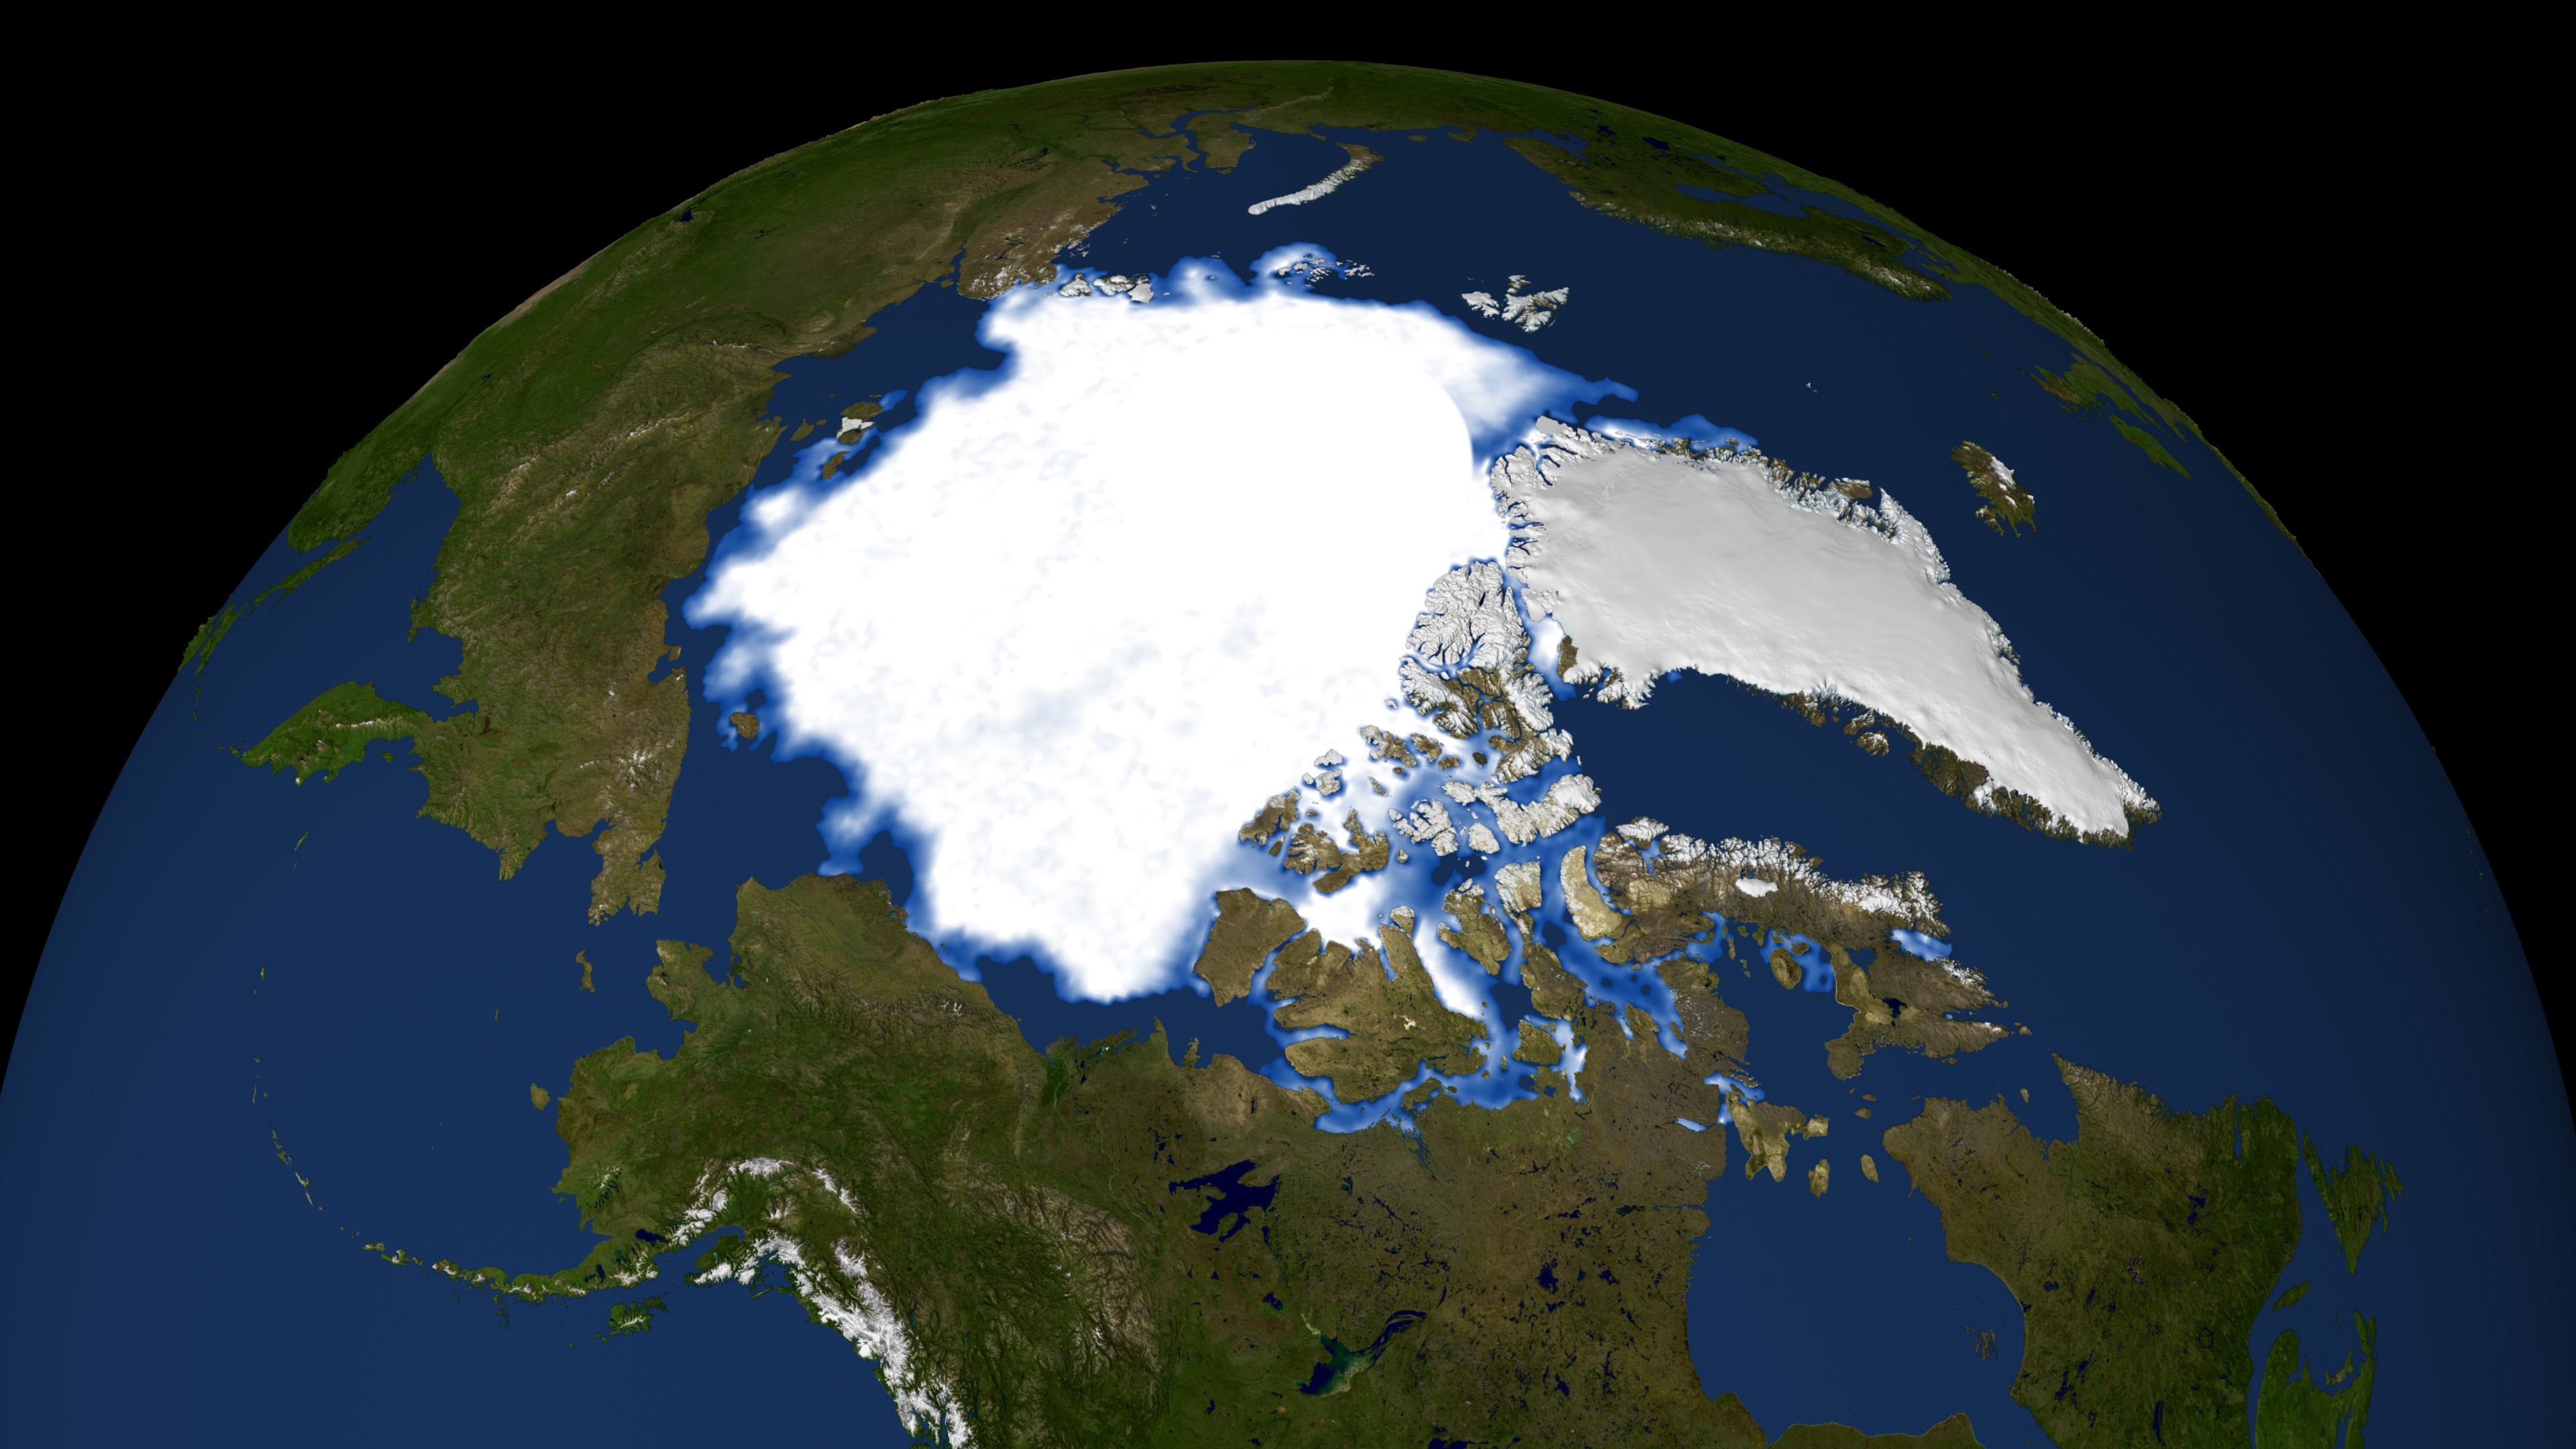
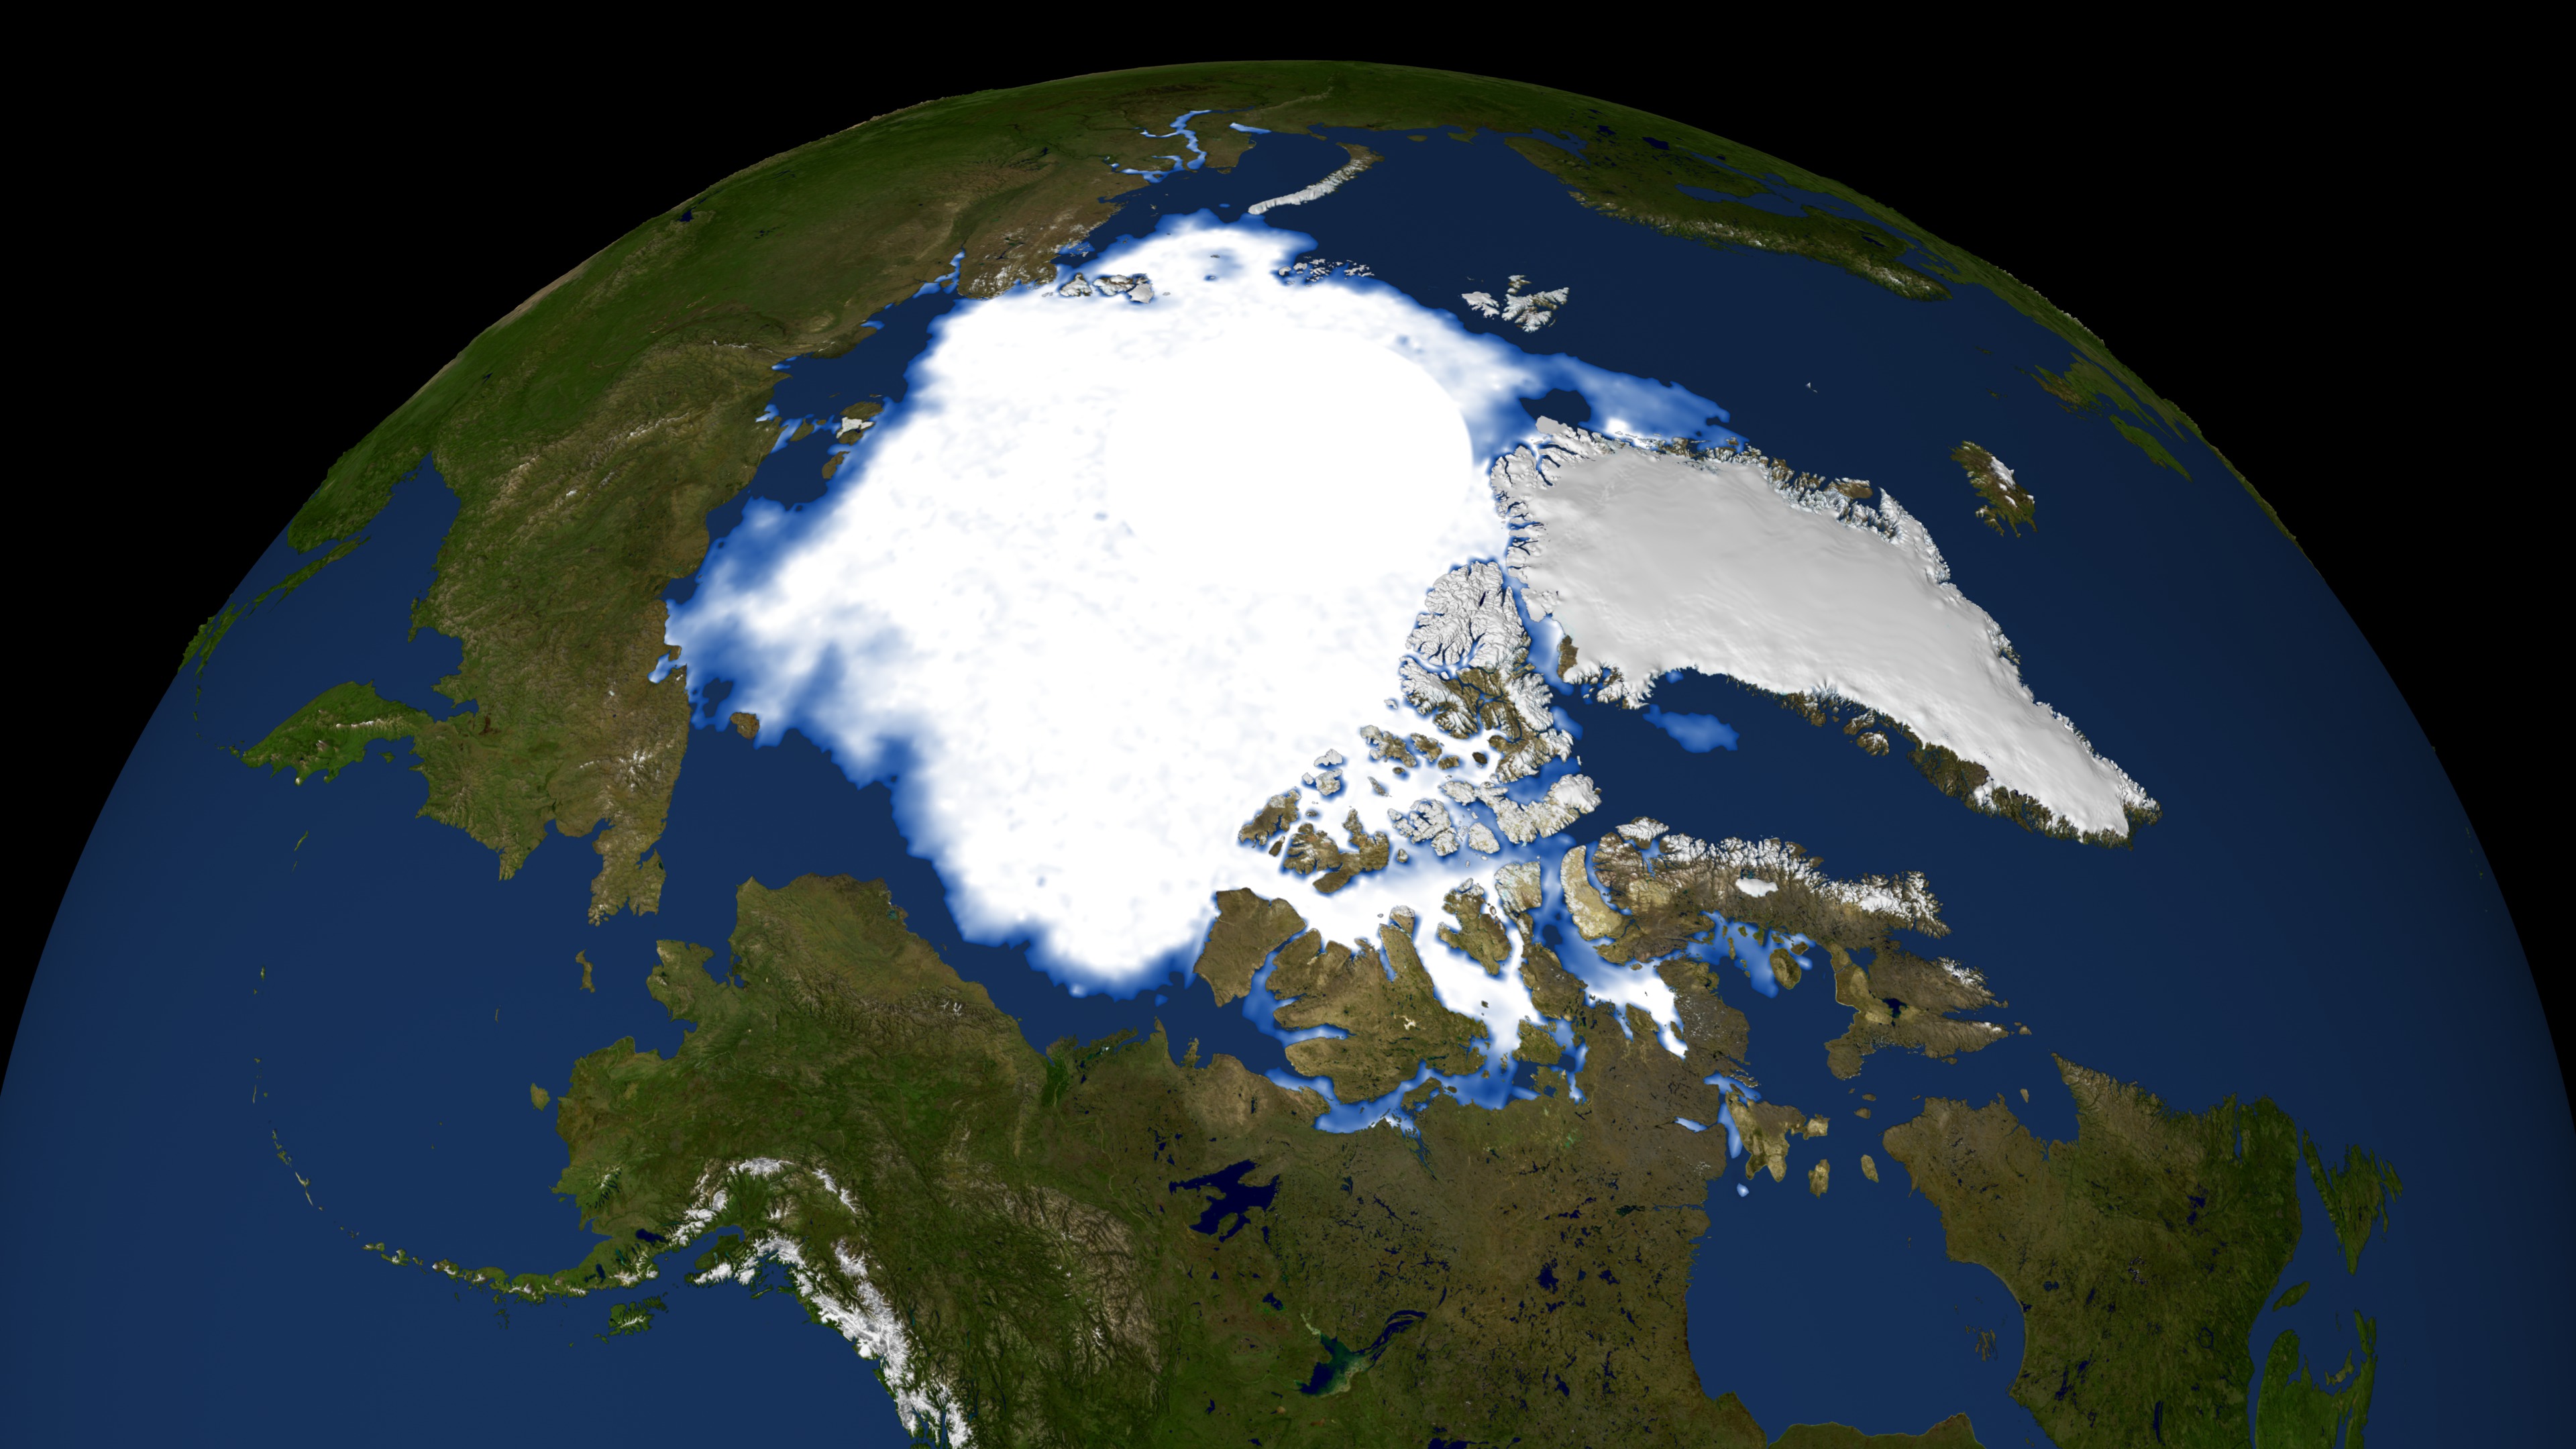
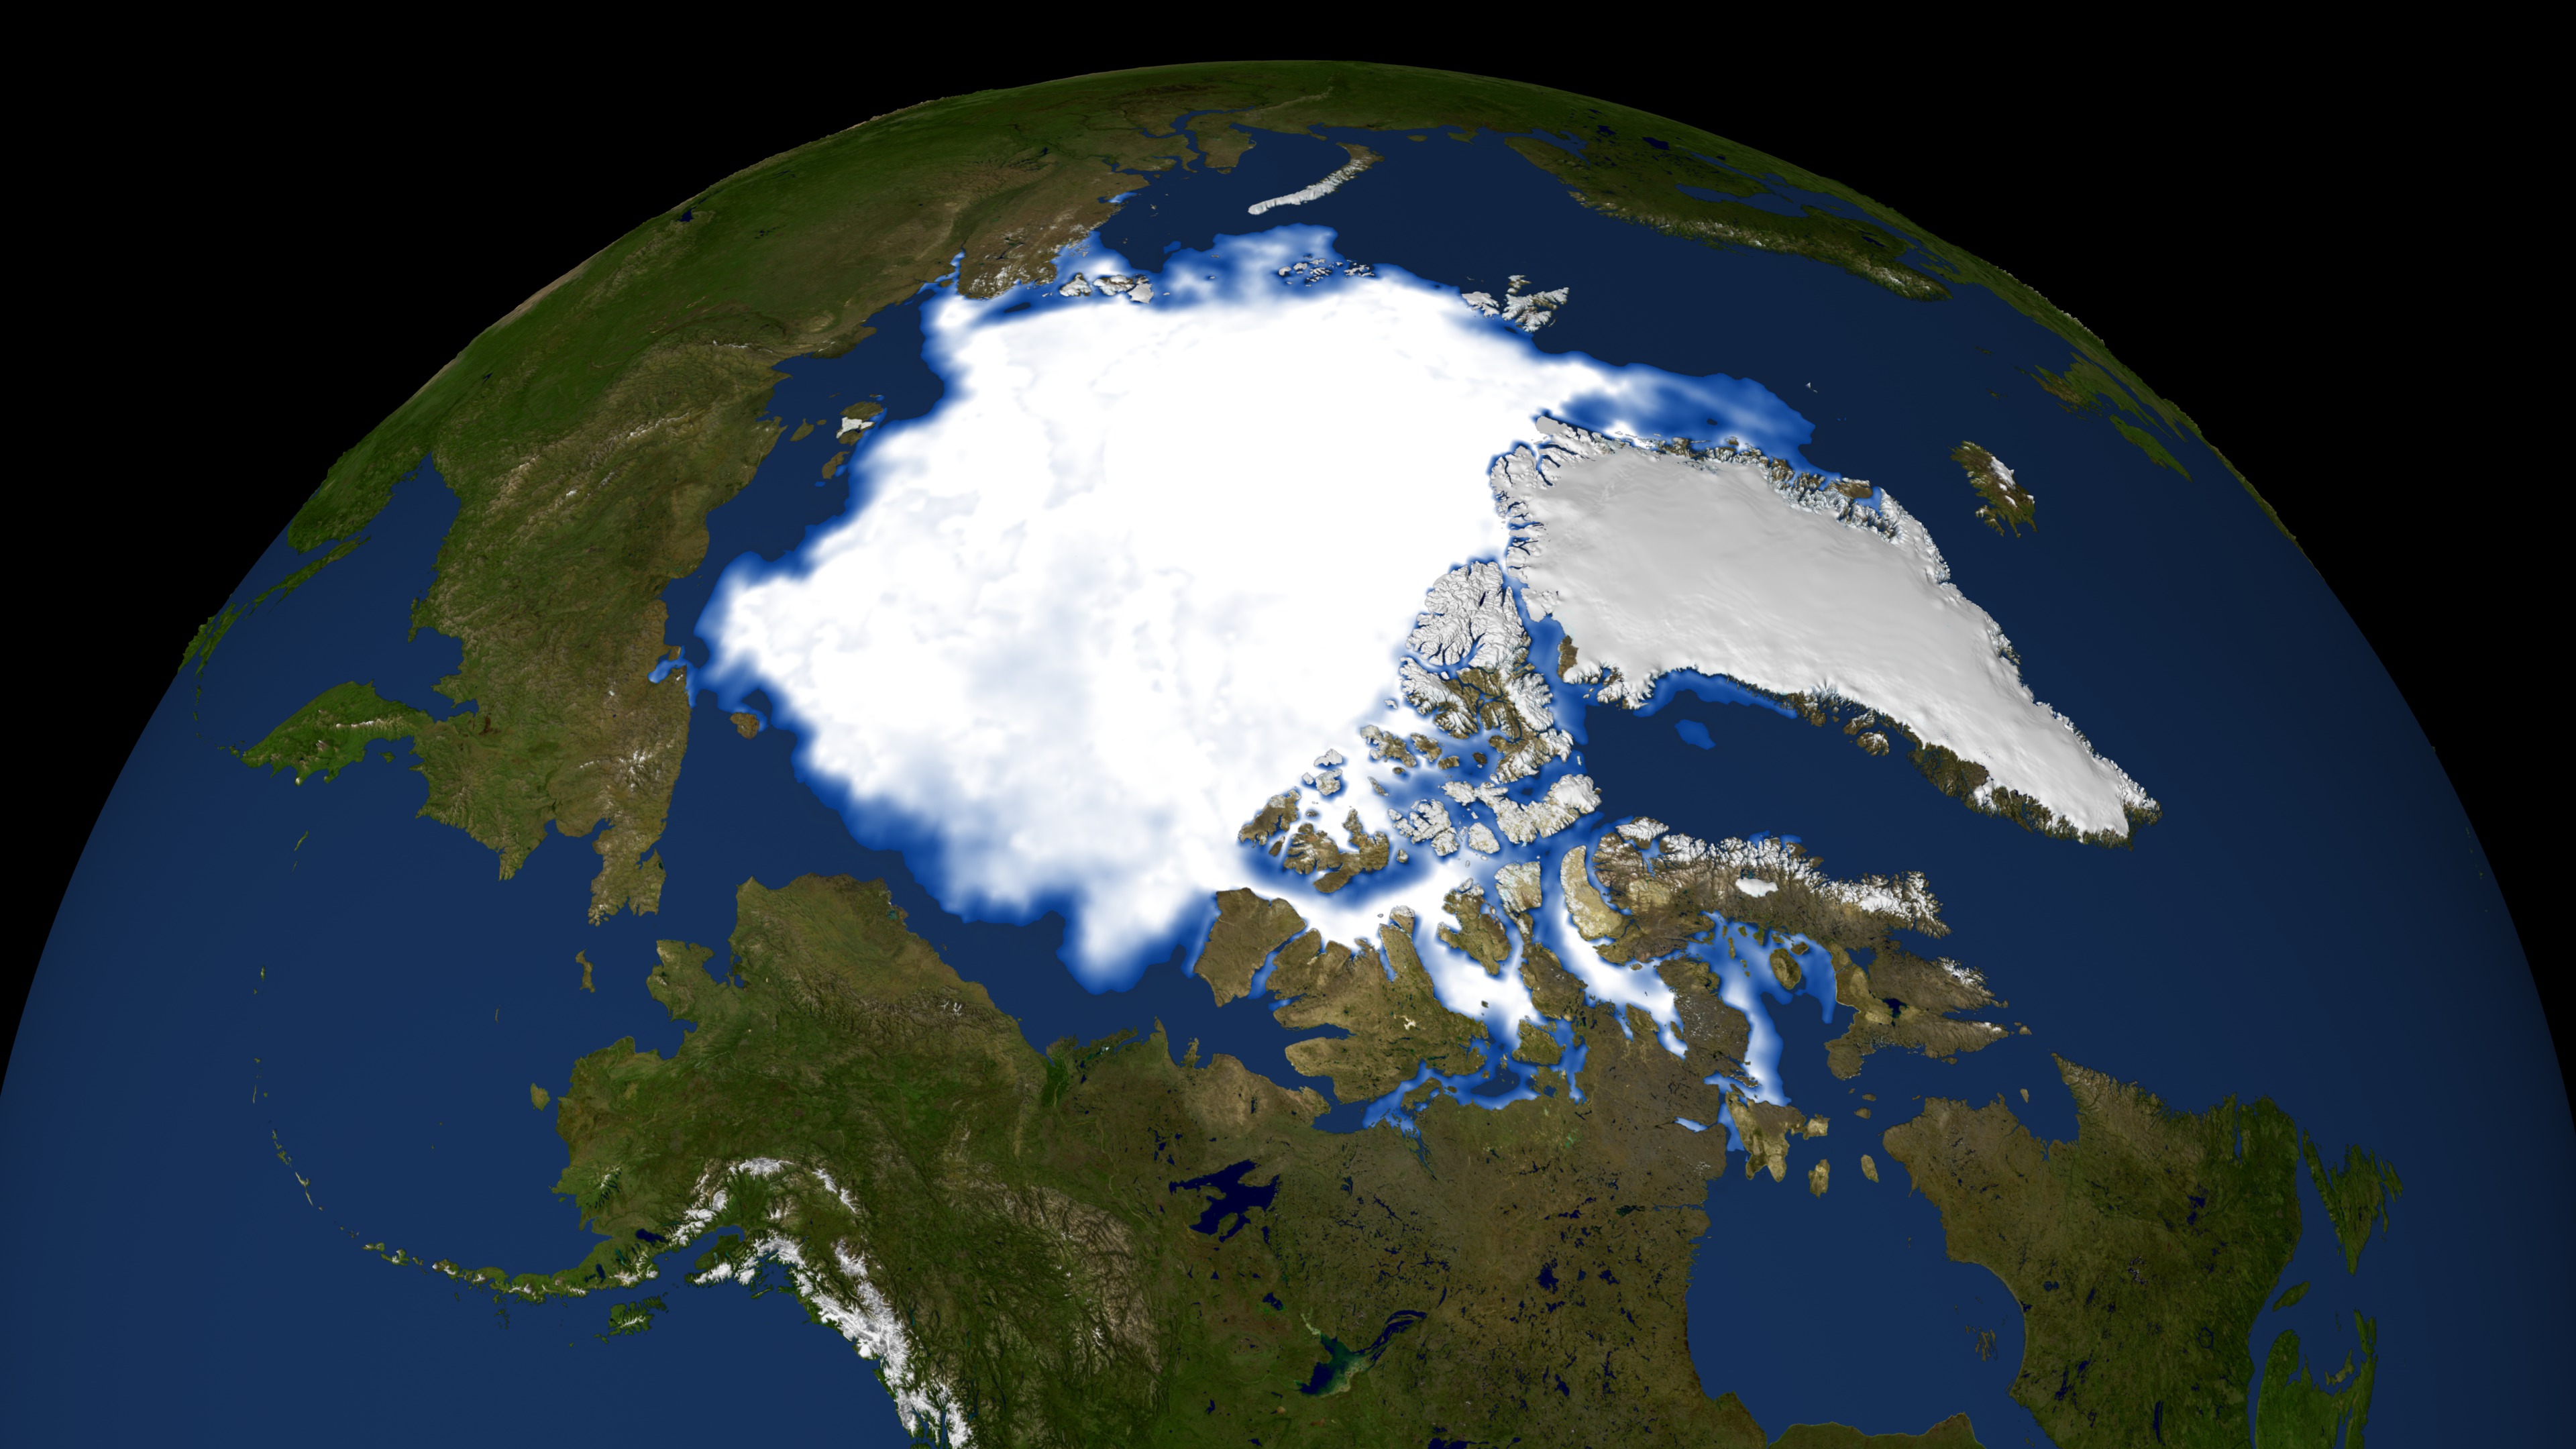
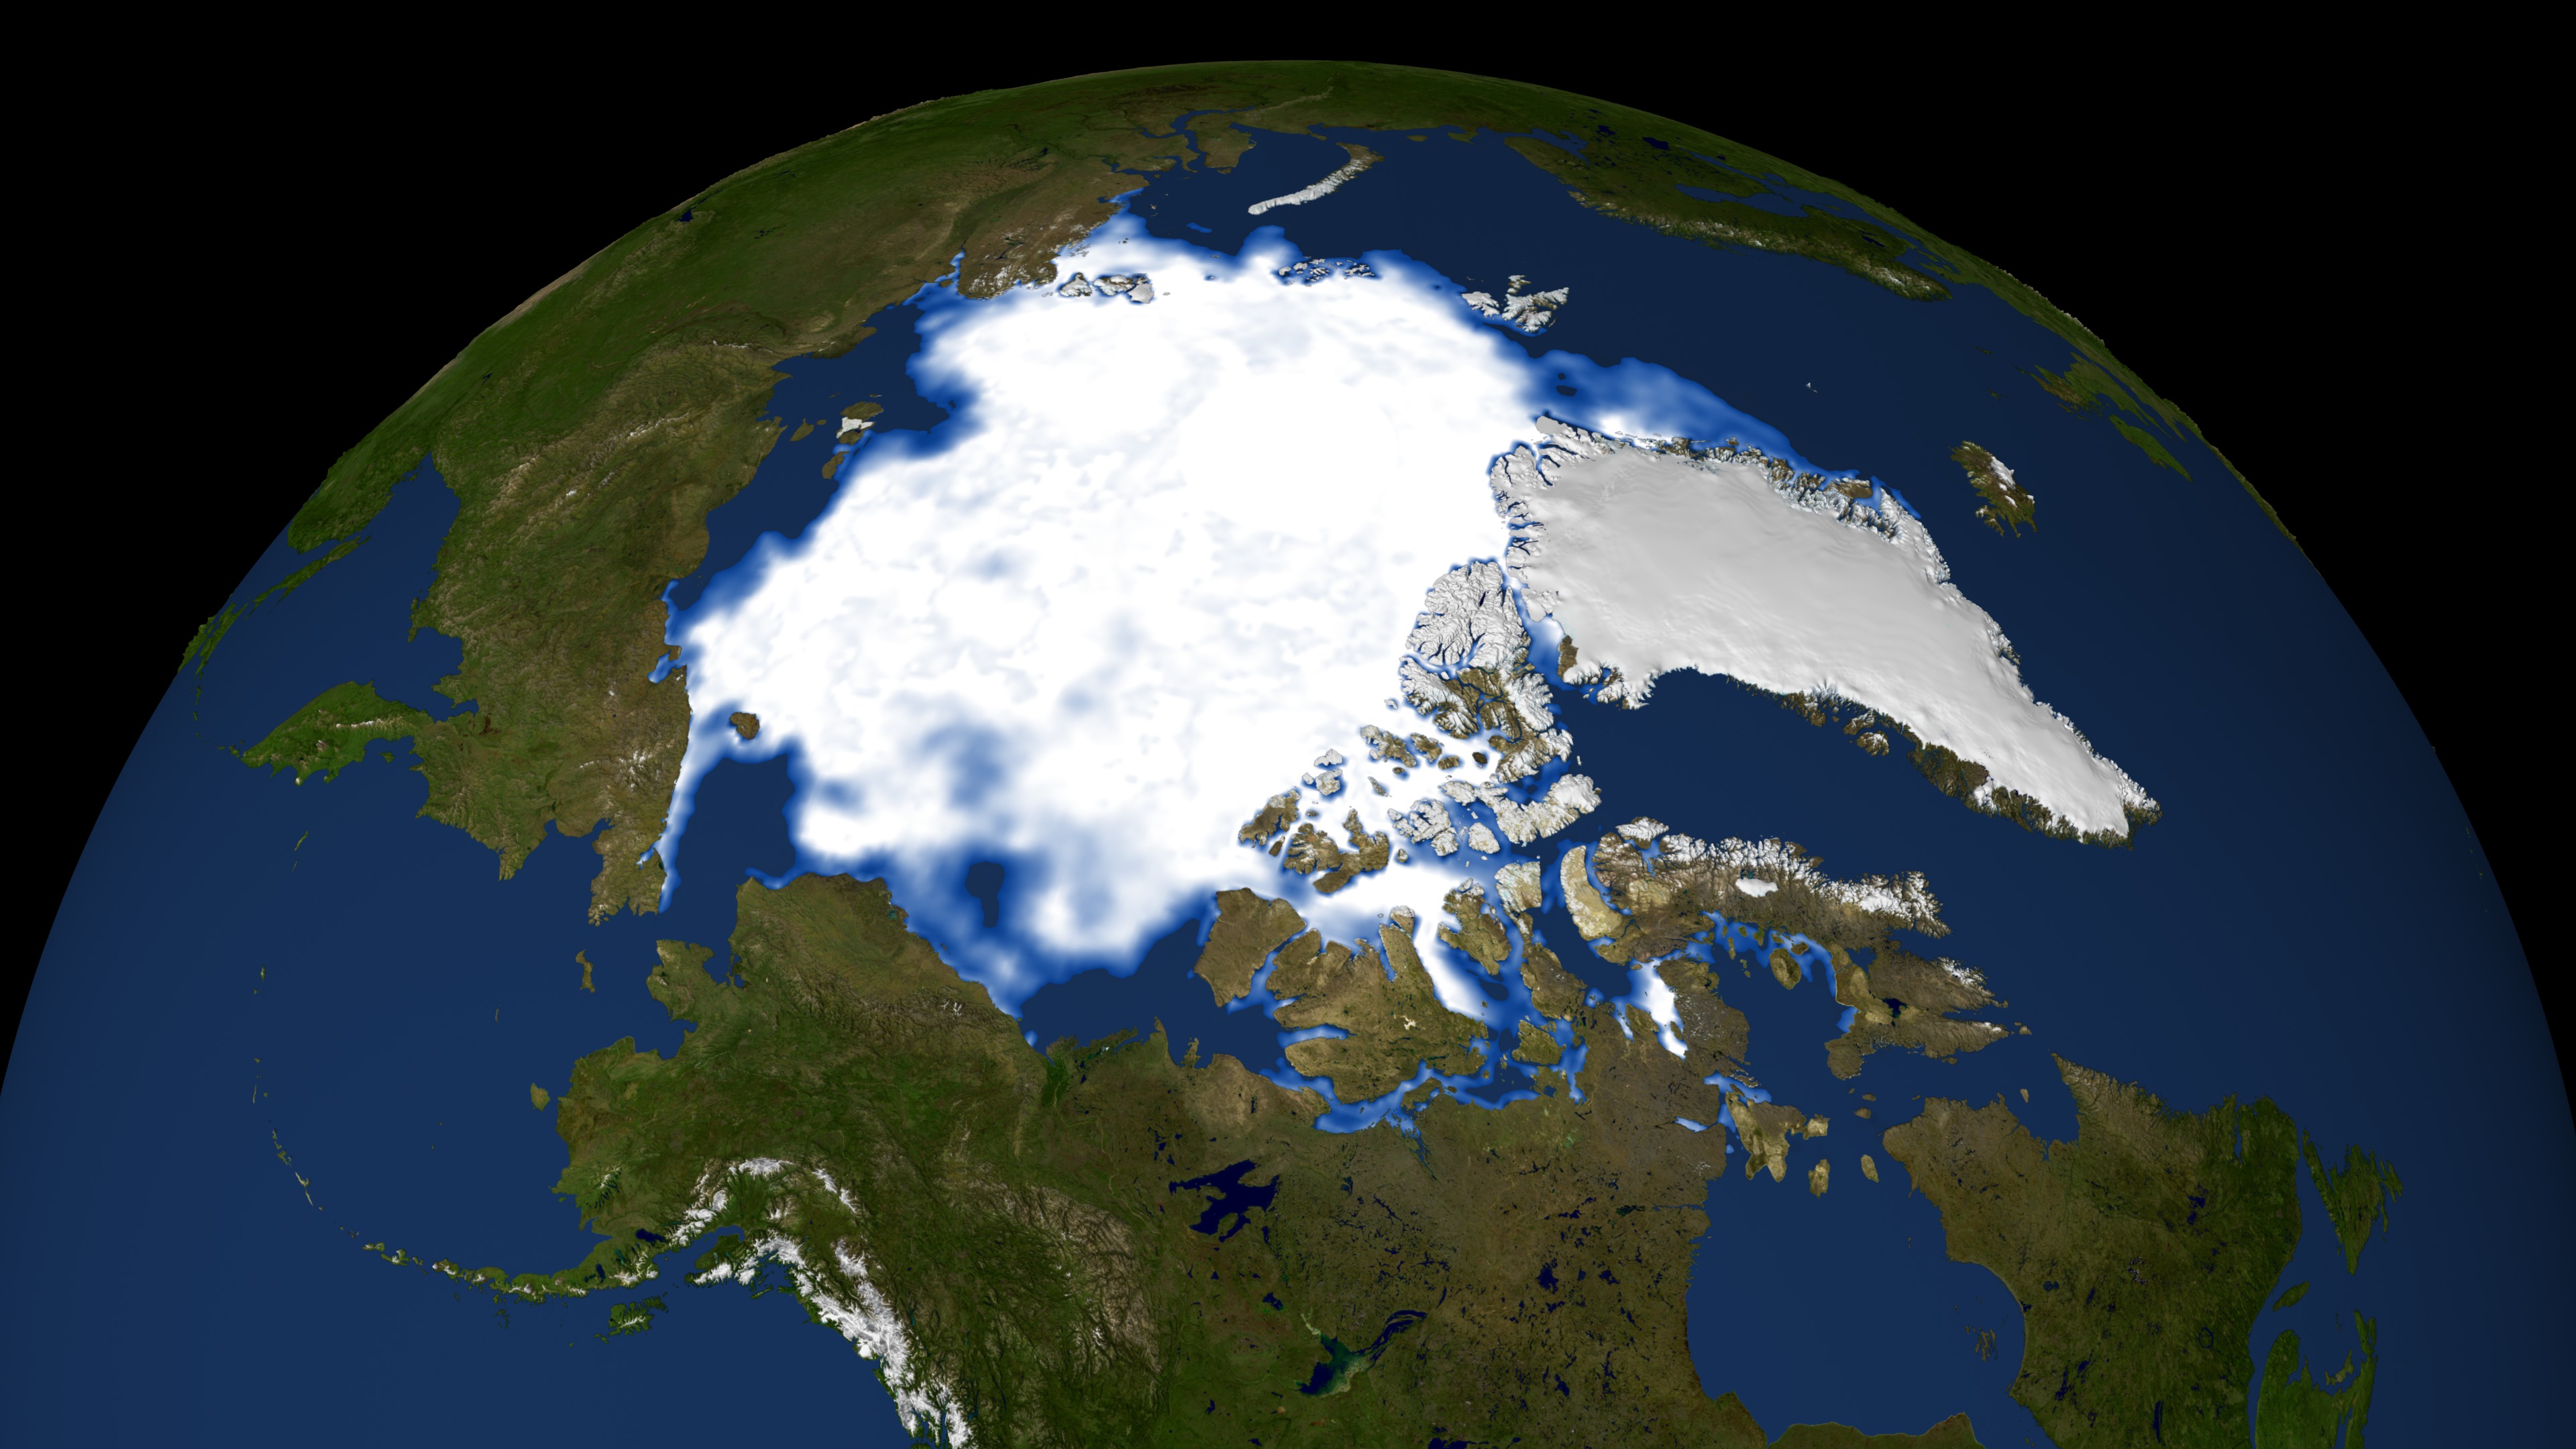
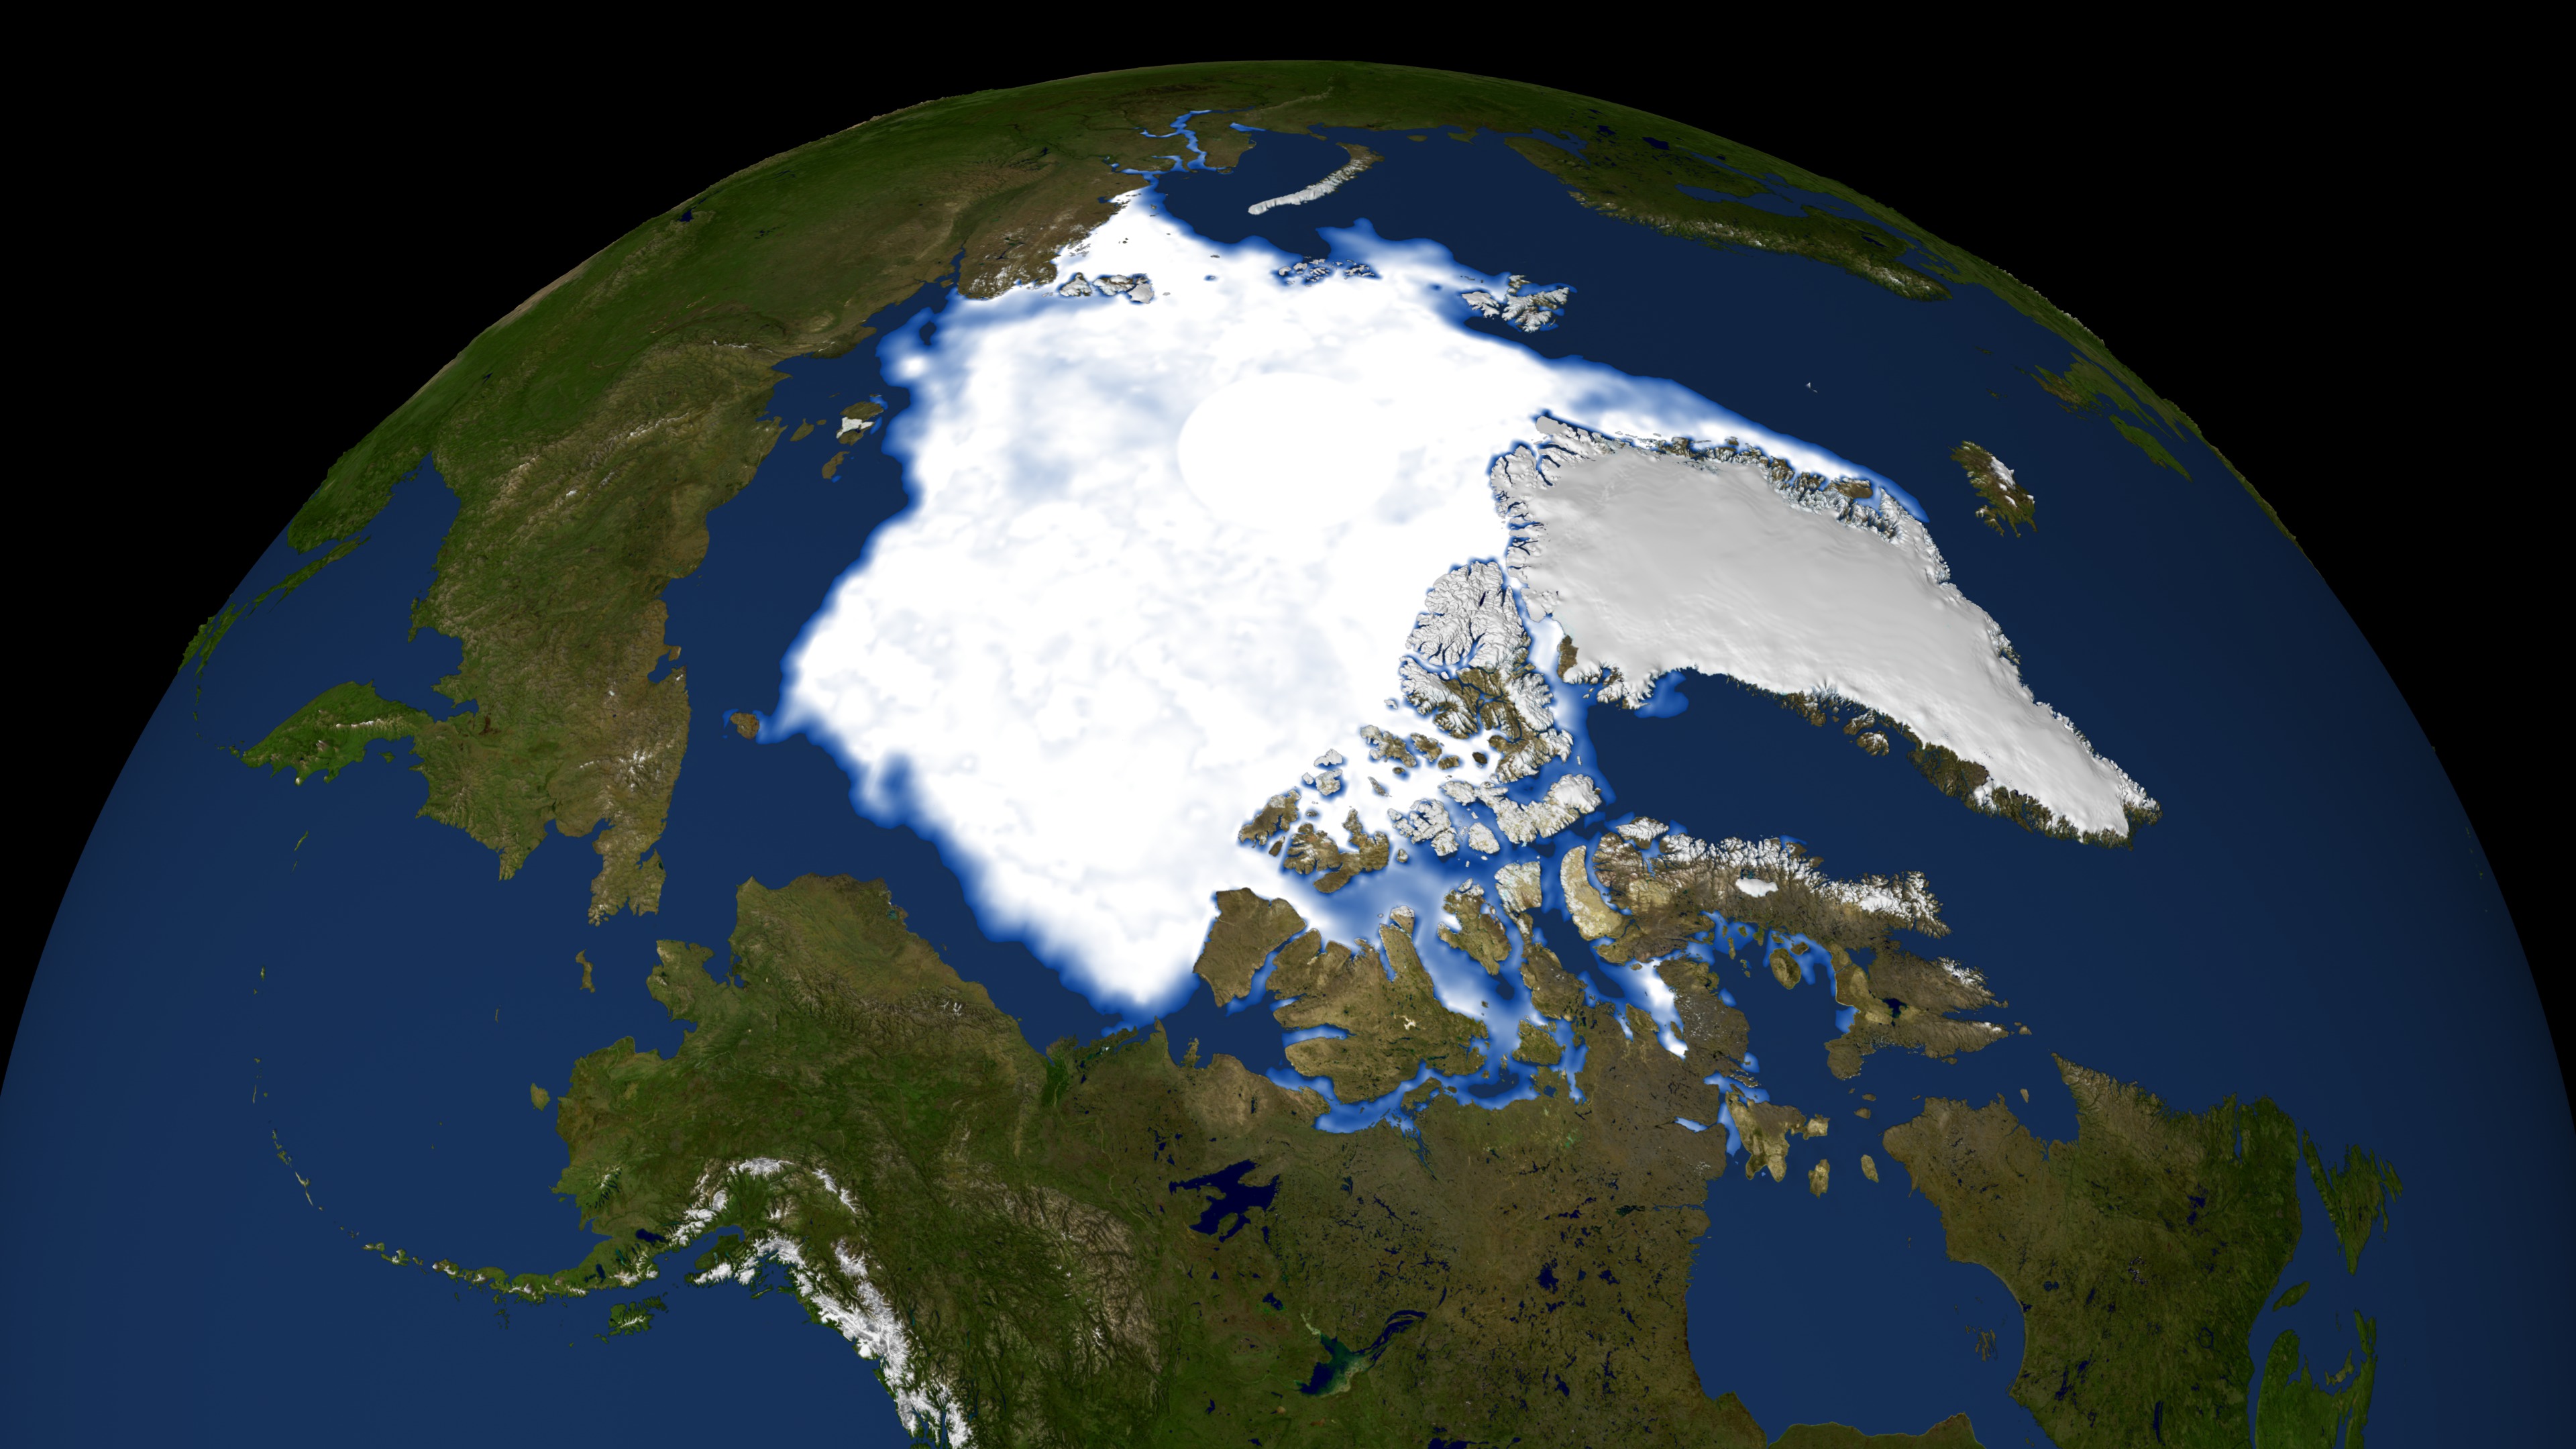
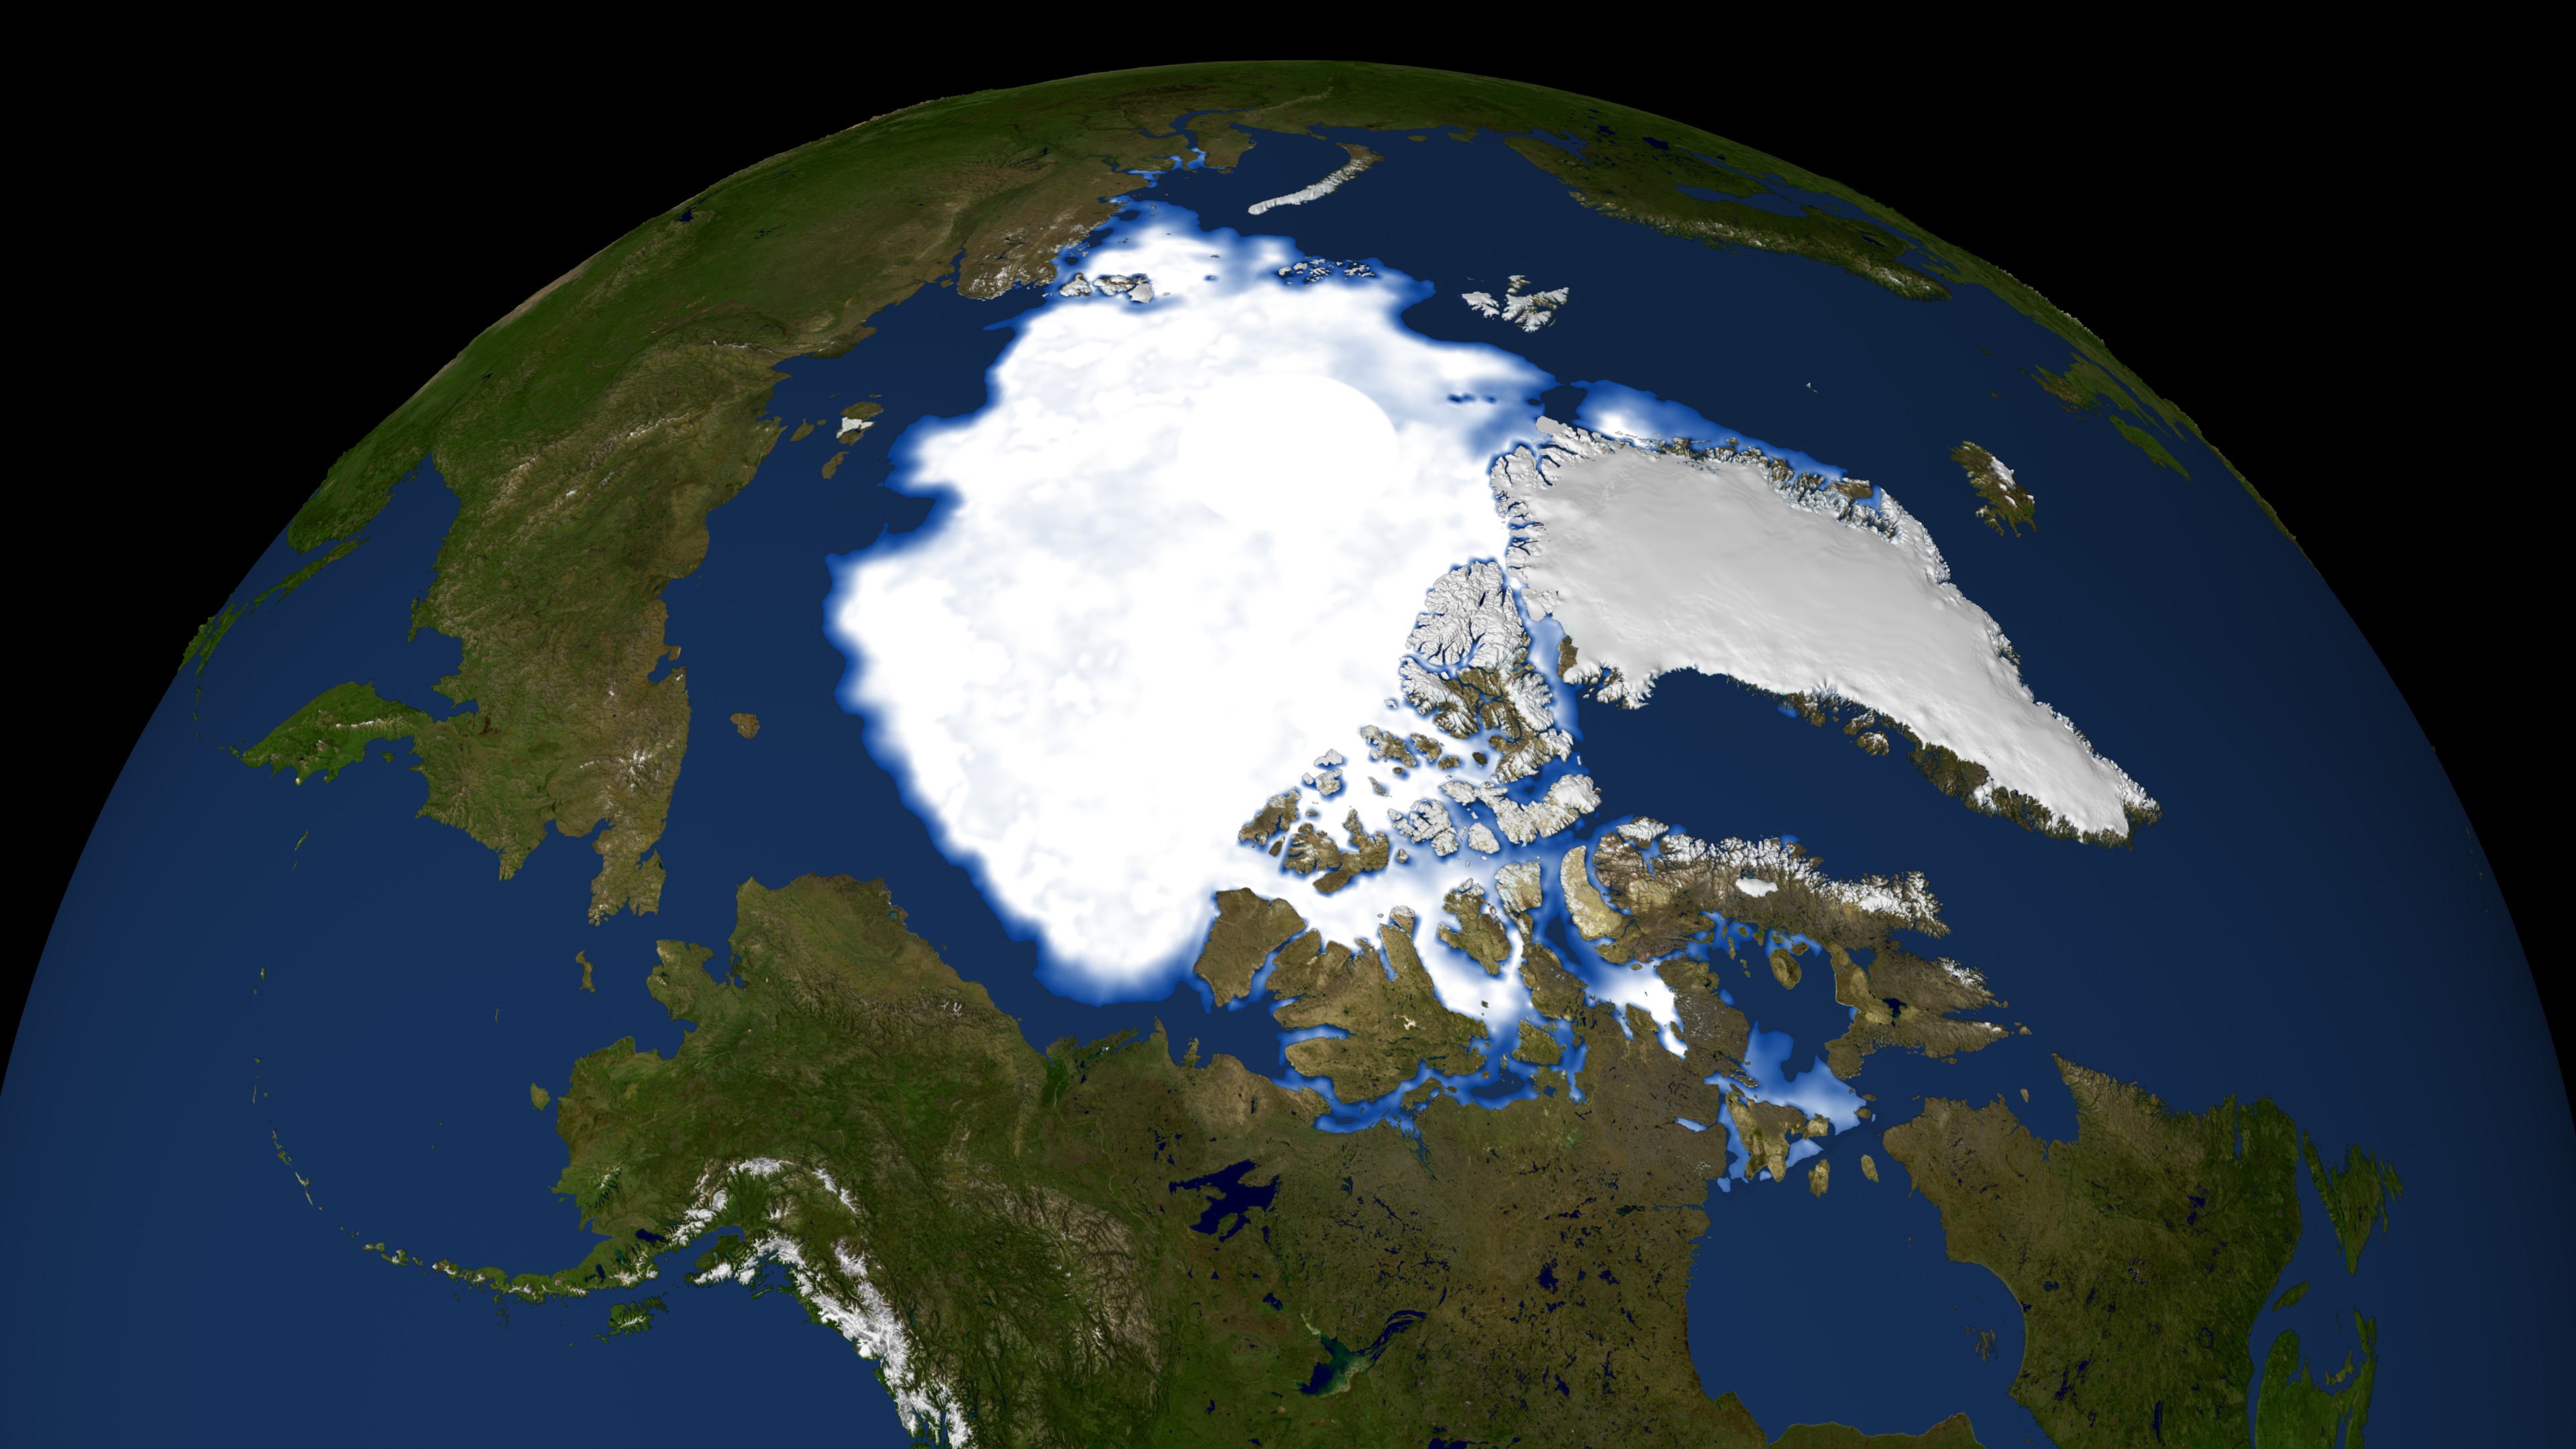
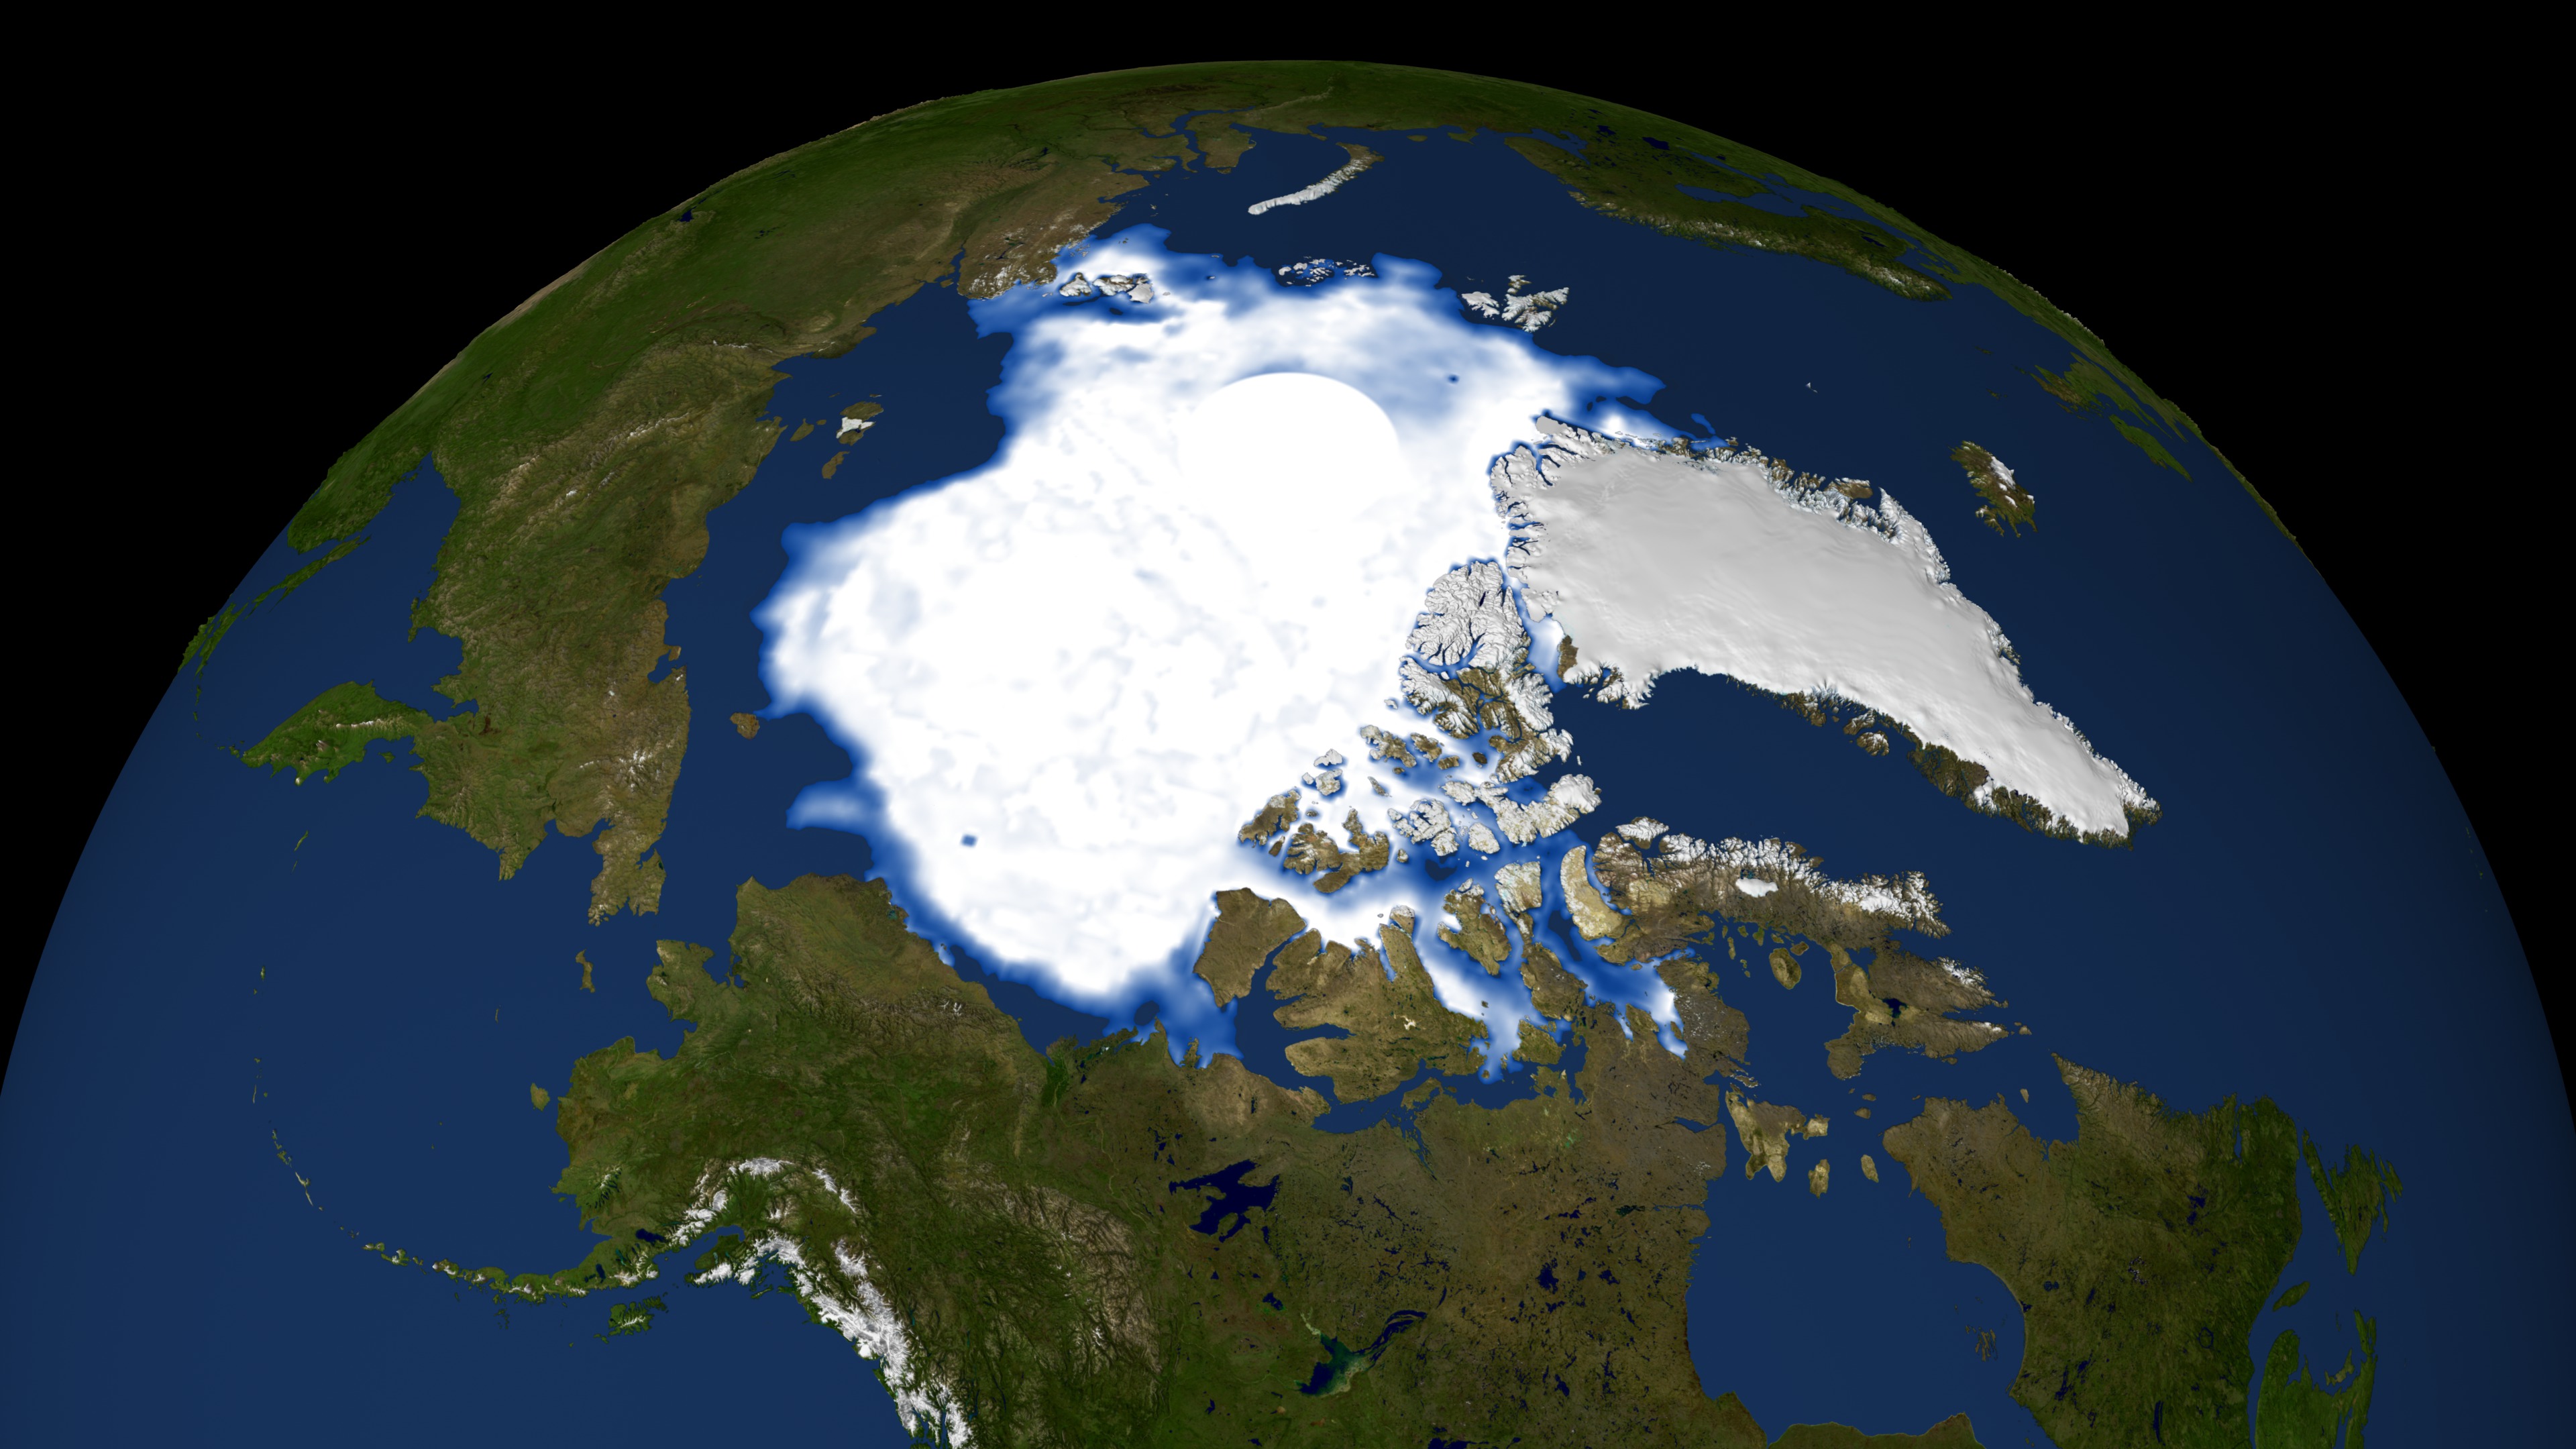
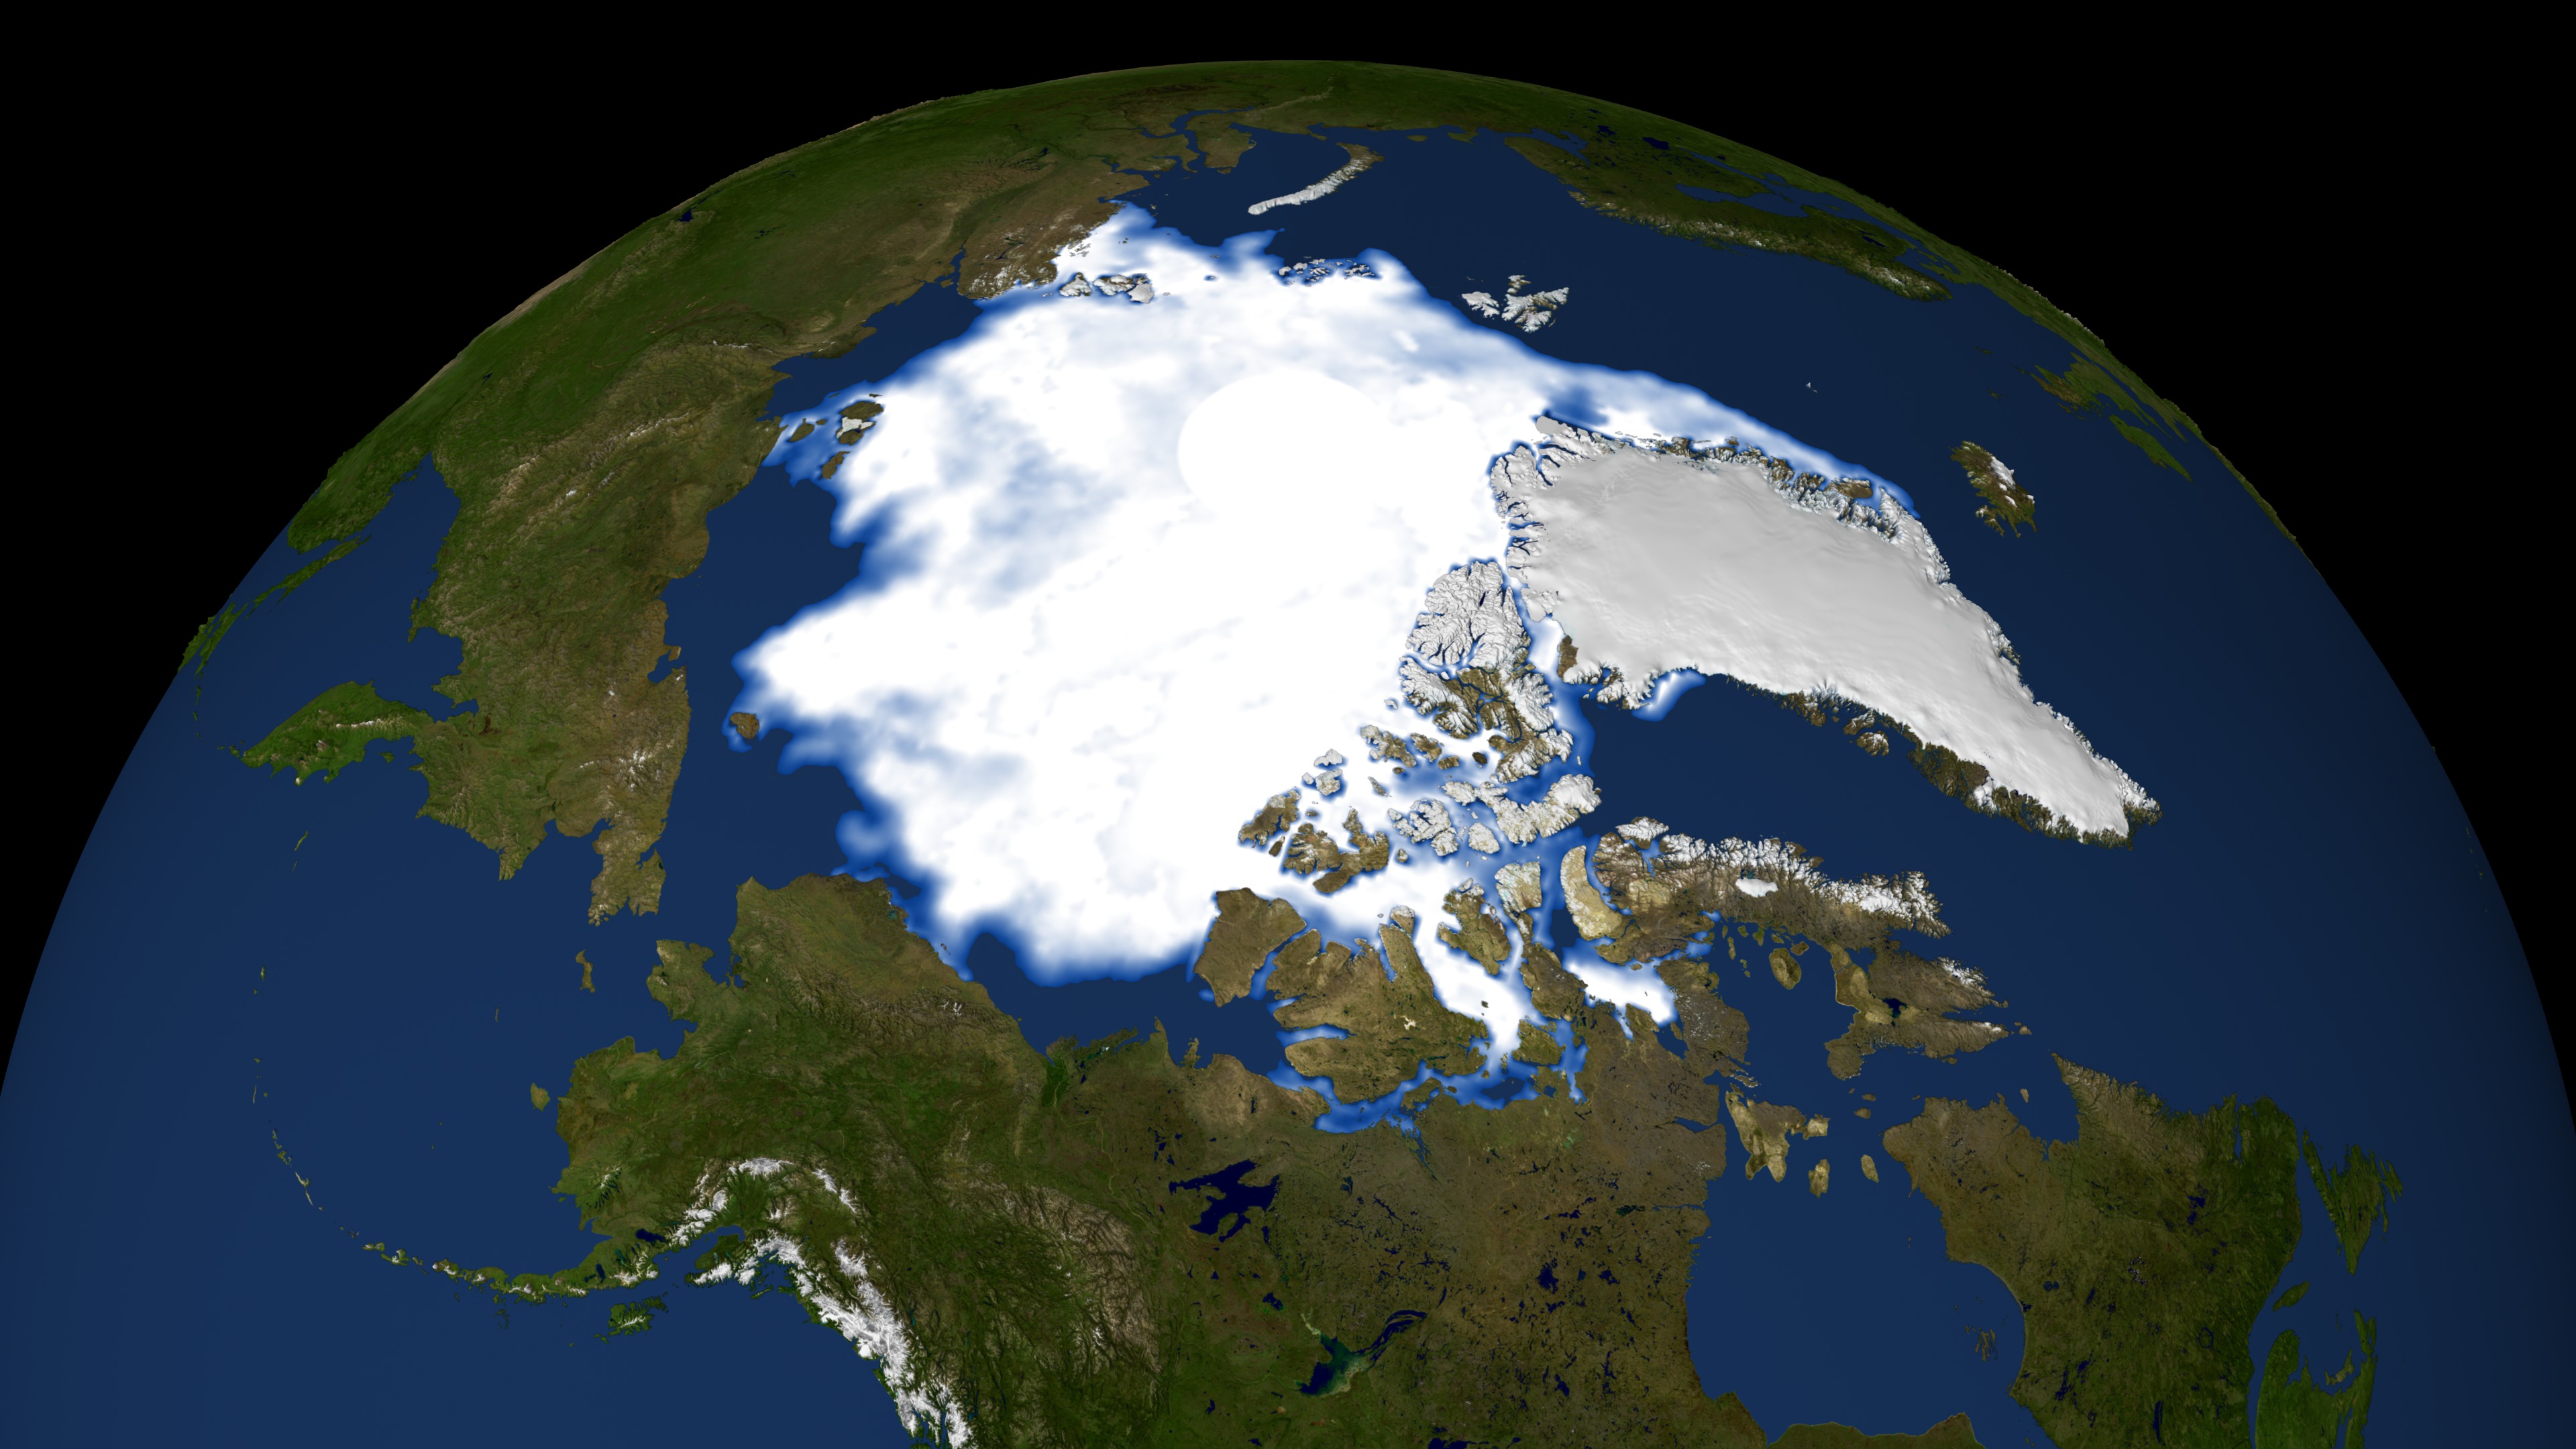
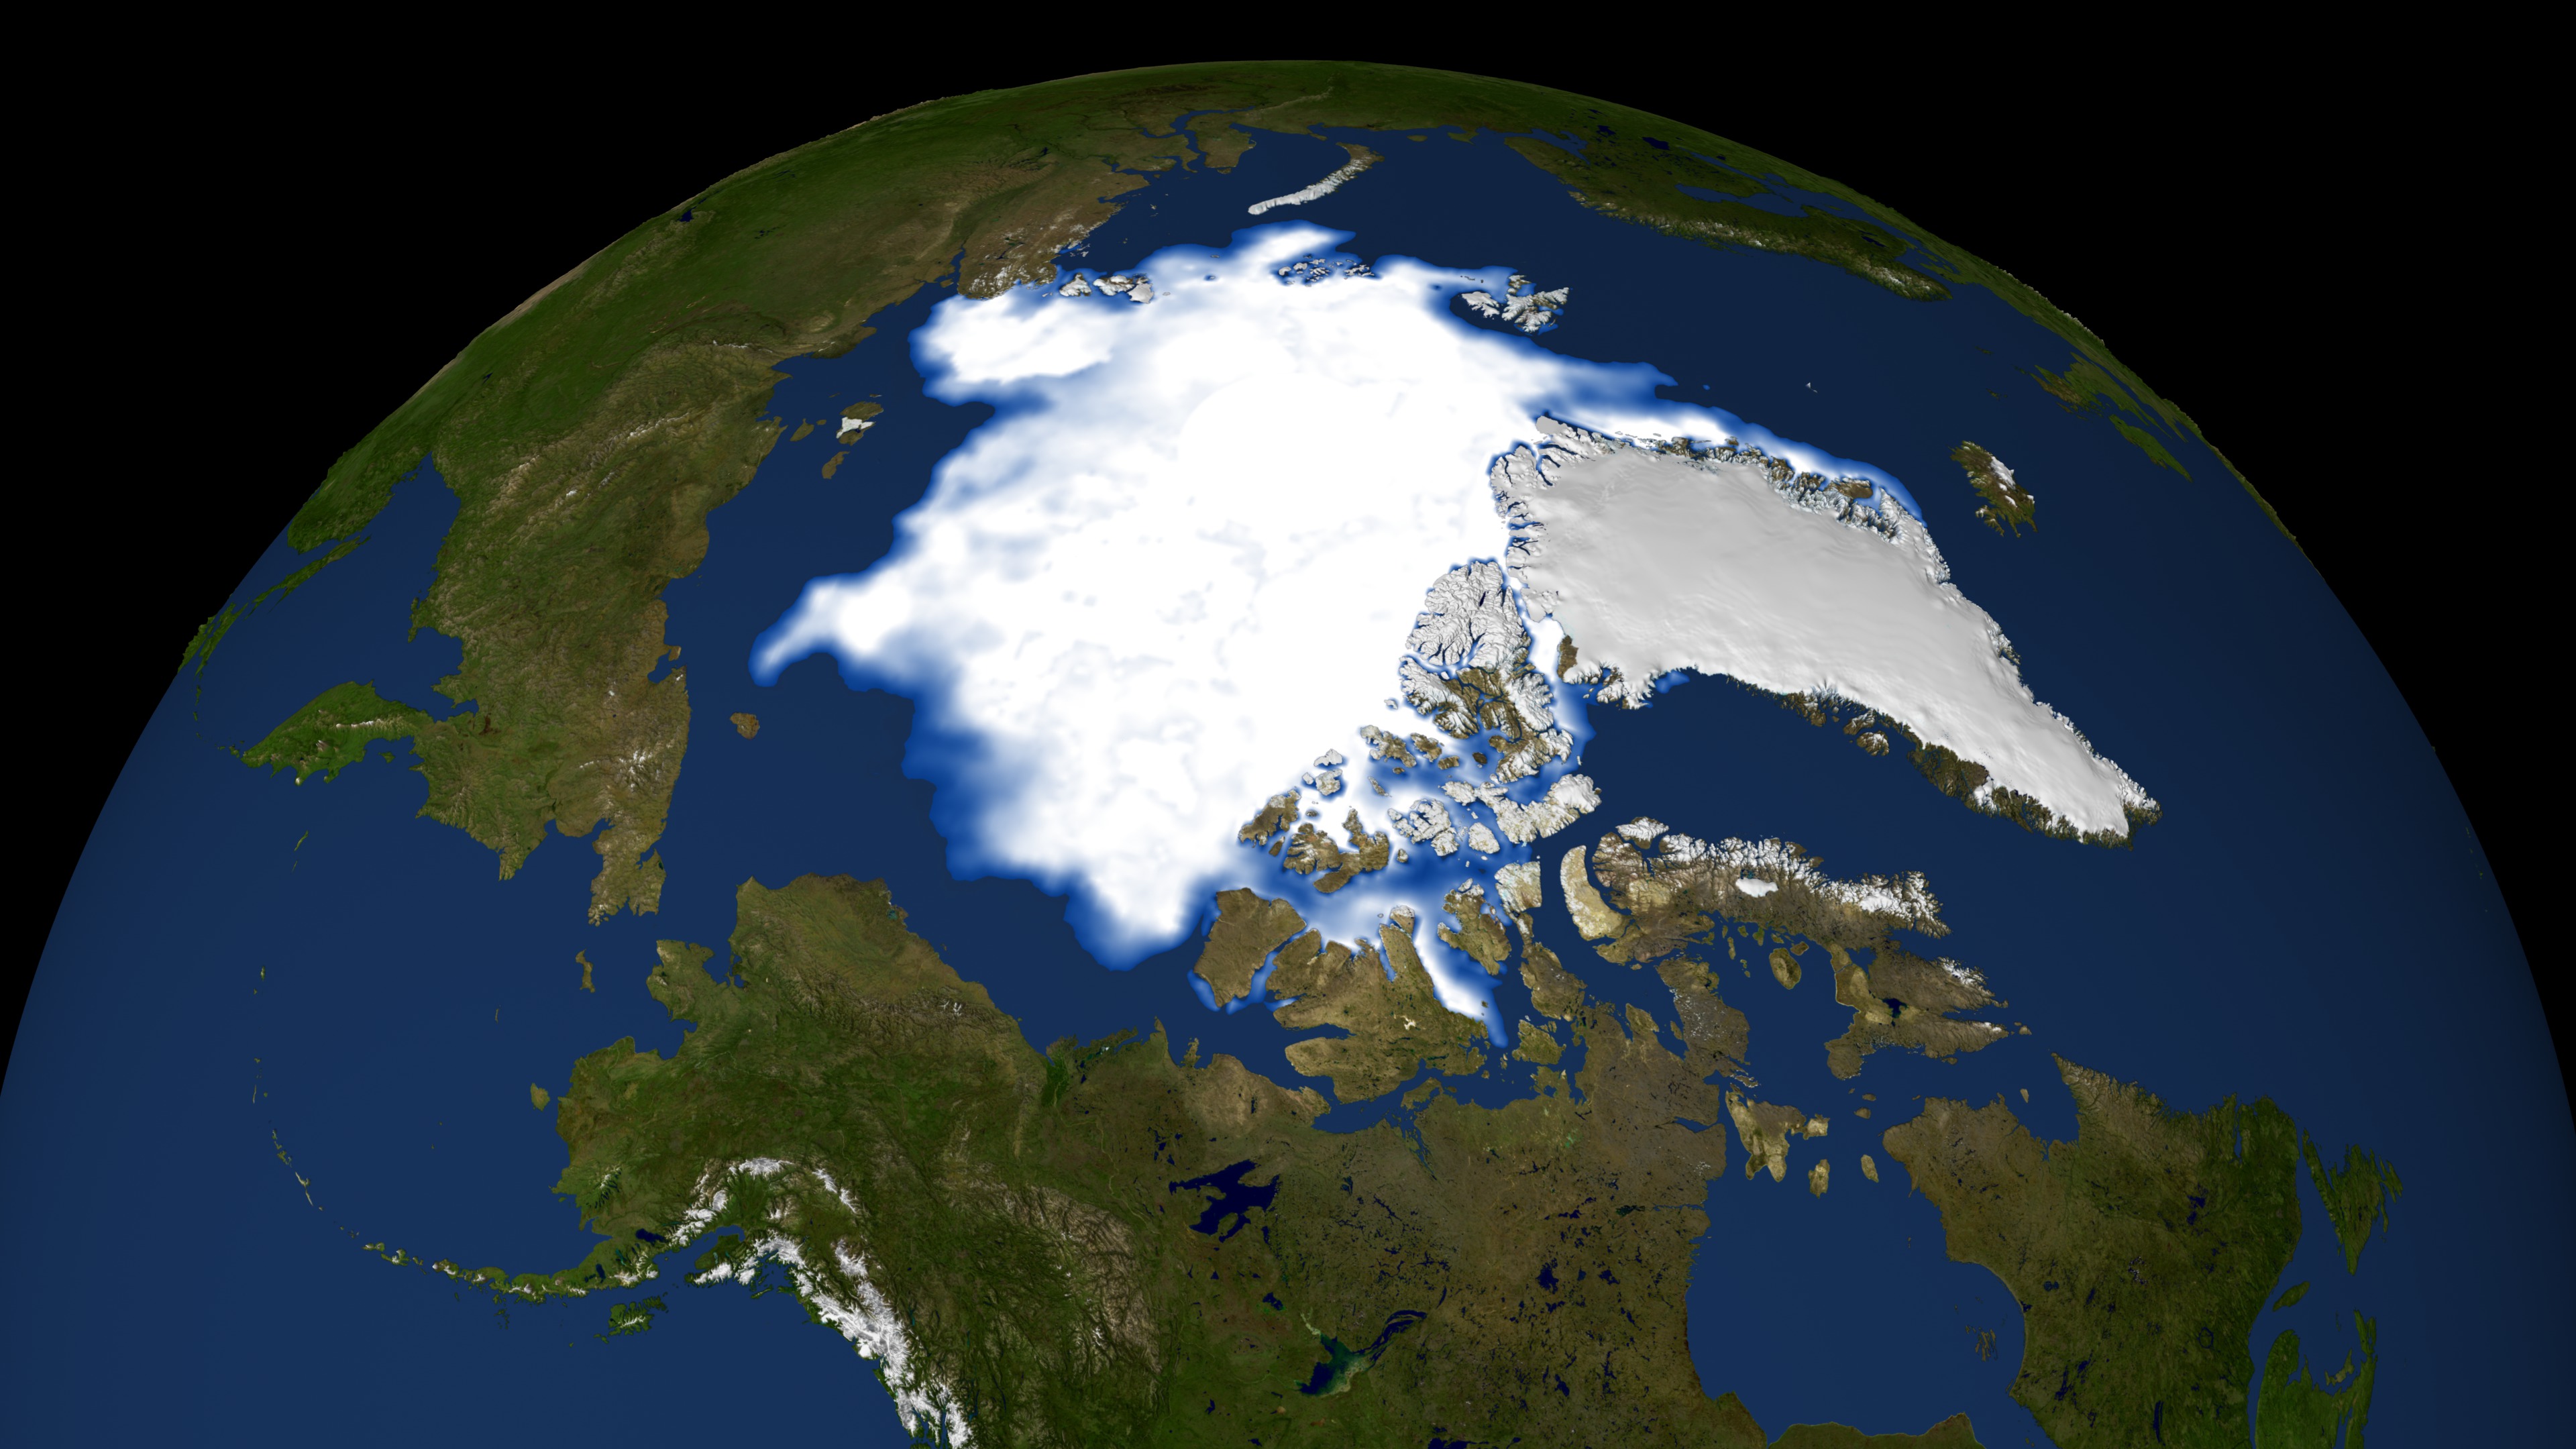
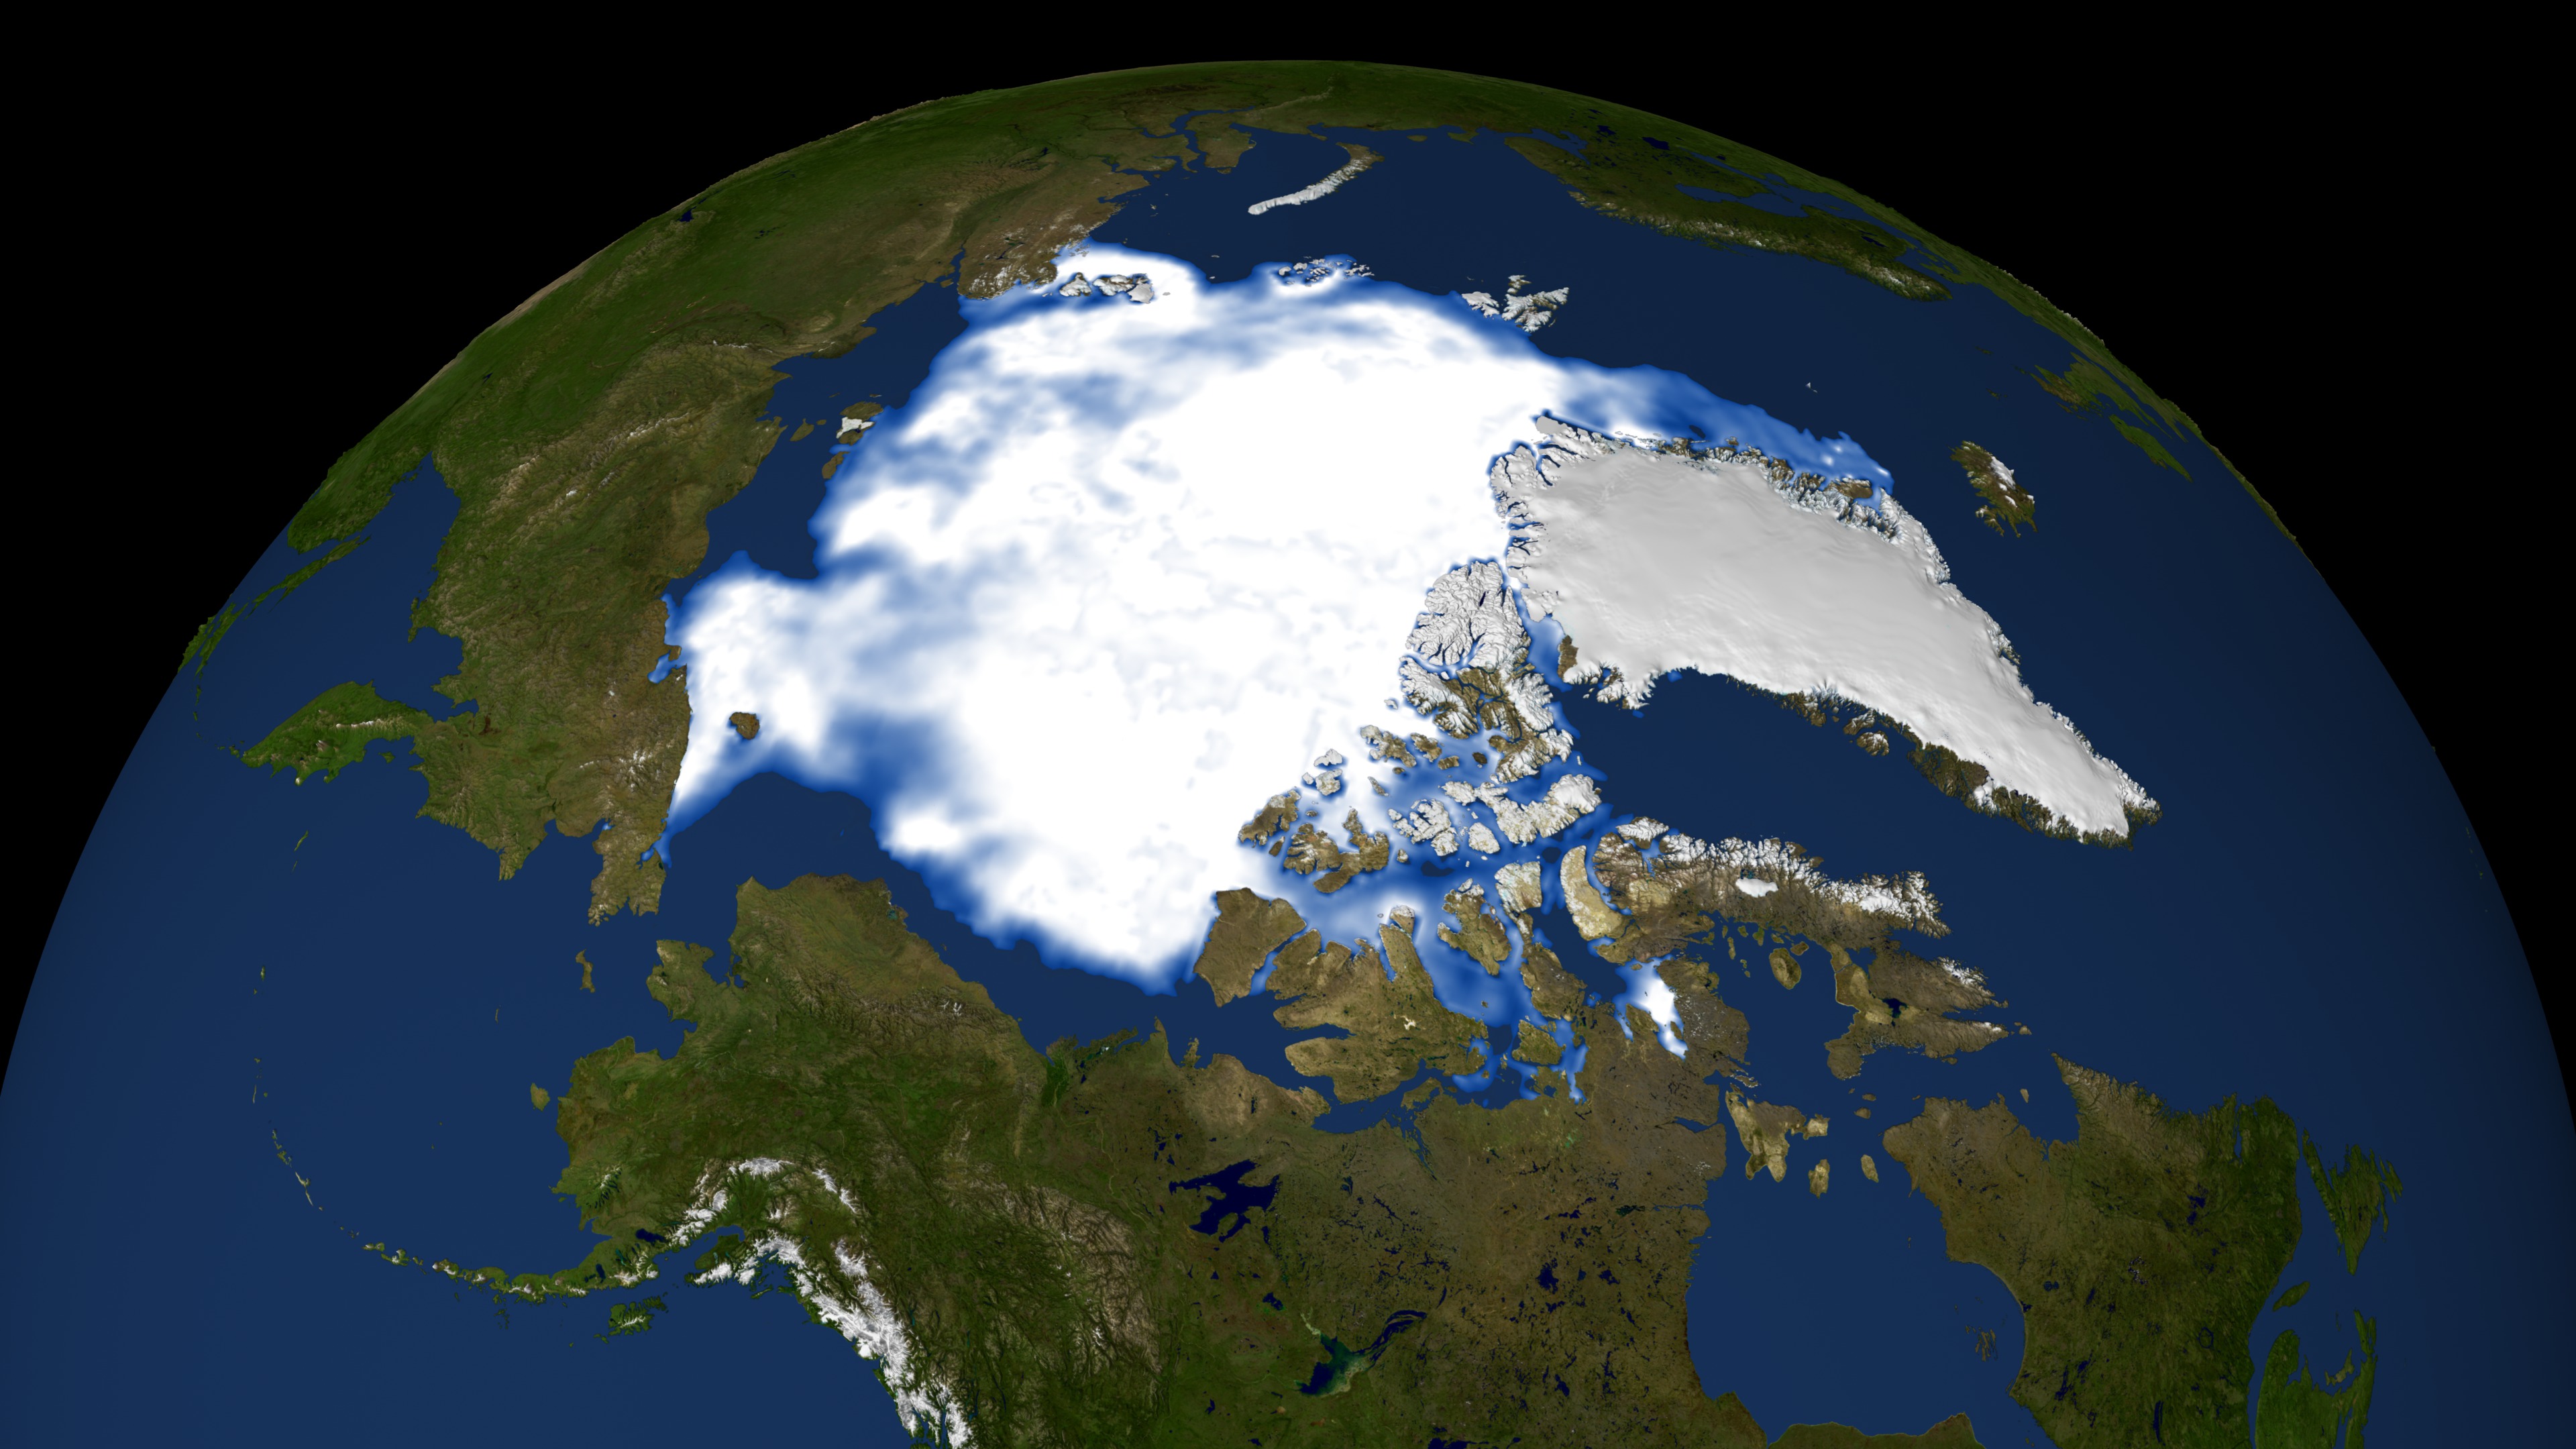

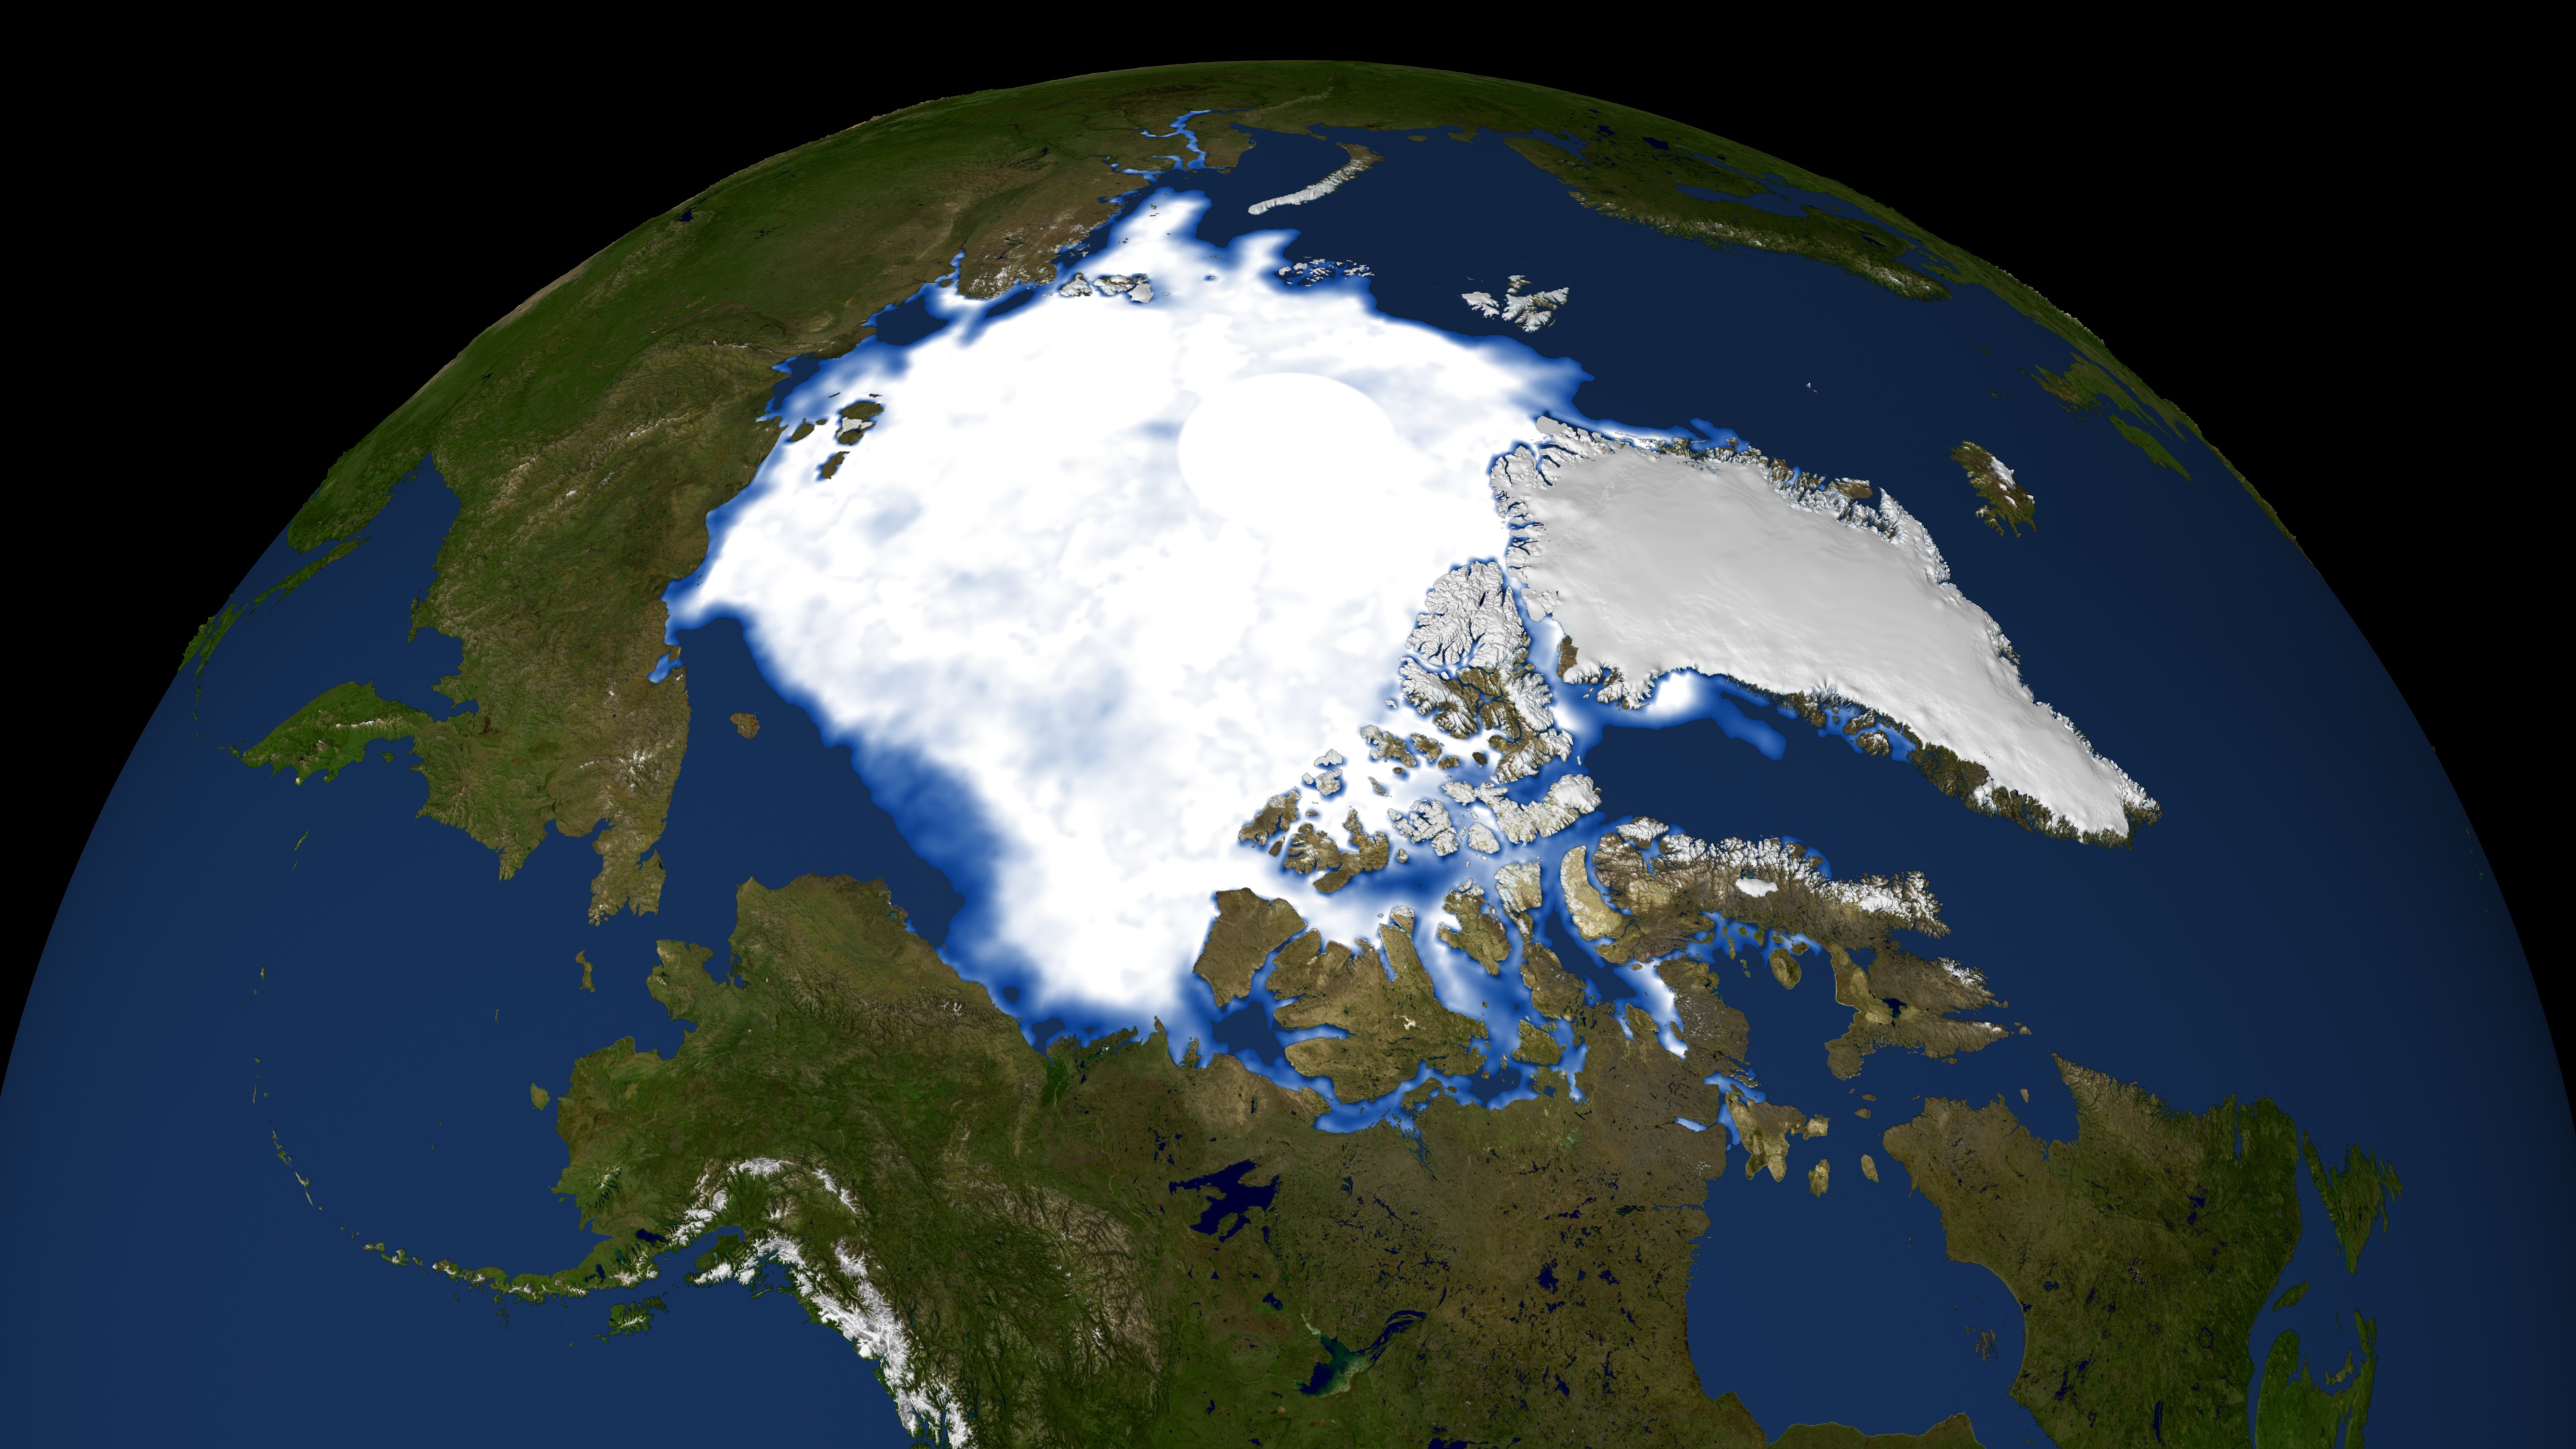
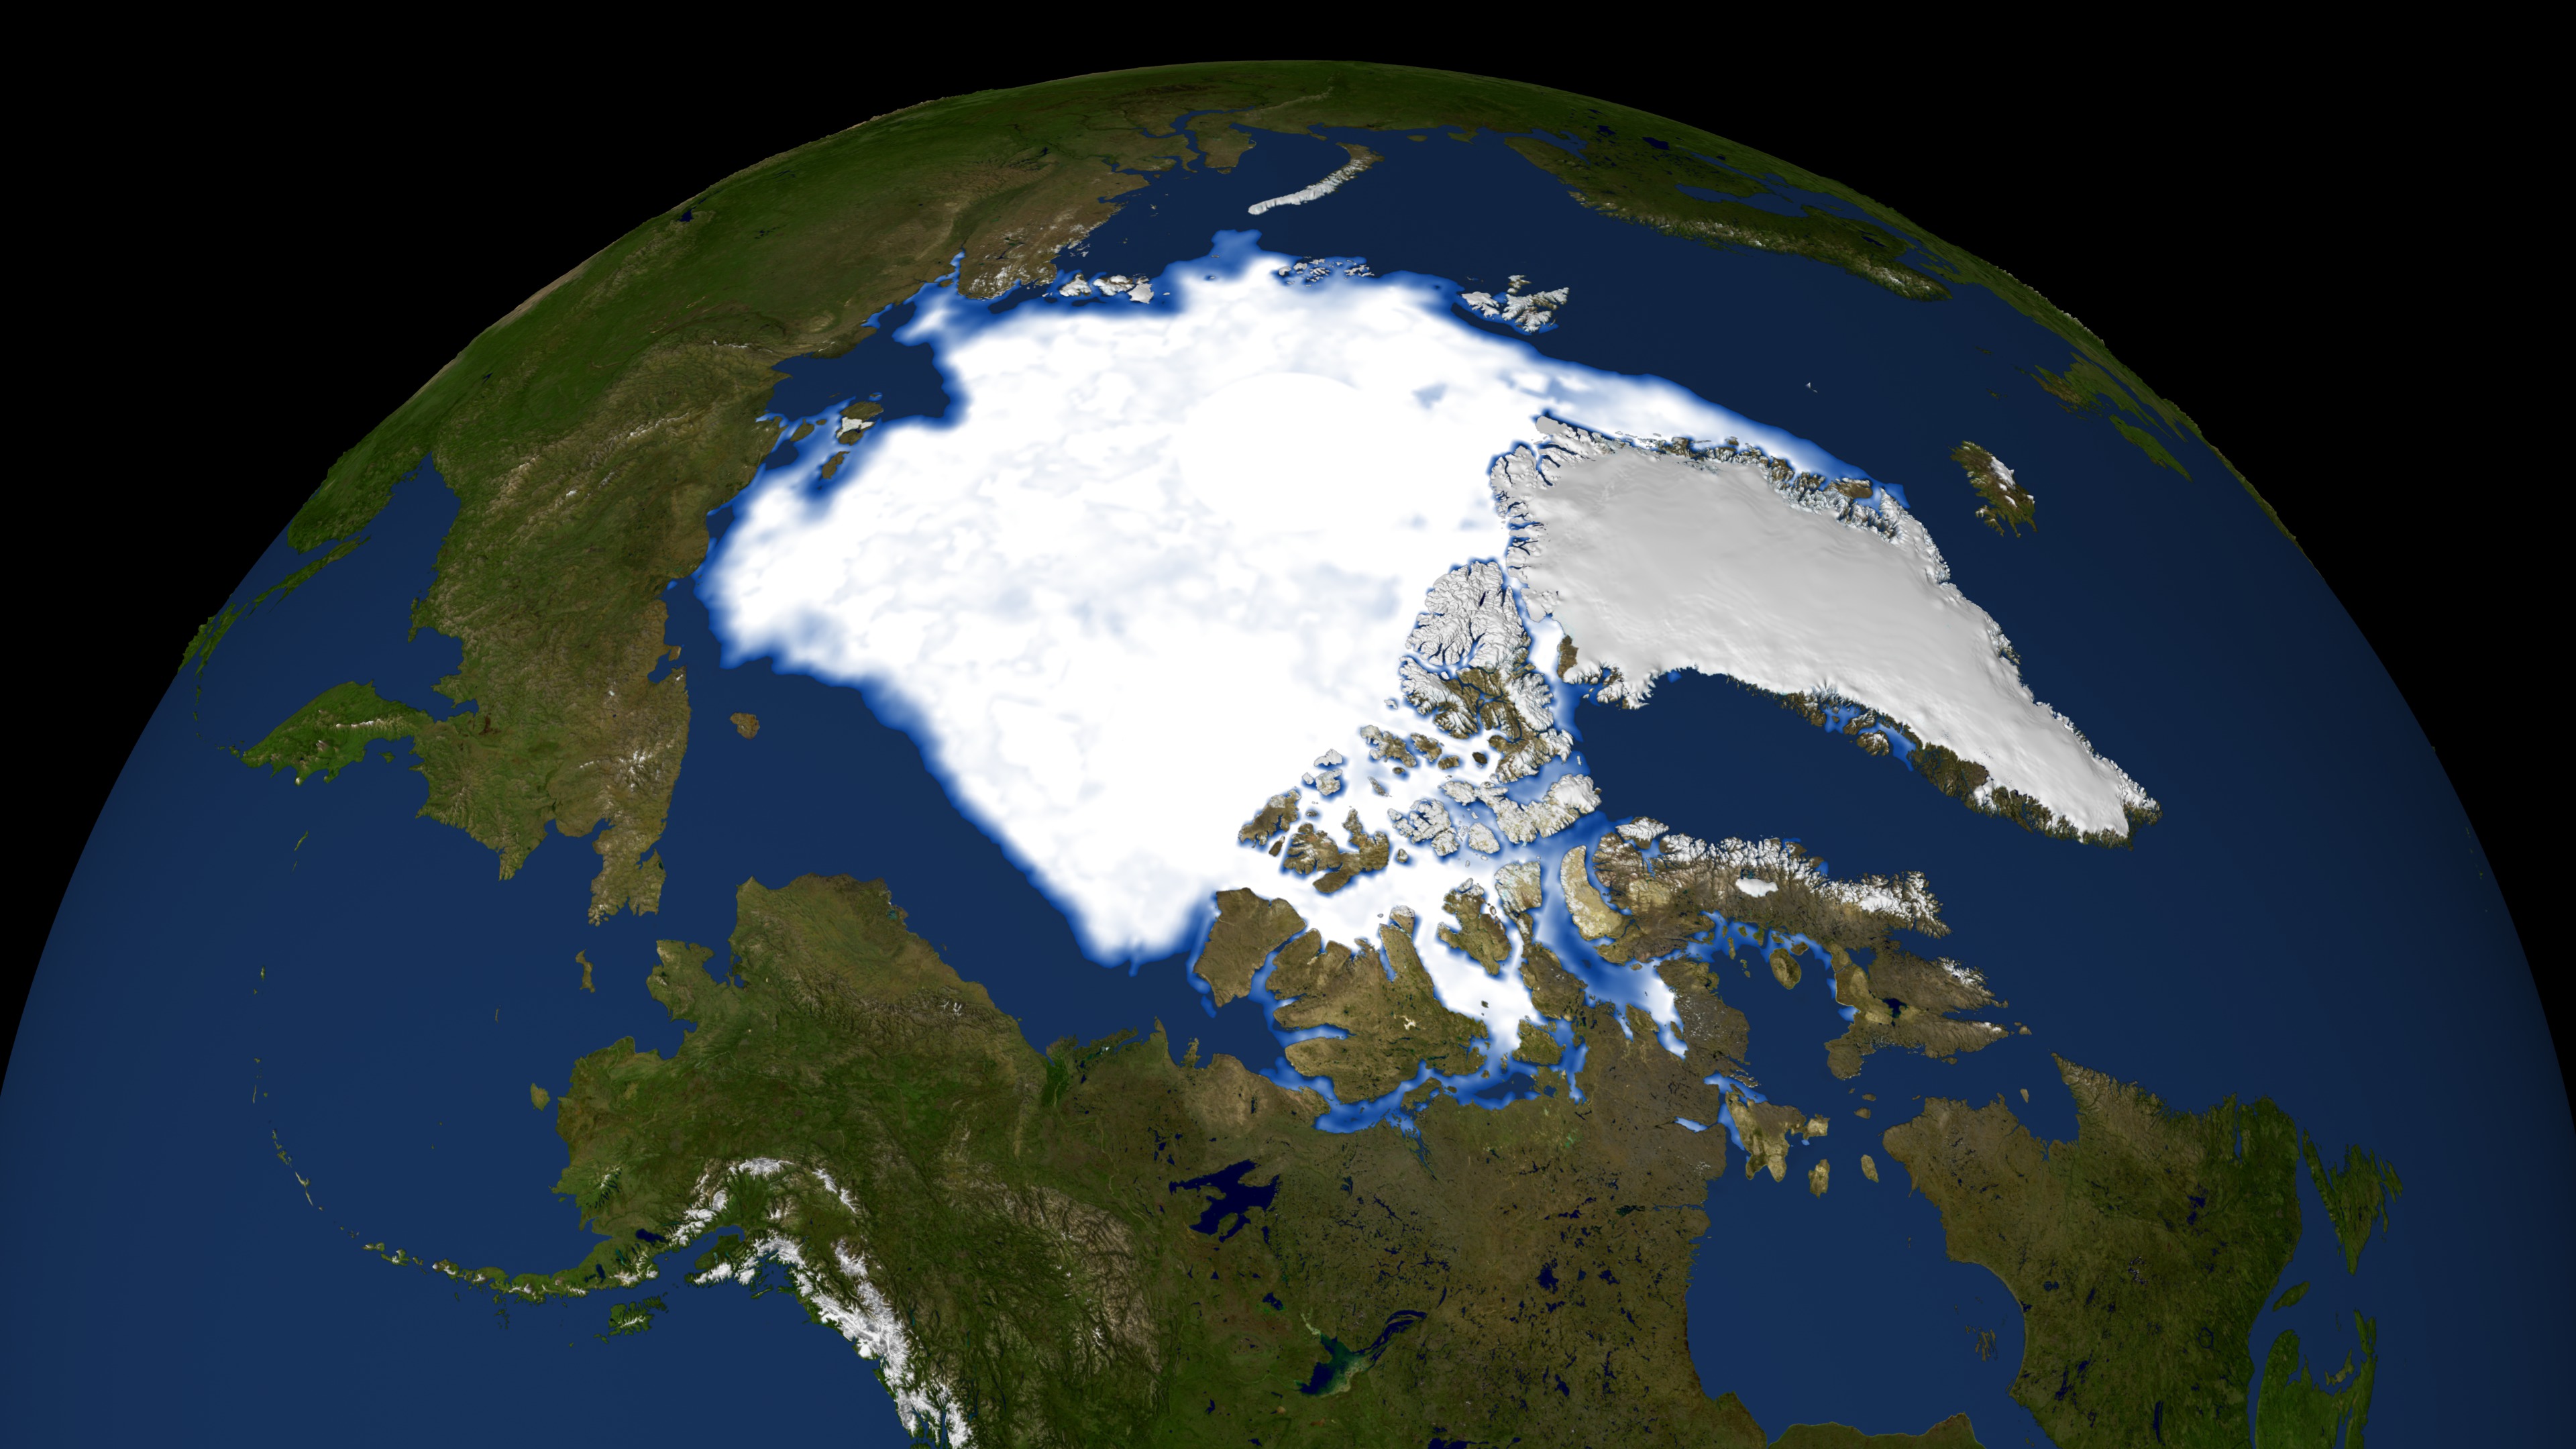
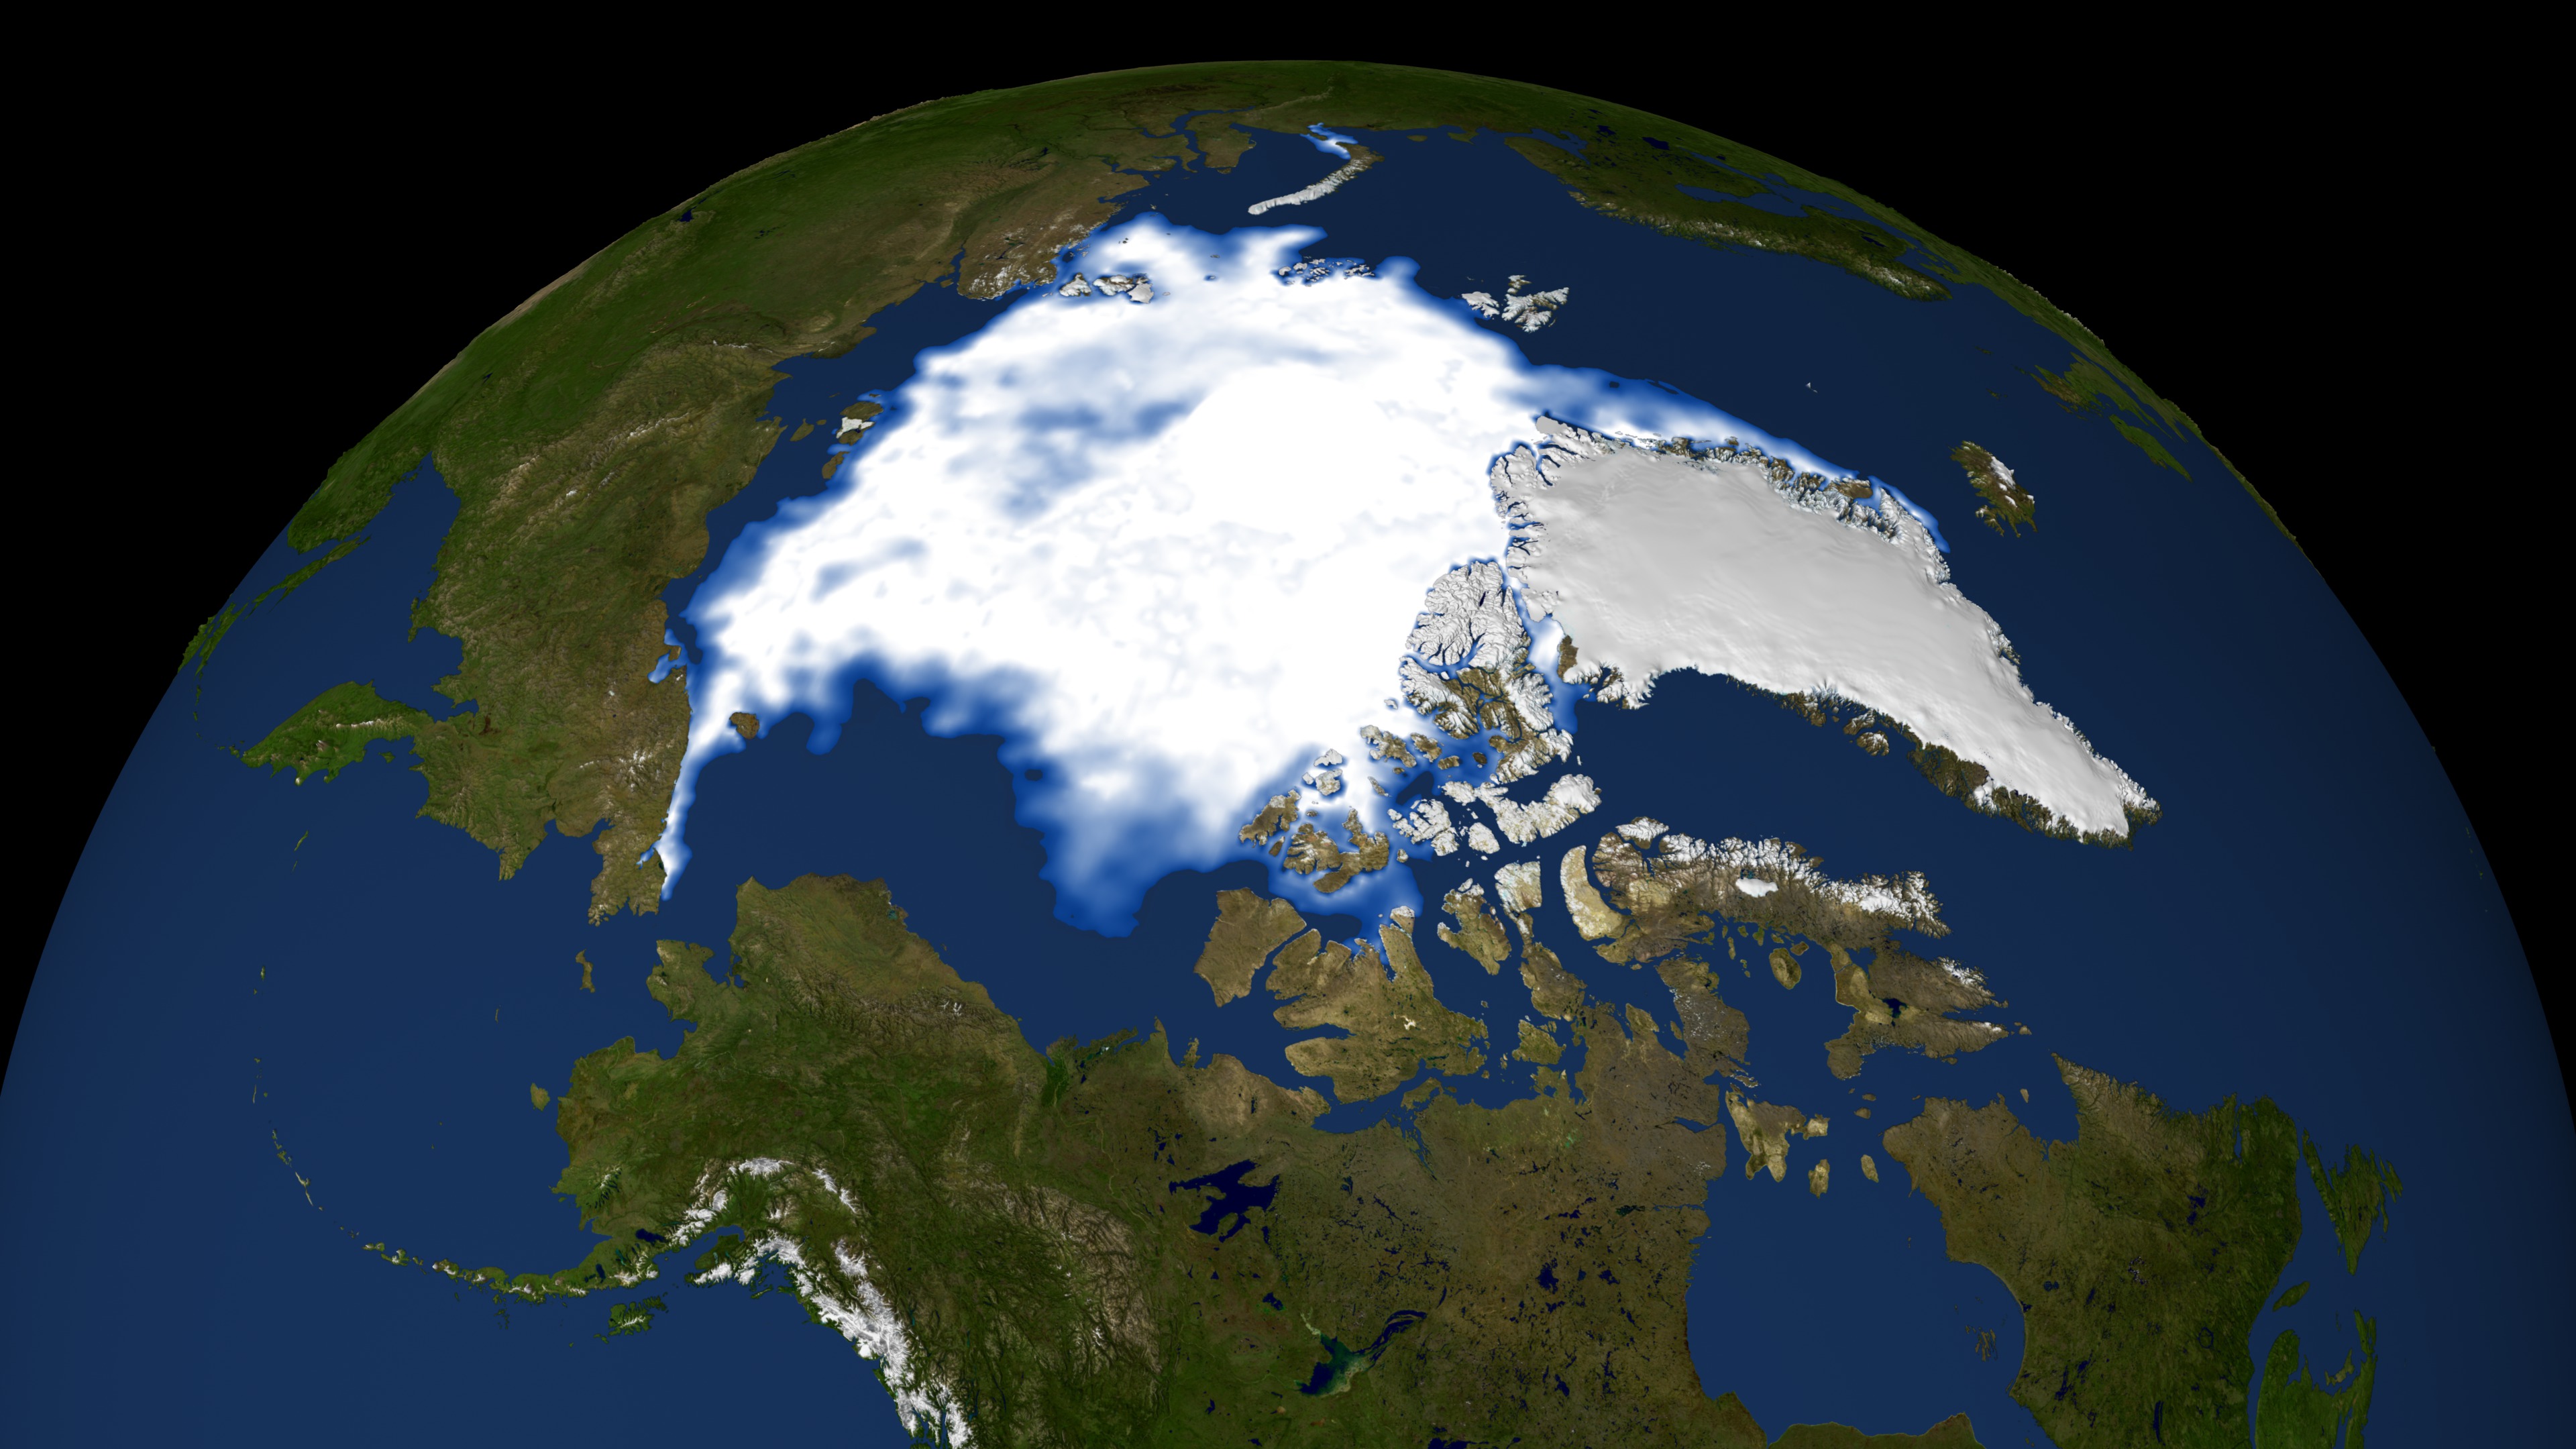
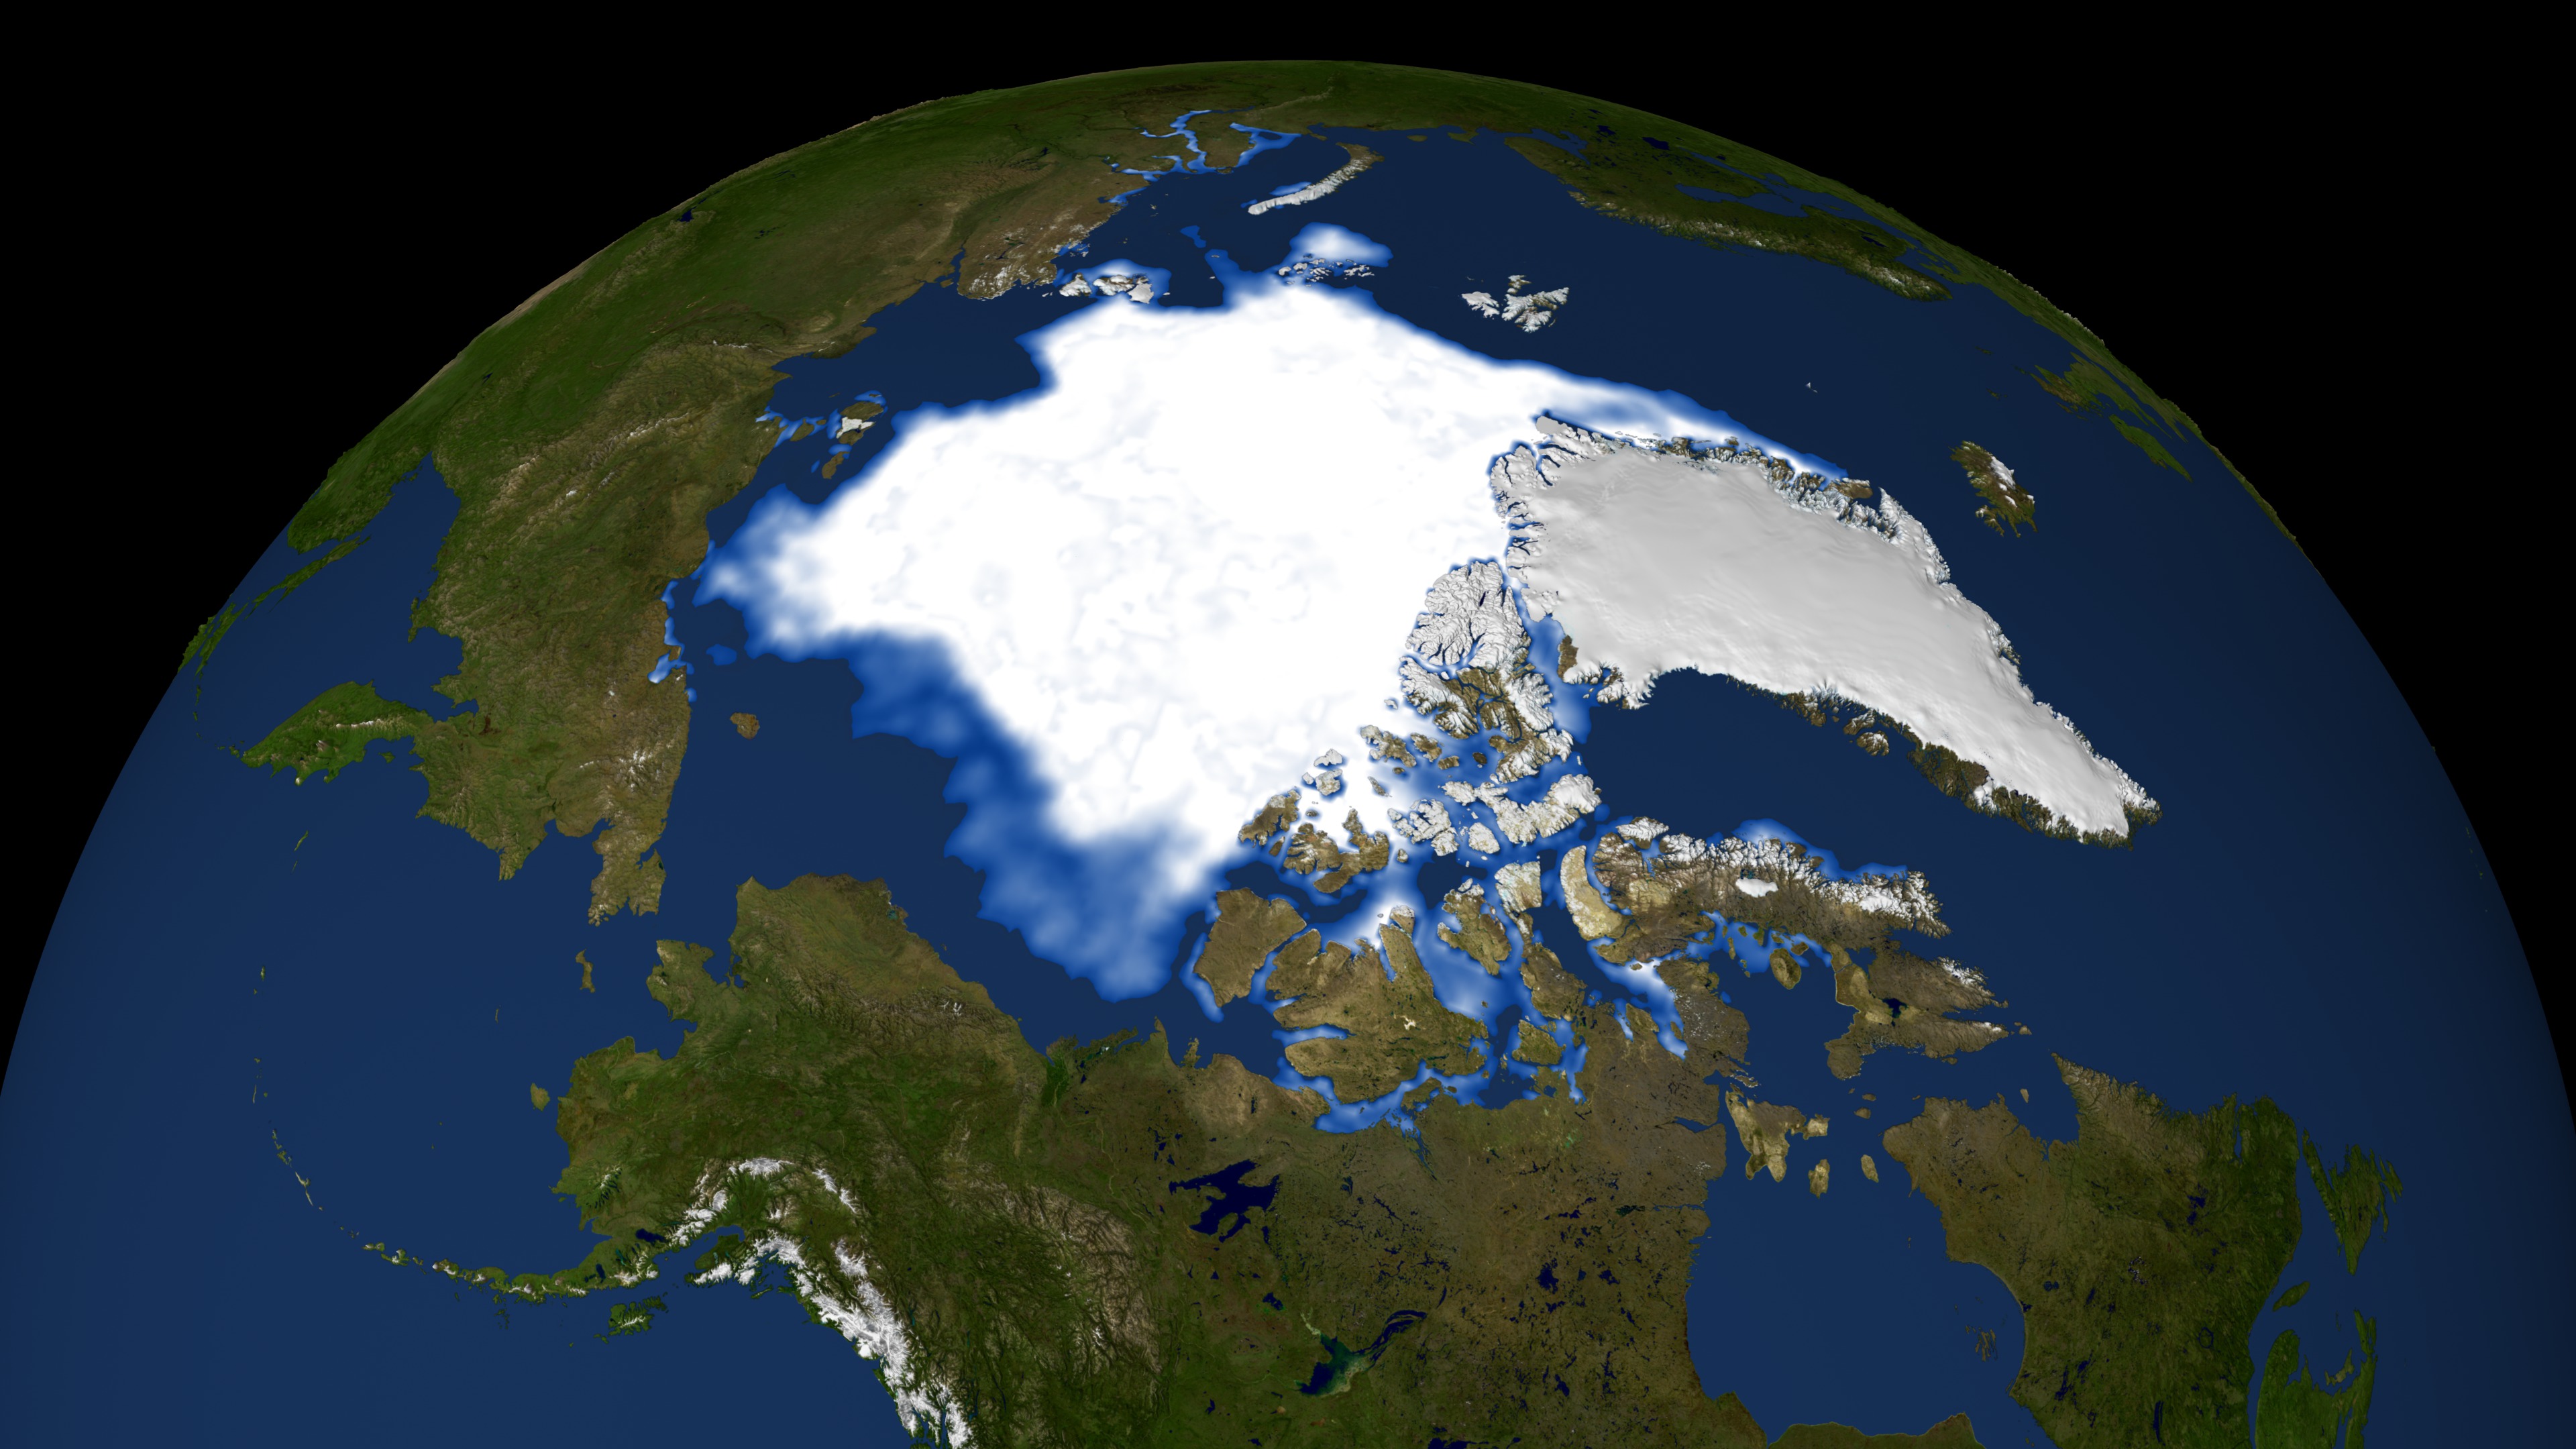
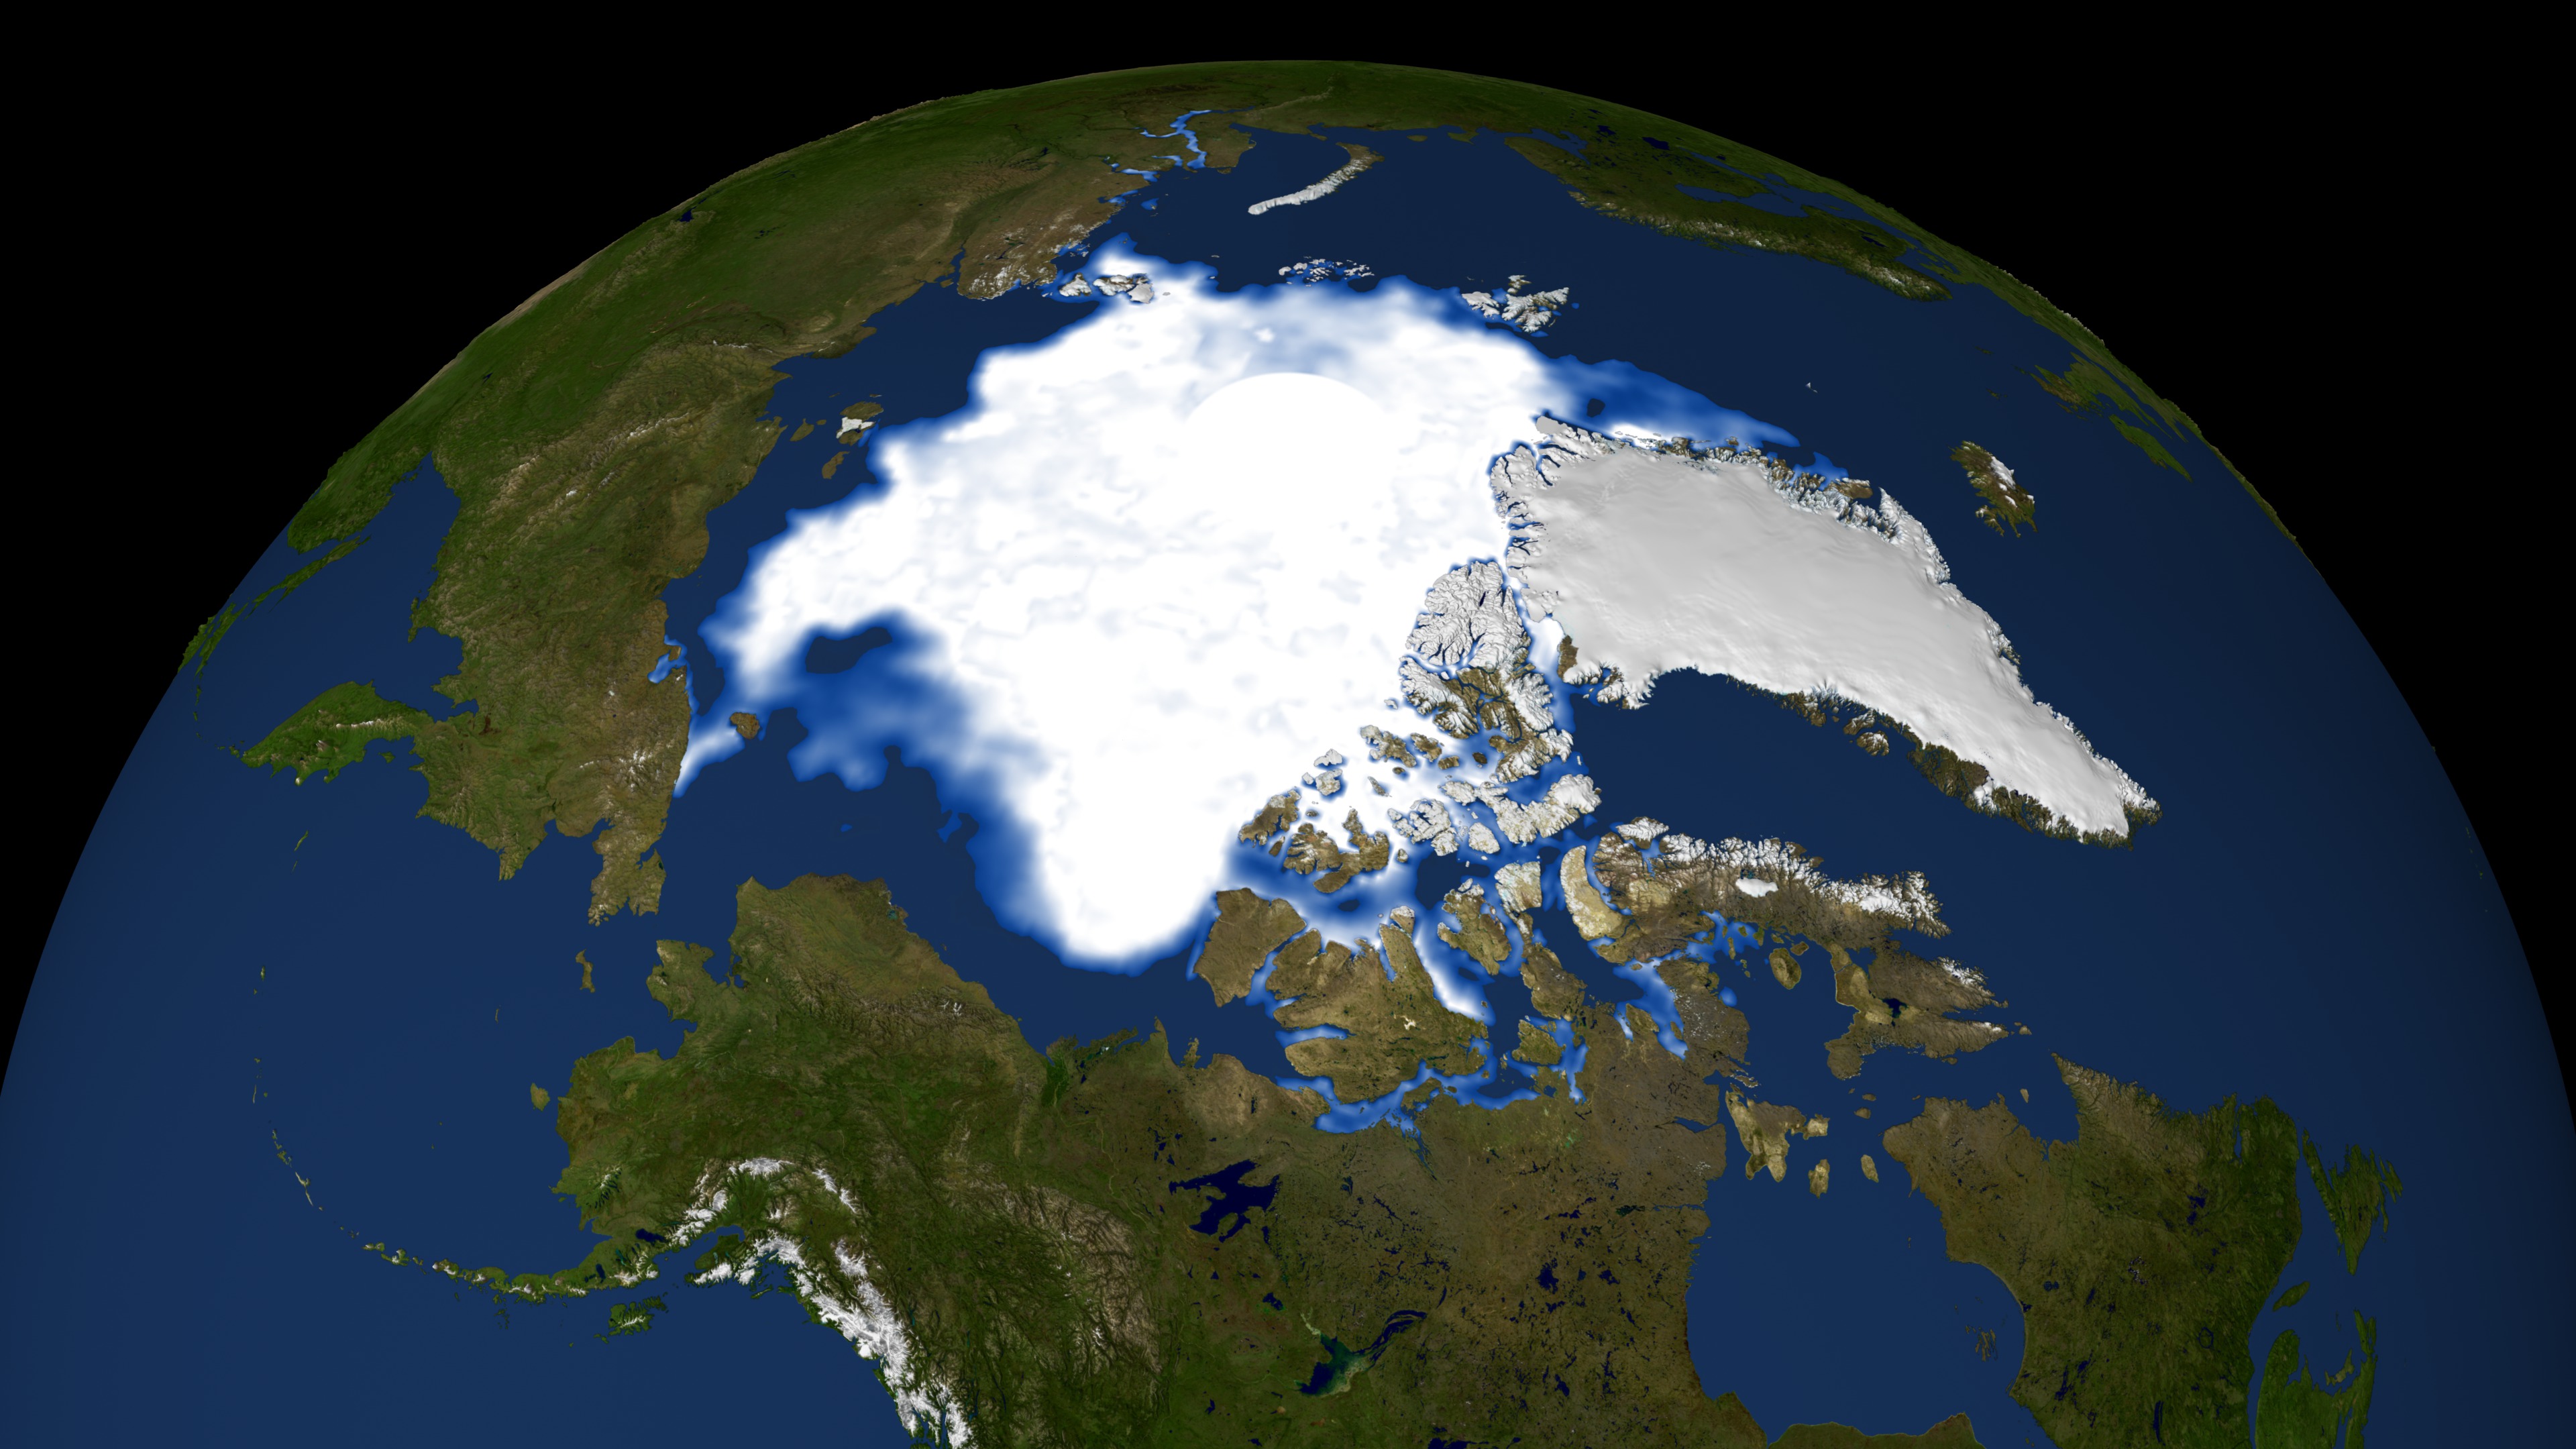
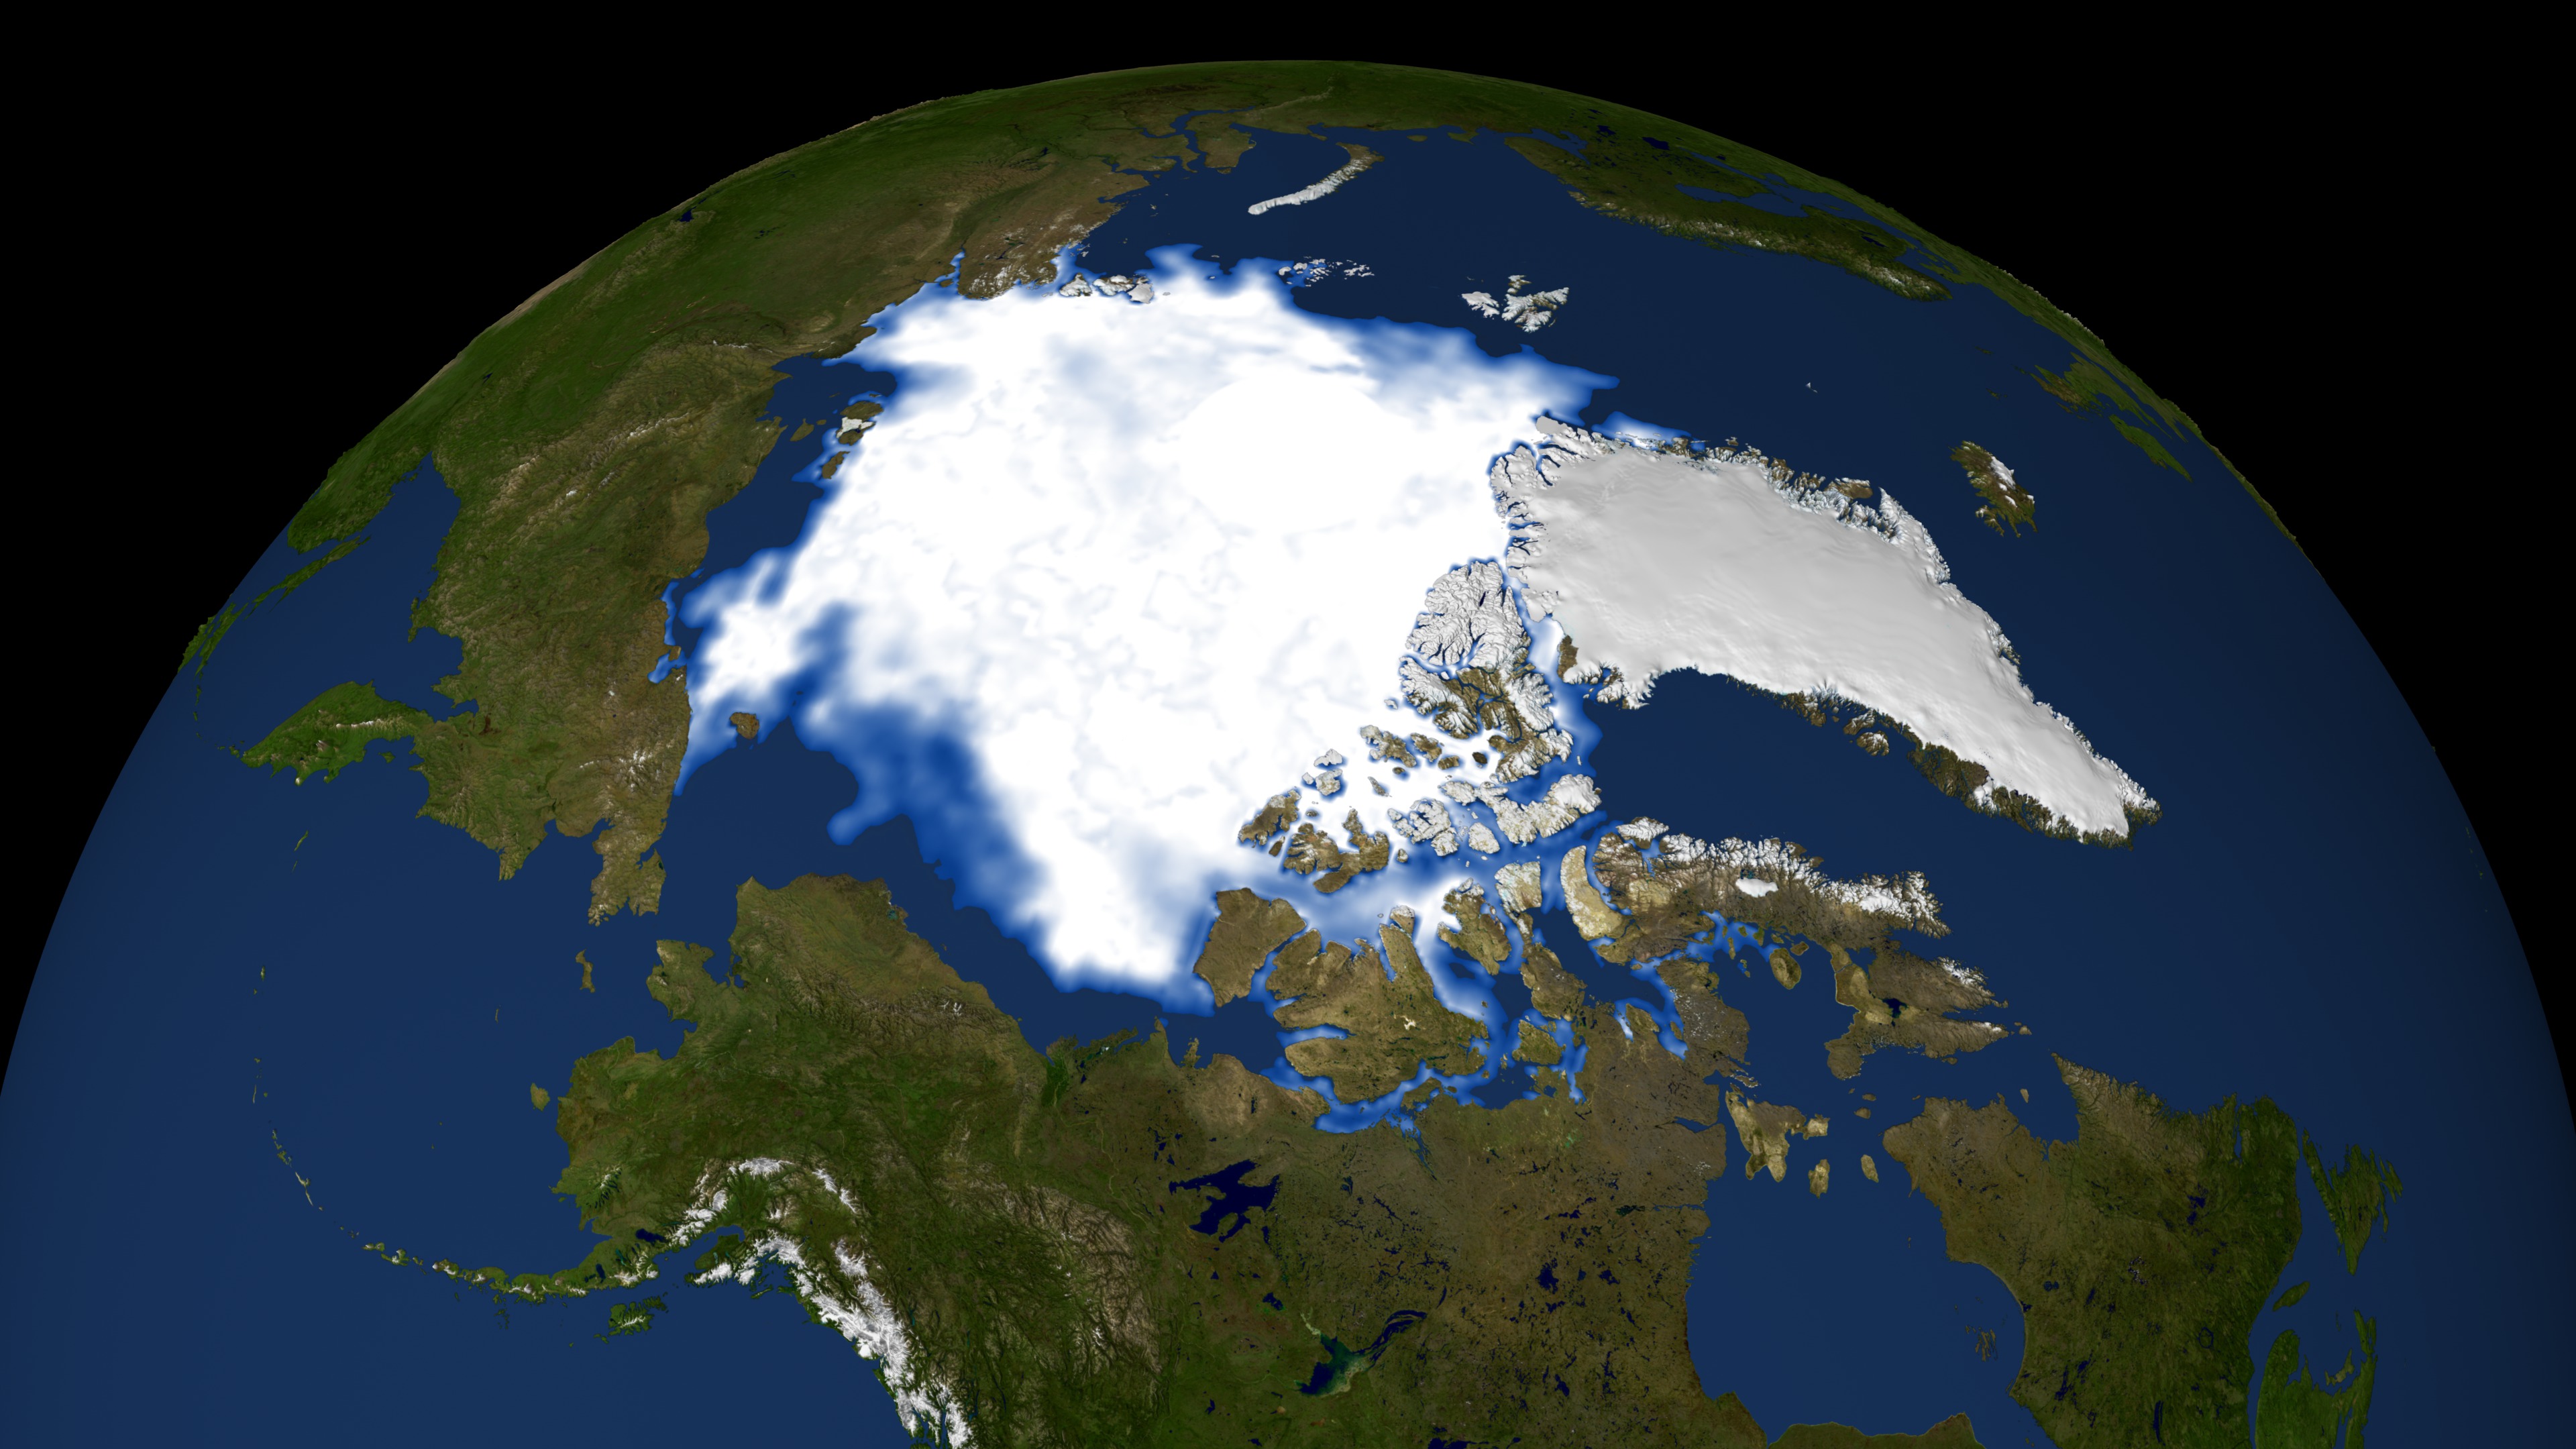

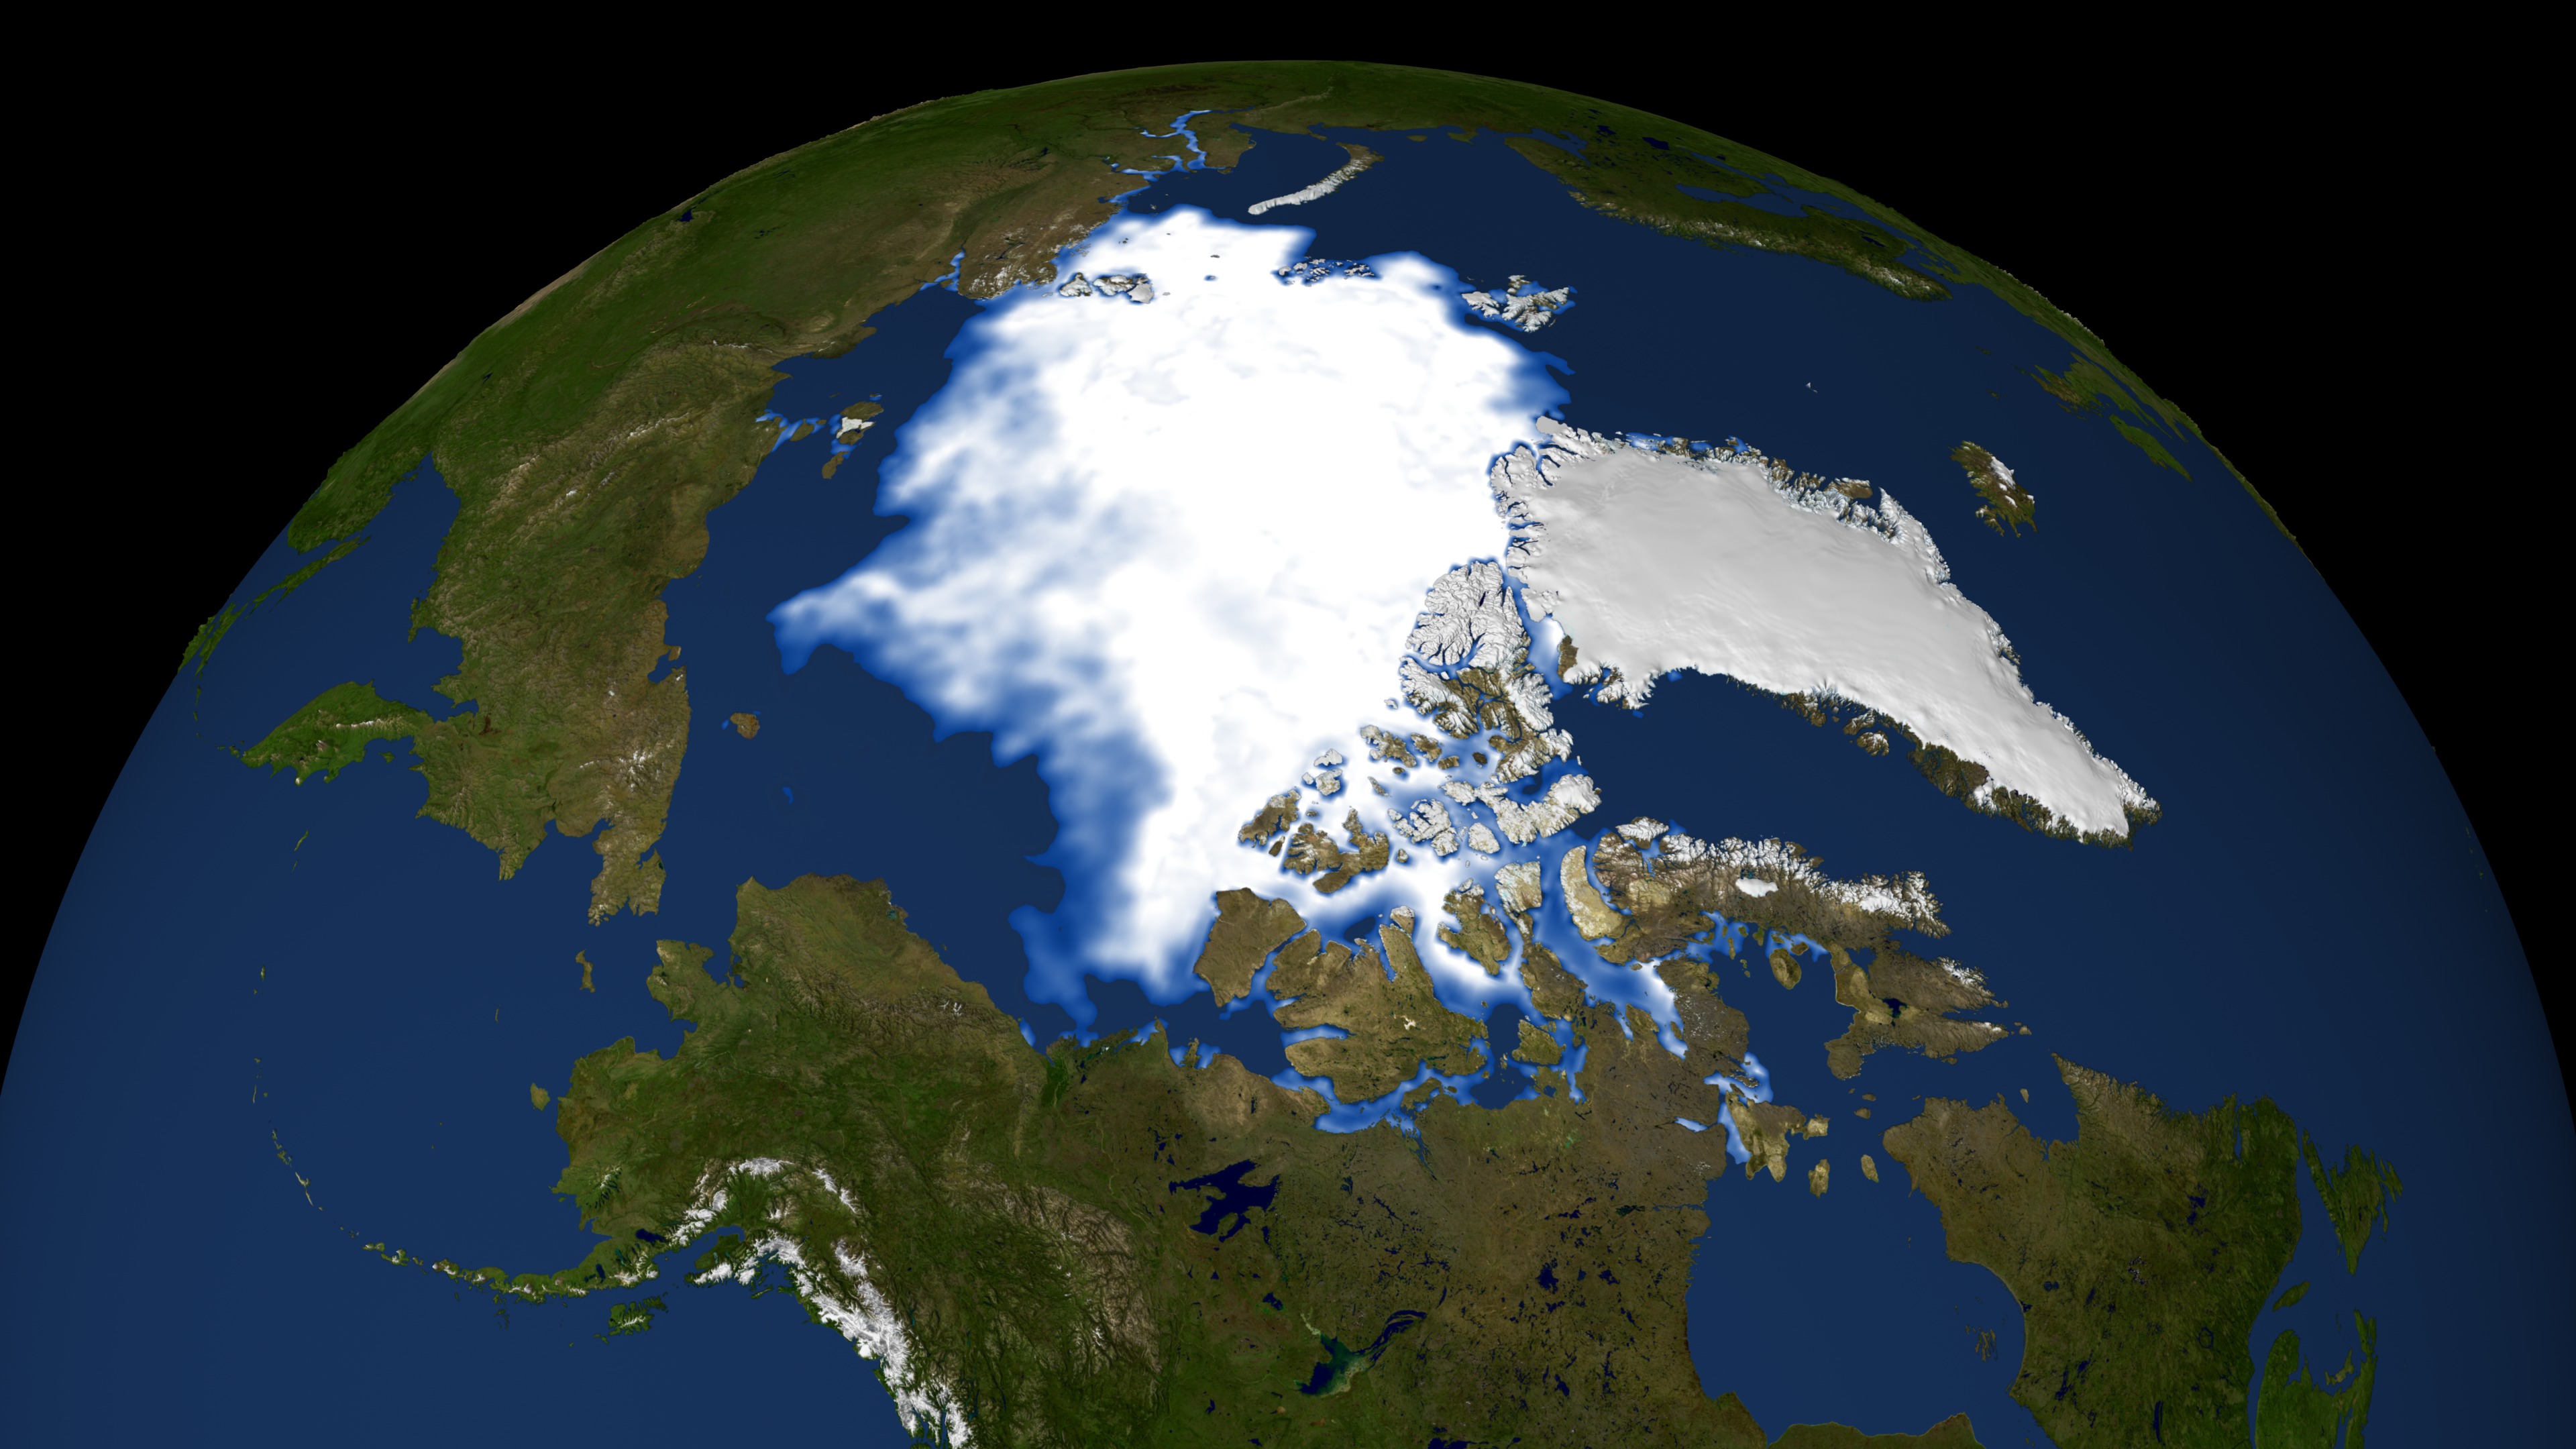

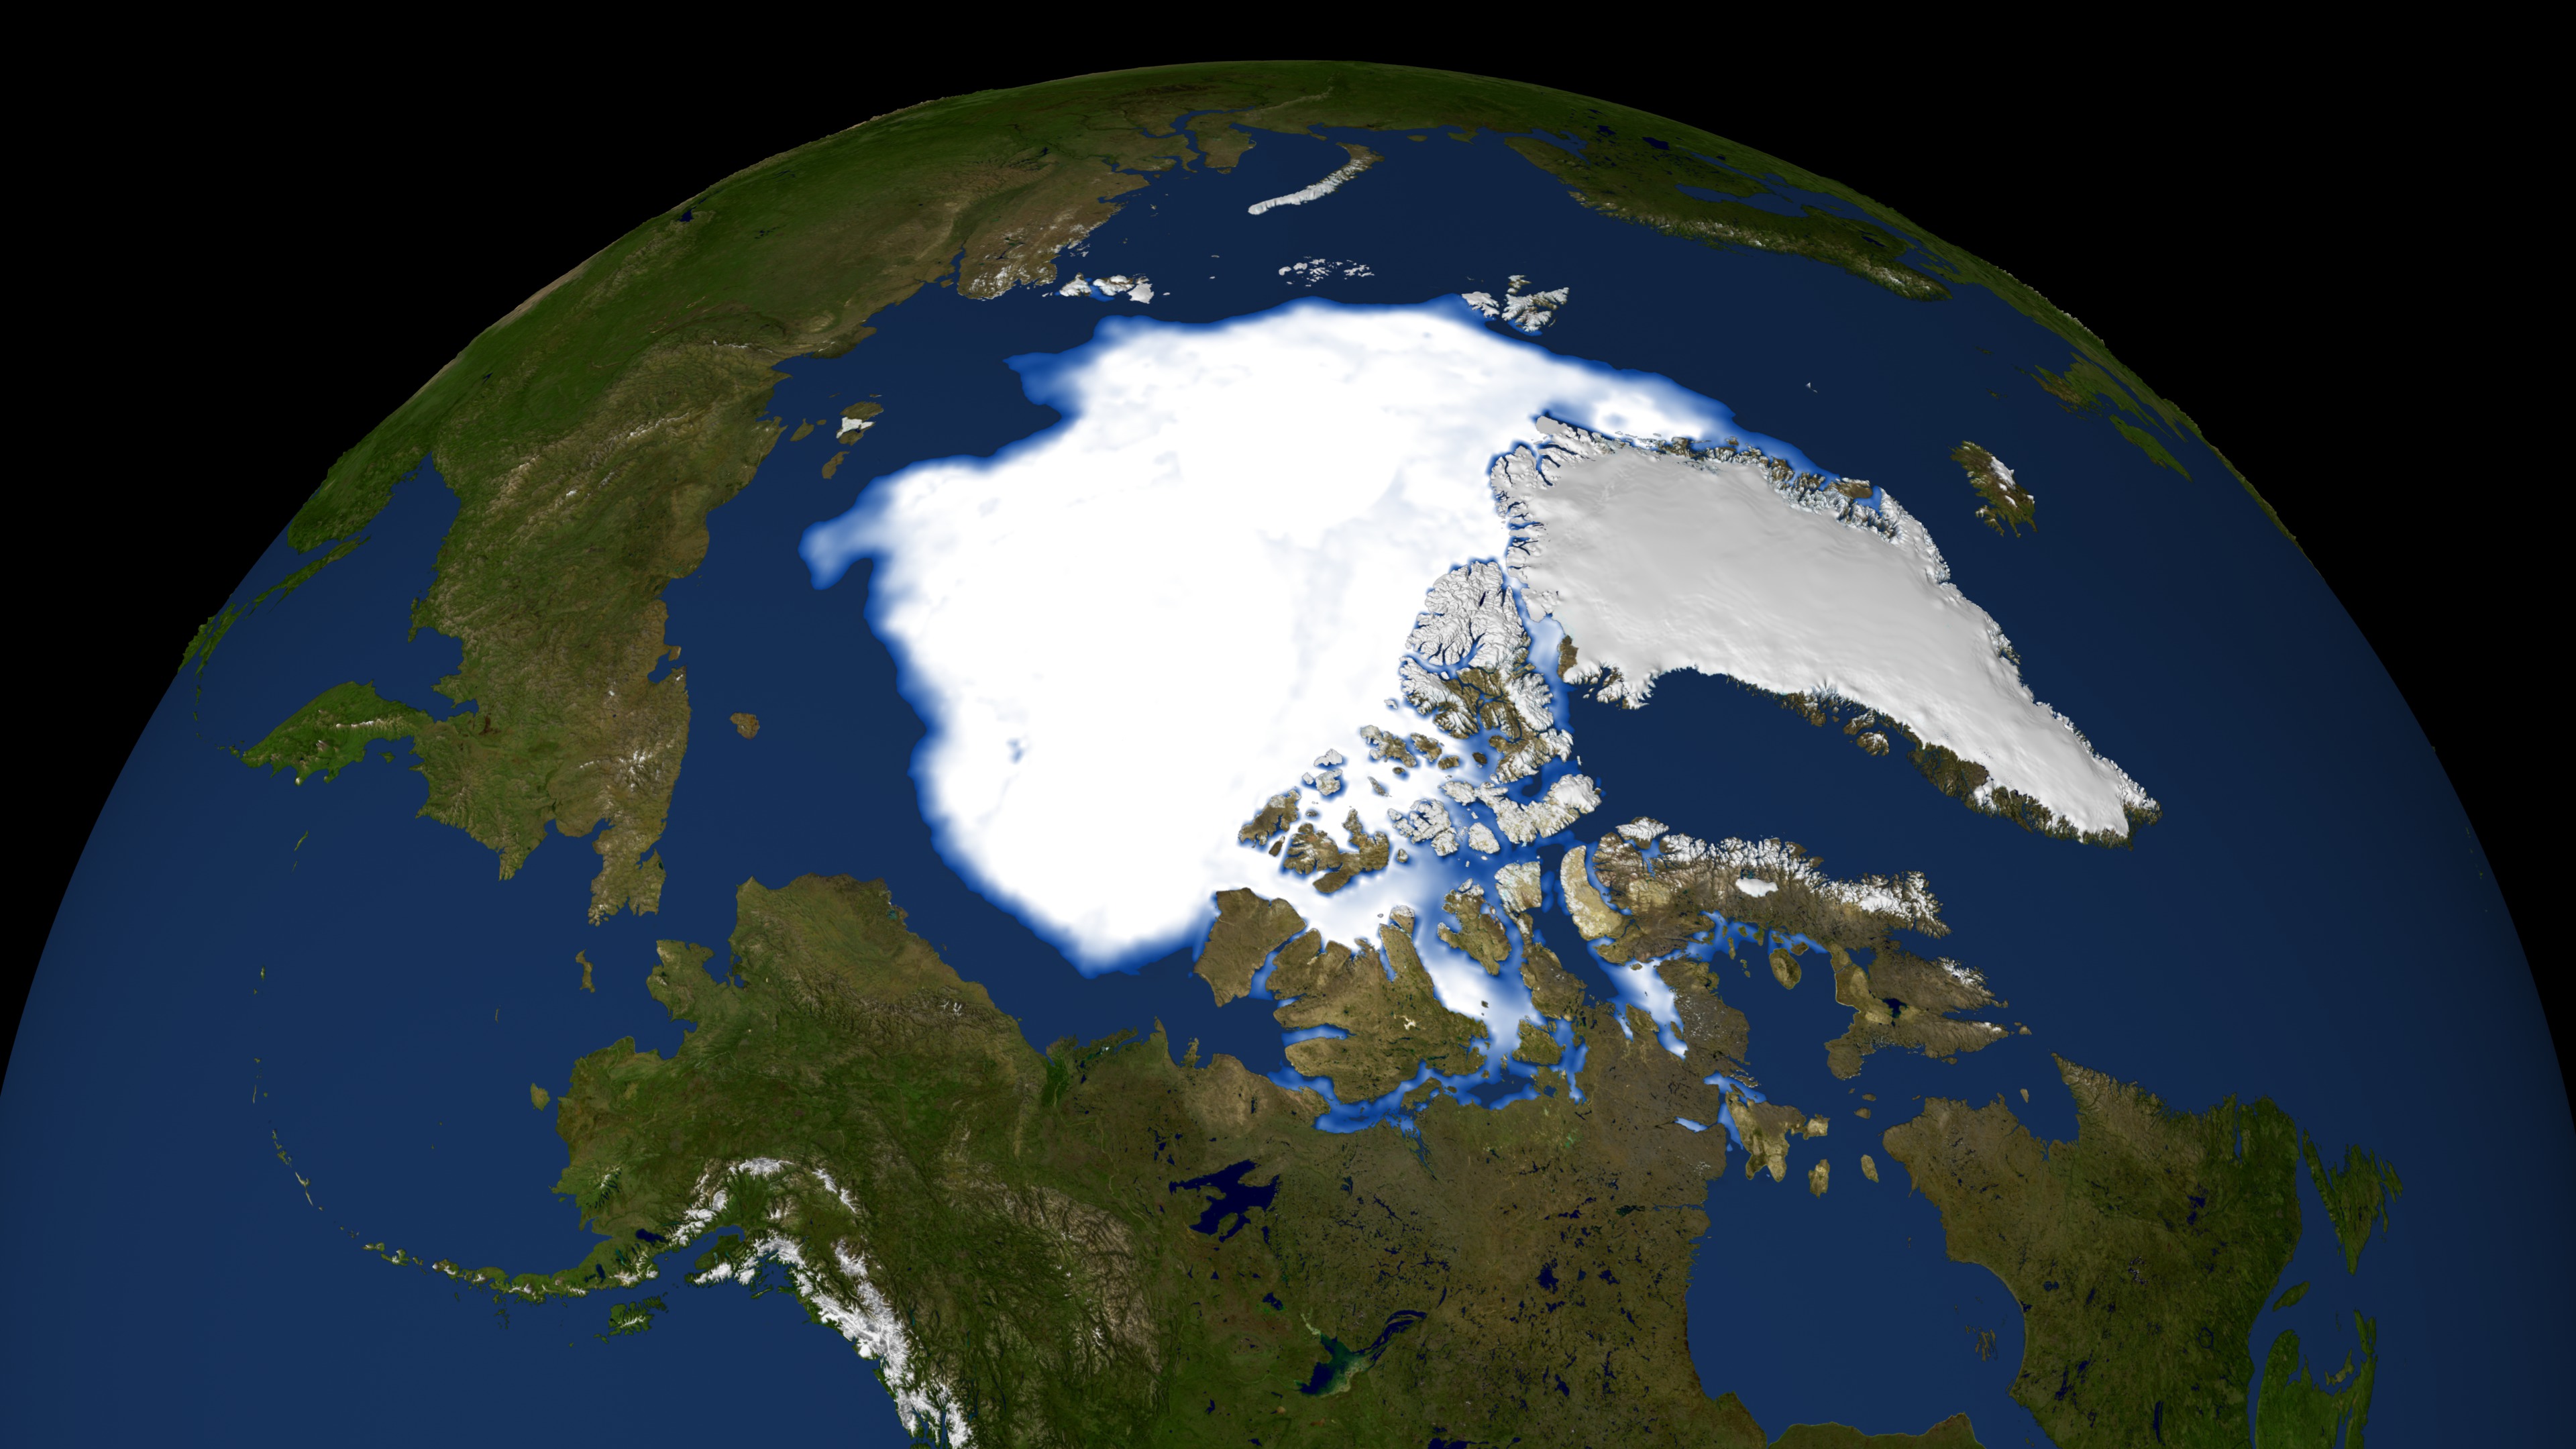
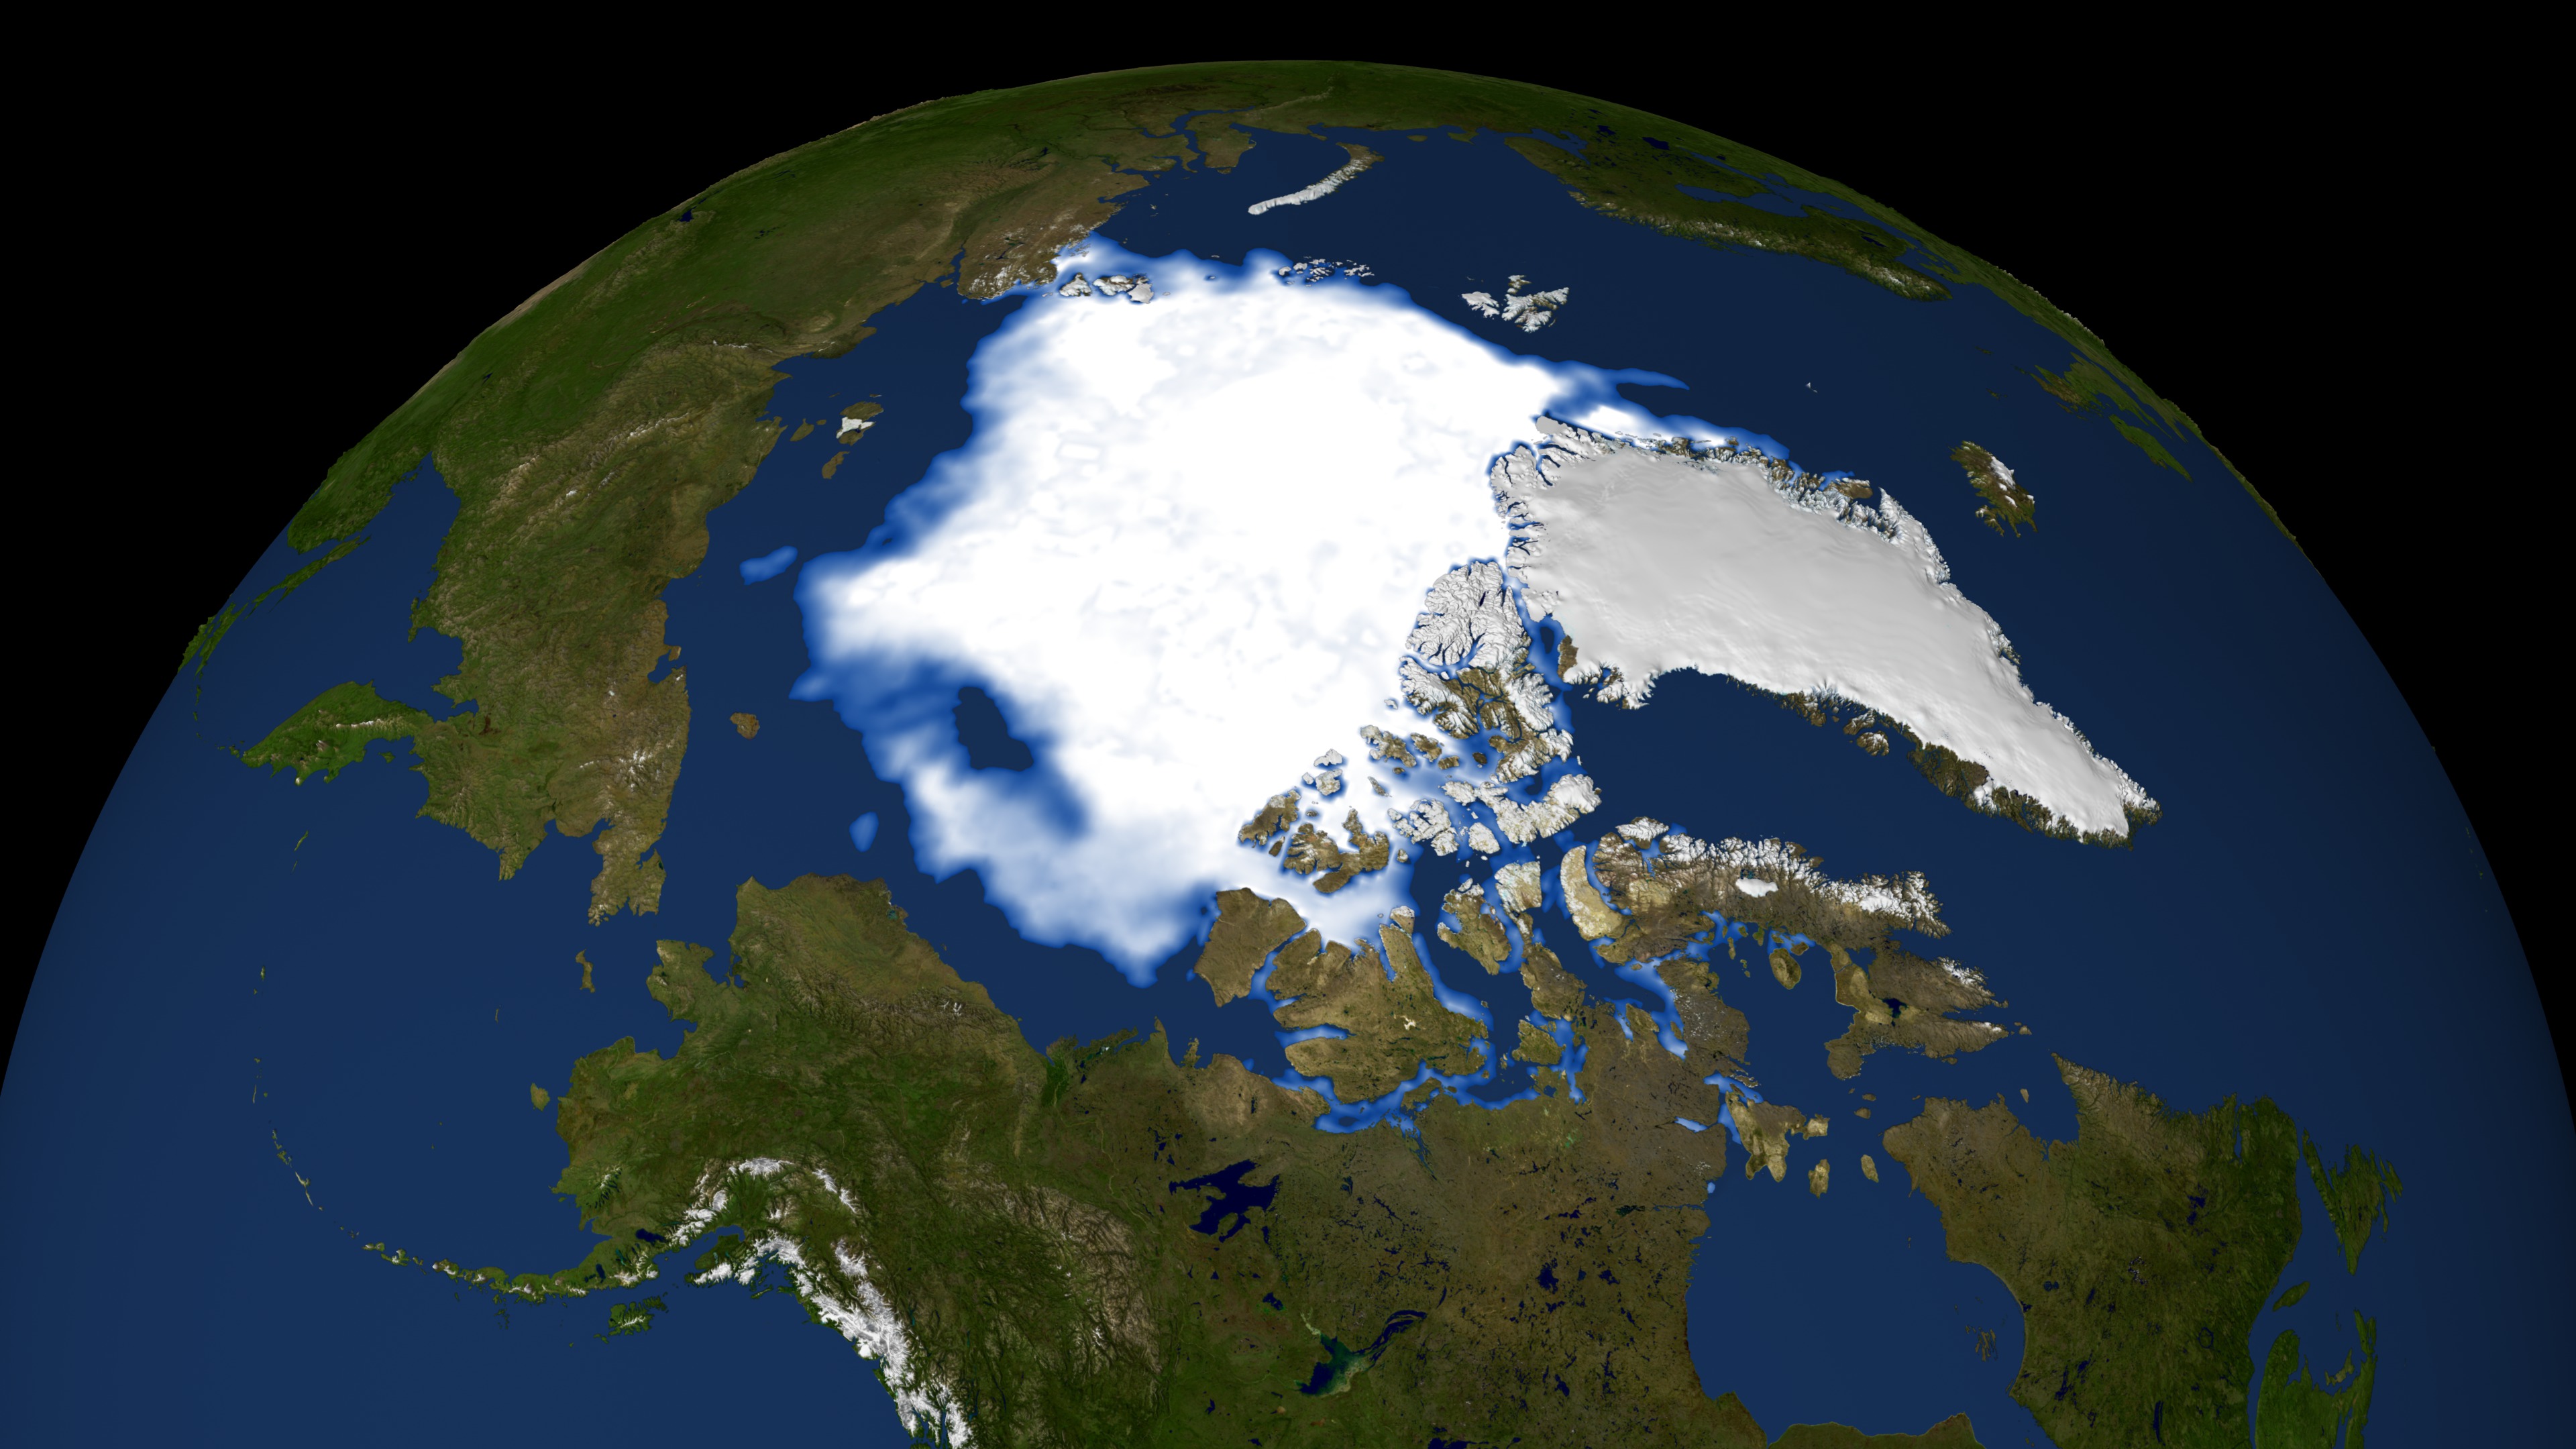
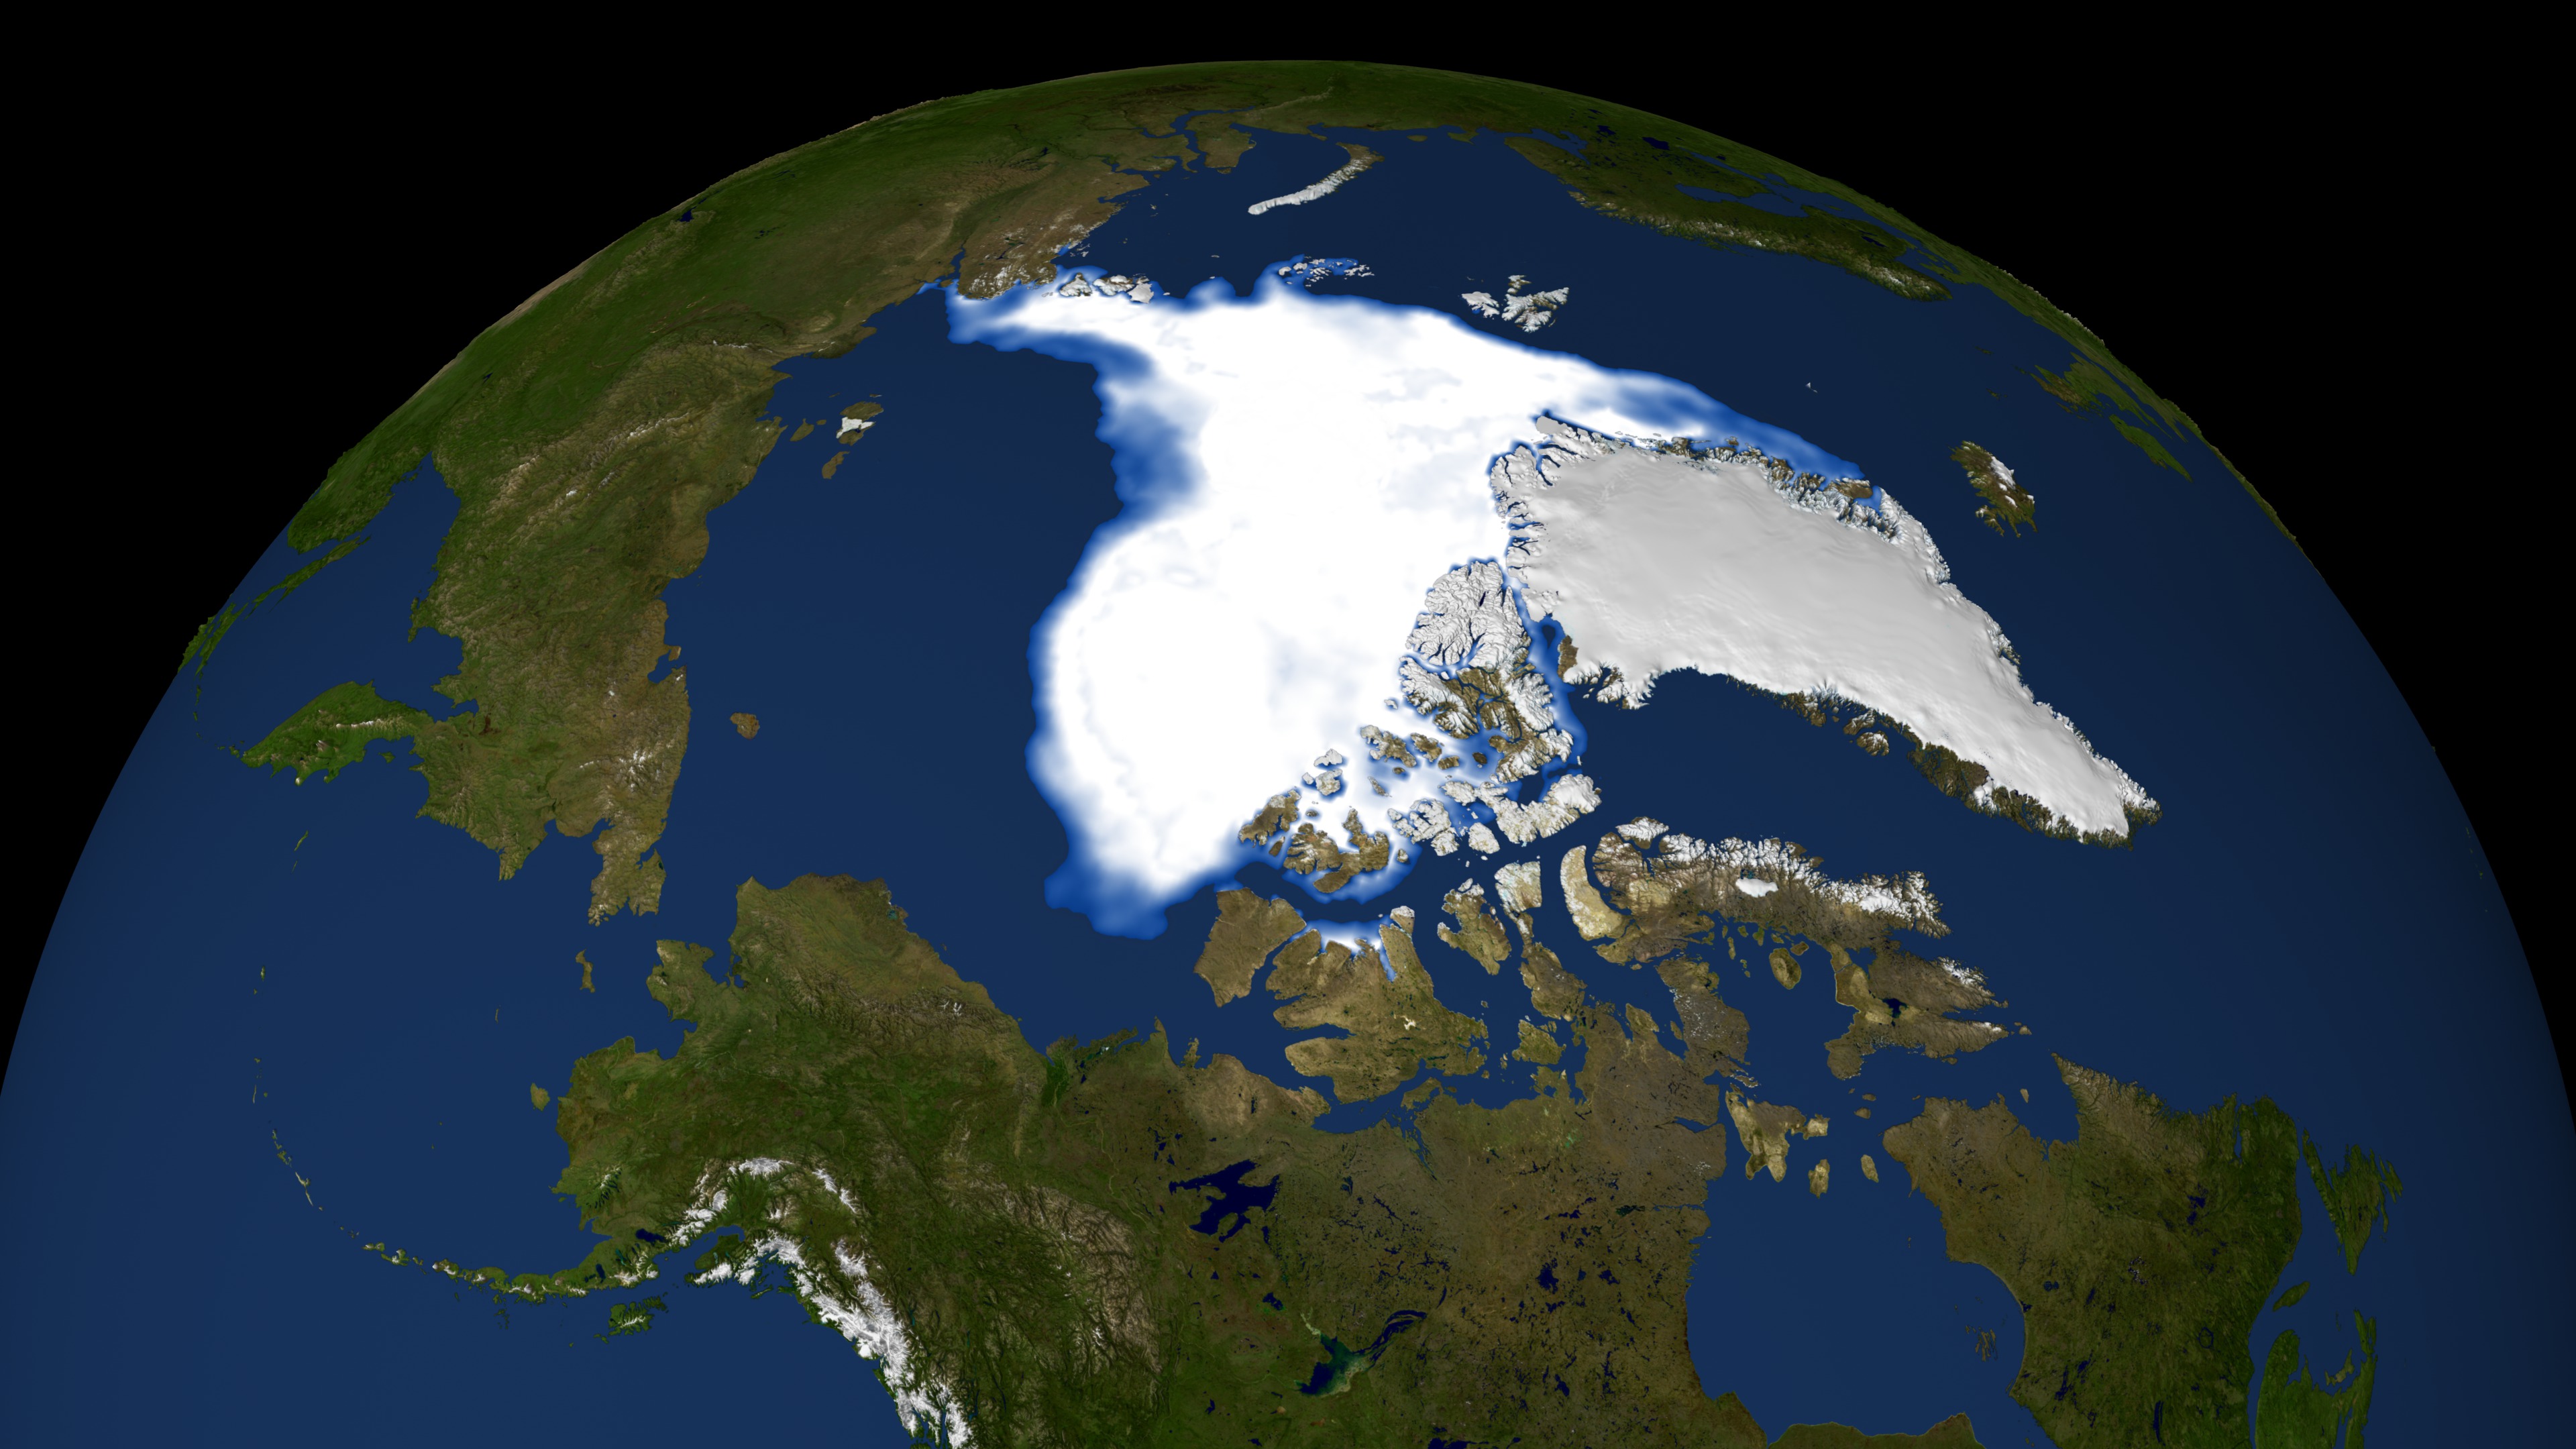
Sea Ice Yearly Minimum with Graph Overlay 1979-2008
There is a newer version of this story located here: https://svs.gsfc.nasa.gov/5170
Newer Versions

Related
Visualization Credits
Lori Perkins (NASA/GSFC): Lead Animator
Greg Shirah (NASA/GSFC): Animator
Cindy Starr (Global Science and Technology, Inc.): Visualizer
Josefino Comiso (NASA/GSFC): Scientist
Greg Shirah (NASA/GSFC): Animator
Cindy Starr (Global Science and Technology, Inc.): Visualizer
Josefino Comiso (NASA/GSFC): Scientist
Please give credit for this item to:
NASA/Goddard Space Flight Center Scientific Visualization Studio. Thanks to Rob Gerston (GSFC) for providing the data.
NASA/Goddard Space Flight Center Scientific Visualization Studio. Thanks to Rob Gerston (GSFC) for providing the data.
Science Paper:
Comiso, J. C., C. L. Parkinson, R. Gersten, and L. Stock, 2008: Accelerated decline in the Arctic sea ice cover. Geophys. Res. Lett., 35, L01703, doi:10.1029/2007GL031972.
Short URL to share this page:
https://svs.gsfc.nasa.gov/3563
Data Used:
Note: While we identify the data sets used in these visualizations, we do not store any further details nor the data sets themselves on our site.
This item is part of this series:
Arctic Annual Sea Ice Minimum with Graph Overlay
Keywords:
DLESE >> Cryology
SVS >> HDTV
SVS >> North Pole
SVS >> Perennial Ice
GCMD >> Earth Science >> Cryosphere >> Sea Ice
GCMD >> Earth Science >> Cryosphere >> Sea Ice >> Sea Ice Concentration
SVS >> iPod
SVS >> Climate Change
SVS >> Copenhagen
SVS >> For Educators
SVS >> Greenhouse Effect
SVS >> Line Graph
SVS >> Arctic Circle >> Ice
SVS >> Arctic Circle >> Glaciers
NASA Science >> Earth
GCMD keywords can be found on the Internet with the following citation: Olsen, L.M., G. Major, K. Shein, J. Scialdone, S. Ritz, T. Stevens, M. Morahan, A. Aleman, R. Vogel, S. Leicester, H. Weir, M. Meaux, S. Grebas, C.Solomon, M. Holland, T. Northcutt, R. A. Restrepo, R. Bilodeau, 2013. NASA/Global Change Master Directory (GCMD) Earth Science Keywords. Version 8.0.0.0.0
Comiso, J. C., C. L. Parkinson, R. Gersten, and L. Stock, 2008: Accelerated decline in the Arctic sea ice cover. Geophys. Res. Lett., 35, L01703, doi:10.1029/2007GL031972.
Short URL to share this page:
https://svs.gsfc.nasa.gov/3563
Data Used:
Comiso's September Minimum Sea Ice Concentration
Data Compilation - NASA/GSFC - 1979 through 2008DMSP/SSM/I
1979 through 2008
Defense Meteorological Satellite Program Special Sensor Microwave Imager
This item is part of this series:
Arctic Annual Sea Ice Minimum with Graph Overlay
Keywords:
DLESE >> Cryology
SVS >> HDTV
SVS >> North Pole
SVS >> Perennial Ice
GCMD >> Earth Science >> Cryosphere >> Sea Ice
GCMD >> Earth Science >> Cryosphere >> Sea Ice >> Sea Ice Concentration
SVS >> iPod
SVS >> Climate Change
SVS >> Copenhagen
SVS >> For Educators
SVS >> Greenhouse Effect
SVS >> Line Graph
SVS >> Arctic Circle >> Ice
SVS >> Arctic Circle >> Glaciers
NASA Science >> Earth
GCMD keywords can be found on the Internet with the following citation: Olsen, L.M., G. Major, K. Shein, J. Scialdone, S. Ritz, T. Stevens, M. Morahan, A. Aleman, R. Vogel, S. Leicester, H. Weir, M. Meaux, S. Grebas, C.Solomon, M. Holland, T. Northcutt, R. A. Restrepo, R. Bilodeau, 2013. NASA/Global Change Master Directory (GCMD) Earth Science Keywords. Version 8.0.0.0.0


