Earth
ID: 31231
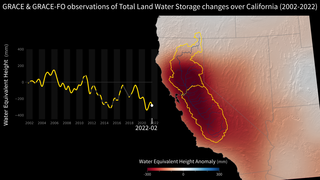
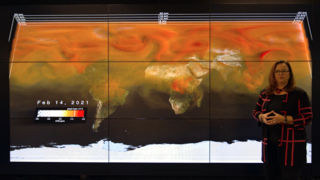
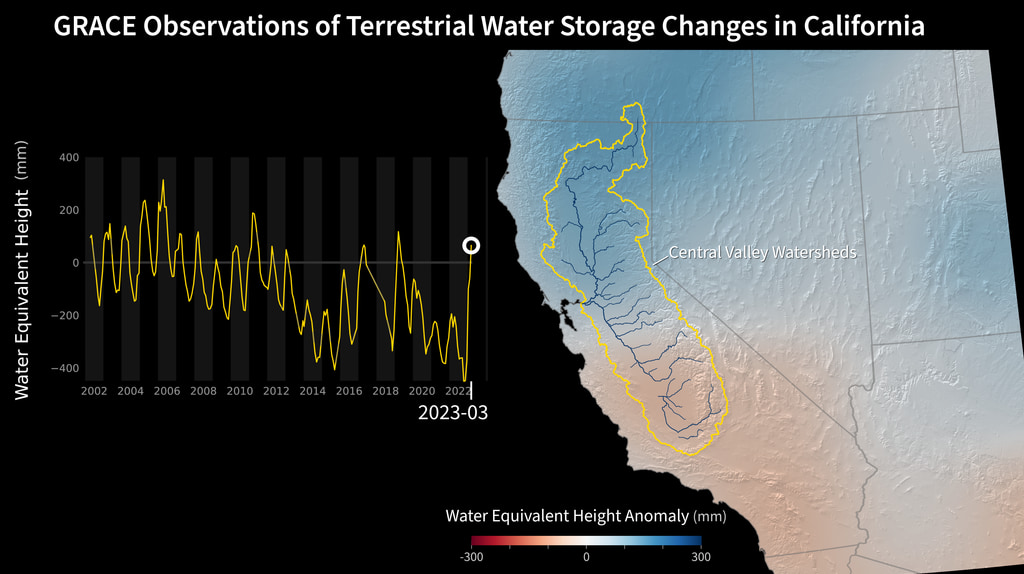
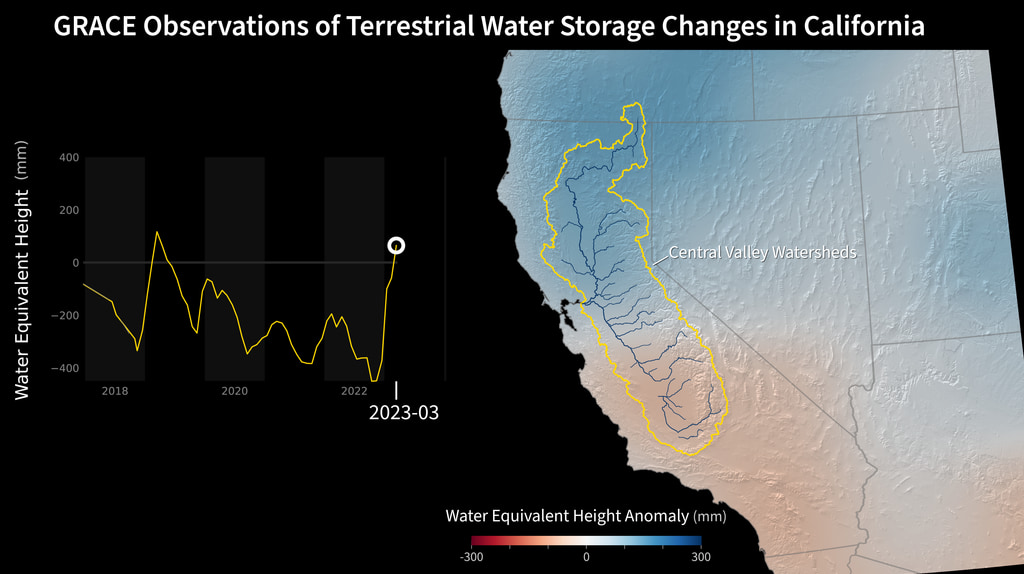
The joint U.S.-German Gravity Recovery and Climate Experiment (GRACE, 2002 - 2017) mission, and its successor GRACE Follow-On (launched in 2018), map month-to-month changes in Earth's gravity field resulting from the movement of mass, such as water, near the surface of the planet. This animation shows how the total amount of water (snow, surface water, soil moisture, and groundwater) varies in space and time, with the passage of dry seasons and wet seasons as well as with flooding, drought, and transport due to water management. Blue colors represent wetter than average conditions (relative to 2004-2010), while red colors represent drier than average conditions. The yellow line in the graph on the left shows the evolution of the month-to-month variations for the area outlined in yellow on the map.
The Sacramento, San Joaquin, and Tulare basins are outlined in yellow, and rivers and tributaries are shown as blue lines. The basins include California's Central Valley, the most productive agricultural region in the U.S. Repeated drought conditions and increased water use in California have led to a long-term decline of terrestrial water, interspersed with above-average precipitation periods (e.g., 2015/2016) that have allowed some recovery of the land water storage.
Monitoring California Groundwater
The Sacramento, San Joaquin, and Tulare basins are outlined in yellow, and rivers and tributaries are shown as blue lines. The basins include California's Central Valley, the most productive agricultural region in the U.S. Repeated drought conditions and increased water use in California have led to a long-term decline of terrestrial water, interspersed with above-average precipitation periods (e.g., 2015/2016) that have allowed some recovery of the land water storage.
Older Version
Credits
Please give credit for this item to:
NASA/JPL-Caltech
NASA/JPL-Caltech
Short URL to share this page:
https://svs.gsfc.nasa.gov/31231
Missions:
Gravity Recovery and Climate Experiment (GRACE)
Gravity Recovery and Climate Experiment Follow-on (GRACE-FO)
Data Used:
Note: While we identify the data sets used in these visualizations, we do not store any further details nor the data sets themselves on our site.
Keywords:
GCMD >> Location >> California
SVS >> Hyperwall
NASA Science >> Earth
GCMD >> Earth Science >> Human Dimensions >> Natural Hazards >> Droughts
GCMD >> Earth Science >> Terrestrial Hydrosphere >> Ground Water
GCMD >> Earth Science >> Terrestrial Hydrosphere >> Surface Water >> Floods
GCMD keywords can be found on the Internet with the following citation: Olsen, L.M., G. Major, K. Shein, J. Scialdone, S. Ritz, T. Stevens, M. Morahan, A. Aleman, R. Vogel, S. Leicester, H. Weir, M. Meaux, S. Grebas, C.Solomon, M. Holland, T. Northcutt, R. A. Restrepo, R. Bilodeau, 2013. NASA/Global Change Master Directory (GCMD) Earth Science Keywords. Version 8.0.0.0.0
https://svs.gsfc.nasa.gov/31231
Missions:
Gravity Recovery and Climate Experiment (GRACE)
Gravity Recovery and Climate Experiment Follow-on (GRACE-FO)
Data Used:
Gravity Recovery and Climate Experiment (GRACE)/Terrestrial Water Storage Anomaly also referred to as: TWS Anomaly
AnalysisGravity Recovery and Climate Experiment (GRACE) Follow-On/Terrestrial Water Storage Anomaly also referred to as: GRACE Follow-On
Observed Data - NASA/German Research Center for GeosciencesKeywords:
GCMD >> Location >> California
SVS >> Hyperwall
NASA Science >> Earth
GCMD >> Earth Science >> Human Dimensions >> Natural Hazards >> Droughts
GCMD >> Earth Science >> Terrestrial Hydrosphere >> Ground Water
GCMD >> Earth Science >> Terrestrial Hydrosphere >> Surface Water >> Floods
GCMD keywords can be found on the Internet with the following citation: Olsen, L.M., G. Major, K. Shein, J. Scialdone, S. Ritz, T. Stevens, M. Morahan, A. Aleman, R. Vogel, S. Leicester, H. Weir, M. Meaux, S. Grebas, C.Solomon, M. Holland, T. Northcutt, R. A. Restrepo, R. Bilodeau, 2013. NASA/Global Change Master Directory (GCMD) Earth Science Keywords. Version 8.0.0.0.0

