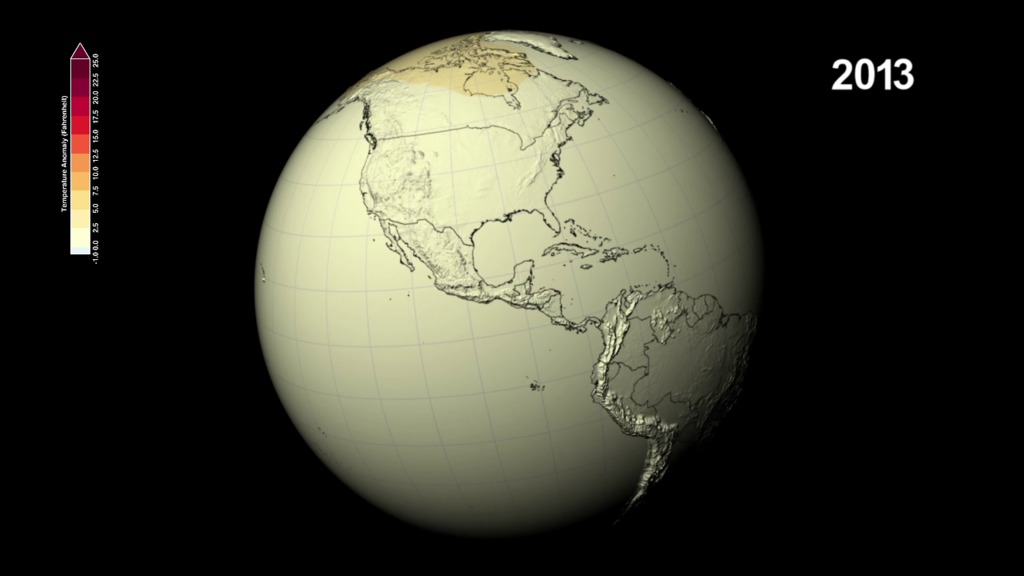
IPCC Projections of Temperature and Precipitation in the 21st Century
For the IPCC's Physical Science Basis and Summary for Policymakers reports, scientists referenced an international climate modeling effort to study how the Earth might respond to four different scenarios of how much carbon dioxide and other greenhouse gases would be emitted into the atmosphere throughout the 21st century. The Summary for Policymakers, the first official piece of the group's Fifth Assessment Report, was released Fri., Sept. 27.
That modeling effort, called the Coupled Model Intercomparison Project Phase 5 (CMIP5), includes dozens of climate models from institutions around the world, including from NASA's Goddard Institute for Space Studies.
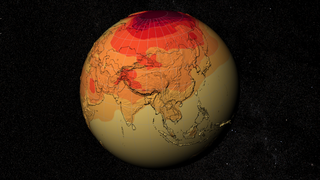
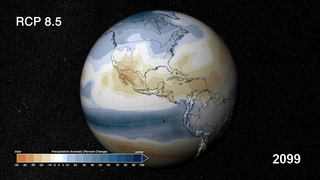
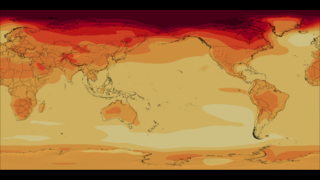
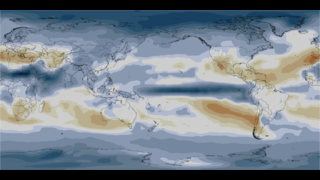
To produce visualizations that show temperature and precipitation changes similar to those included in the IPCC report, the NASA Center for Climate Simulation calculated mean model results for each of the four emissions scenarios. The final products are visual representations how much temperature and precipitation patterns would change through 2100 compared to the historical average from the end of the 20th century. The changes shown compare the model projections to the average temperature and precipitation benchmarks observed from 1971-2000. This baseline is different from the IPCC report, which uses a 1986-2005 baseline. Because the reference period from 1986-2005 was slightly warmer than 1971-2000, the visualizations are slightly different than those in the report, even though the same model data is used.
Related
Credits
Greg Shirah (NASA/GSFC): Animator
Matthew R. Radcliff (USRA): Video Editor
Matthew R. Radcliff (USRA): Narrator
Matthew R. Radcliff (USRA): Producer
Gerald Potter (USRA): Scientist
Laura Carriere (CSC): Scientist
Jay Alder (USGS): Scientist
Ellen Salmon (NASA/GSFC): Scientist
Michael Wehner (Lawrence Berkeley National Laboratory): Scientist
Dean Williams (Lawrence Livermore National Laboratory): Scientist
Jarrett Cohen (GST): Project Support
Patrick Lynch (Wyle Information Systems): Writer
NASA's Goddard Space Flight Center
Additional credits should also go to the IPCC community, without whom these visualizations would not have been possible. Please click here for all the IPCC contributors.
https://svs.gsfc.nasa.gov/11376
This item is part of this series:
Narrated Movies
Goddard TV Tape:
G2013-080 -- IPCC Projections
Keywords:
SVS >> Global Warming
SVS >> HDTV
SVS >> Temperature Trend
GCMD >> Earth Science >> Atmosphere >> Precipitation
SVS >> Hyperwall
SVS >> Climate Change
DLESE >> Narrated
SVS >> Climate Patterns
NASA Science >> Earth
GCMD keywords can be found on the Internet with the following citation: Olsen, L.M., G. Major, K. Shein, J. Scialdone, S. Ritz, T. Stevens, M. Morahan, A. Aleman, R. Vogel, S. Leicester, H. Weir, M. Meaux, S. Grebas, C.Solomon, M. Holland, T. Northcutt, R. A. Restrepo, R. Bilodeau, 2013. NASA/Global Change Master Directory (GCMD) Earth Science Keywords. Version 8.0.0.0.0

